目标检测性能评价指标 (IOU mAP)
检测评价函数 Intersection-over-Union (IOU)
1、概念
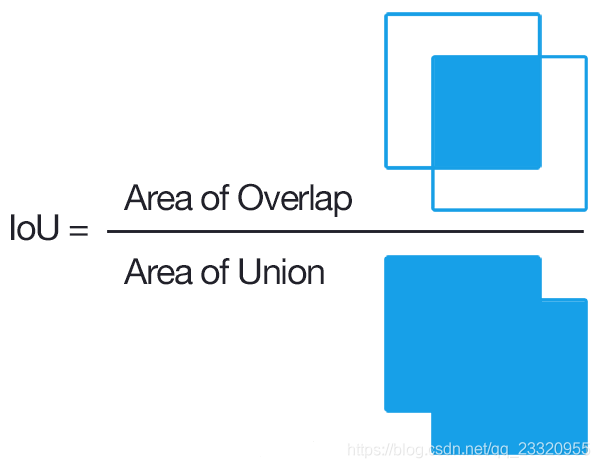
在目标检测的评价体系中,有一个参数叫做 IOU ,简单来讲就是模型产生的目标窗口和原来标记窗口的交叠率。具体我们可以简单的理解为: 即检测结果DetectionResult与Ground Truth的交集比上它们的并集,即为检测的准确率 IOU :
I O U = G T ⋂ D R G T ⋃ D R IOU = \frac{GT\bigcap DR}{GT\bigcup DR} IOU=GT⋃DRGT⋂DR
GT = GroundTruth, DR = DetectionResult;

2、Python 代码实现
def bb_intersection_over_union(boxA, boxB):
	# determine the (x, y)-coordinates of the intersection rectangle
	xA = max(boxA[0], boxB[0])
	yA = max(boxA[1], boxB[1])
	xB = min(boxA[2], boxB[2])
	yB = min(boxA[3], boxB[3])

	# compute the area of intersection rectangle
	interArea = (xB - xA + 1) * (yB - yA + 1)

	# compute the area of both the prediction and ground-truth
	# rectangles
	boxAArea = (boxA[2] - boxA[0] + 1) * (boxA[3] - boxA[1] + 1)
	boxBArea = (boxB[2] - boxB[0] + 1) * (boxB[3] - boxB[1] + 1)

	# compute the intersection over union by taking the intersection
	# area and dividing it by the sum of prediction + ground-truth
	# areas - the interesection area
	iou = interArea / float(boxAArea + boxBArea - interArea)

	# return the intersection over union value
	return iou
mAP
这里首先介绍几个常见的模型评价术语,现在假设我们的分类目标只有两类,计为正例(positive)和负例(negtive)分别是:
1、TP(True Positives)
即为真正例,我们需要计算IOU来决定一个检测结果是正确的还是错误的。一般来讲,如果IOU>0.5,我们则认为该检测结果为真正例。PASCAL VOC数据集所用的指标为0.5.
2、FP(False Positives)
即为假正例,同理,如果IOU<0.5,或者检测到同一个GT的多余检测框(意思是真实标签框检测出来有两个框或者多个框,置信度最高的那个作为了TP,那么剩下了为FP,即使这个检测框IOU大于0.5)。我们则认为该检测结果为假正例。
3、FN( False Negatives)
即为假反例,顾名思义,就是本来是真实框,可是没有检测出来。没有检测到的GT(真实框)的数量
4、TN( True negatives)
被正确地划分为负例的个数,即实际为负例且被分类器划分为负例的实例数。
5、precision(精准率或者查准率)
p r e c i s i o n = T P T P + F P = 预 测 样 本 中 实 际 正 样 本 数 所 有 的 正 样 本 数 precision = \frac{TP}{TP + FP} = \frac{预测样本中实际正样本数}{所有的正样本数} precision=TP+FPTP=所有的正样本数预测样本中实际正样本数
6、Recall(召回率或者查全率)
r e c a l l = T P T P + F N = 预 测 样 本 中 实 际 正 样 本 数 预 测 的 样 本 数 recall = \frac{TP}{TP + FN} = \frac{预测样本中实际正样本数}{预测的样本数} recall=TP+FNTP=预测的样本数预测样本中实际正样本数
一般来说,precision和recall是鱼与熊掌的关系,往往召回率越高,准确率越低
7、AP
AP 即 Average Precision即平均精确度。
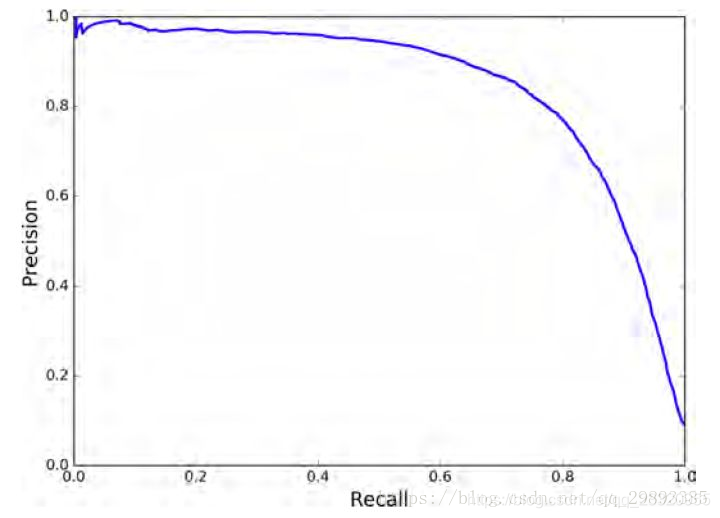
PR曲线的面积。P-R曲线即 以 precision 和 recall 作为 纵、横轴坐标 的二维曲线。
8、mAP
Mean Average Precision即平均AP值,是对多个验证集个体求平均AP值,作为 object dection中衡量检测精度的指标。
总结:总体趋势,精度越高,召回越低,当召回达到1时,对应概率分数最低的正样本,这个时候正样本数量除以所有大于等于该阈值的样本数量就是最低的精度值。在目标检测中,每一类都可以根据 recall 和 precision绘制P-R曲线,AP就是该曲线下的面积,mAP就是所有类AP的平均值。
推荐博客:
https://blog.csdn.net/shuiyixin/article/details/86349643
参考:
https://blog.csdn.net/qq_29893385/article/details/81213377
https://blog.csdn.net/fendoubasaonian/article/details/78981636
