%matplotlib notebook
import datetime
dt = datetime.datetime(year=2017,month=11,day=24,hour=10,minute=30)
dt
datetime.datetime(2017, 11, 24, 10, 30)
print (dt)
2017-11-24 10:30:00
# Timestamp
import pandas as pd
ts = pd.Timestamp('2017-11-24')
ts
Timestamp('2017-11-24 00:00:00')
ts.month
11
ts.day
24
# 时间计算
ts + pd.Timedelta('5 days')
Timestamp('2017-11-29 00:00:00')
#  转为时间格式1
pd.to_datetime('2017-11-24')
Timestamp('2017-11-24 00:00:00')
#  转为时间格式2
pd.to_datetime('24/11/2017')
Timestamp('2017-11-24 00:00:00')
s = pd.Series(['2017-11-24 00:00:00','2017-11-25 00:00:00','2017-11-26 00:00:00'])
s
0    2017-11-24 00:00:00
1    2017-11-25 00:00:00
2    2017-11-26 00:00:00
dtype: object
ts = pd.to_datetime(s)
ts
0   2017-11-24
1   2017-11-25
2   2017-11-26
dtype: datetime64[ns]
ts.dt.hour
0    0
1    0
2    0
dtype: int64
ts.dt.weekday
0    4
1    5
2    6
dtype: int64
pd.Series(pd.date_range(start='2020-10-01',periods = 10,freq = '12H'))
0   2020-10-01 00:00:00
1   2020-10-01 12:00:00
2   2020-10-02 00:00:00
3   2020-10-02 12:00:00
4   2020-10-03 00:00:00
5   2020-10-03 12:00:00
6   2020-10-04 00:00:00
7   2020-10-04 12:00:00
8   2020-10-05 00:00:00
9   2020-10-05 12:00:00
dtype: datetime64[ns]
data = pd.read_csv('./data/flowdata.csv')
data.head()
|
Time |
L06_347 |
LS06_347 |
LS06_348 |
| 0 |
2009-01-01 00:00:00 |
0.137417 |
0.097500 |
0.016833 |
| 1 |
2009-01-01 03:00:00 |
0.131250 |
0.088833 |
0.016417 |
| 2 |
2009-01-01 06:00:00 |
0.113500 |
0.091250 |
0.016750 |
| 3 |
2009-01-01 09:00:00 |
0.135750 |
0.091500 |
0.016250 |
| 4 |
2009-01-01 12:00:00 |
0.140917 |
0.096167 |
0.017000 |
data['Time'] = pd.to_datetime(data['Time'])
data = data.set_index('Time')
data
|
L06_347 |
LS06_347 |
LS06_348 |
| Time |
|
|
|
| 2009-01-01 00:00:00 |
0.137417 |
0.097500 |
0.016833 |
| 2013-01-02 00:00:00 |
0.860000 |
0.860000 |
0.075000 |
11697 rows × 3 columns
data.index
DatetimeIndex(['2009-01-01 00:00:00', '2009-01-01 03:00:00',
               '2009-01-01 06:00:00', '2009-01-01 09:00:00',
               '2009-01-01 12:00:00', '2009-01-01 15:00:00',
               '2009-01-01 18:00:00', '2009-01-01 21:00:00',
               '2009-01-02 00:00:00', '2009-01-02 03:00:00',
               ...
               '2012-12-31 21:00:00', '2013-01-01 00:00:00',
               '2013-01-01 03:00:00', '2013-01-01 06:00:00',
               '2013-01-01 09:00:00', '2013-01-01 12:00:00',
               '2013-01-01 15:00:00', '2013-01-01 18:00:00',
               '2013-01-01 21:00:00', '2013-01-02 00:00:00'],
              dtype='datetime64[ns]', name='Time', length=11697, freq=None)
# 读取文件,第一列设为索引,并转为时间格式
data = pd.read_csv('./data/flowdata.csv',index_col = 0,parse_dates = True)
data.head()
|
L06_347 |
LS06_347 |
LS06_348 |
| Time |
|
|
|
| 2009-01-01 00:00:00 |
0.137417 |
0.097500 |
0.016833 |
| 2009-01-01 03:00:00 |
0.131250 |
0.088833 |
0.016417 |
| 2009-01-01 06:00:00 |
0.113500 |
0.091250 |
0.016750 |
| 2009-01-01 09:00:00 |
0.135750 |
0.091500 |
0.016250 |
| 2009-01-01 12:00:00 |
0.140917 |
0.096167 |
0.017000 |
data[pd.Timestamp('2012-01-01 09:00'):pd.Timestamp('2012-01-01 19:00')]
|
L06_347 |
LS06_347 |
LS06_348 |
| Time |
|
|
|
| 2012-01-01 09:00:00 |
0.330750 |
0.293583 |
0.029750 |
| 2012-01-01 12:00:00 |
0.295000 |
0.285167 |
0.031750 |
| 2012-01-01 15:00:00 |
0.301417 |
0.287750 |
0.031417 |
| 2012-01-01 18:00:00 |
0.322083 |
0.304167 |
0.038083 |
data[('2012-01-01 09:00'):('2012-01-01 19:00')]
|
L06_347 |
LS06_347 |
LS06_348 |
| Time |
|
|
|
| 2012-01-01 09:00:00 |
0.330750 |
0.293583 |
0.029750 |
| 2012-01-01 12:00:00 |
0.295000 |
0.285167 |
0.031750 |
| 2012-01-01 15:00:00 |
0.301417 |
0.287750 |
0.031417 |
| 2012-01-01 18:00:00 |
0.322083 |
0.304167 |
0.038083 |
data.tail(10)
|
L06_347 |
LS06_347 |
LS06_348 |
| Time |
|
|
|
| 2012-12-31 21:00:00 |
0.846500 |
0.846500 |
0.170167 |
| 2013-01-01 00:00:00 |
1.688333 |
1.688333 |
0.207333 |
| 2013-01-01 03:00:00 |
2.693333 |
2.693333 |
0.201500 |
| 2013-01-01 06:00:00 |
2.220833 |
2.220833 |
0.166917 |
| 2013-01-01 09:00:00 |
2.055000 |
2.055000 |
0.175667 |
| 2013-01-01 12:00:00 |
1.710000 |
1.710000 |
0.129583 |
| 2013-01-01 15:00:00 |
1.420000 |
1.420000 |
0.096333 |
| 2013-01-01 18:00:00 |
1.178583 |
1.178583 |
0.083083 |
| 2013-01-01 21:00:00 |
0.898250 |
0.898250 |
0.077167 |
| 2013-01-02 00:00:00 |
0.860000 |
0.860000 |
0.075000 |
data['2013']
|
L06_347 |
LS06_347 |
LS06_348 |
| Time |
|
|
|
| 2013-01-01 00:00:00 |
1.688333 |
1.688333 |
0.207333 |
| 2013-01-01 03:00:00 |
2.693333 |
2.693333 |
0.201500 |
| 2013-01-01 06:00:00 |
2.220833 |
2.220833 |
0.166917 |
| 2013-01-01 09:00:00 |
2.055000 |
2.055000 |
0.175667 |
| 2013-01-01 12:00:00 |
1.710000 |
1.710000 |
0.129583 |
| 2013-01-01 15:00:00 |
1.420000 |
1.420000 |
0.096333 |
| 2013-01-01 18:00:00 |
1.178583 |
1.178583 |
0.083083 |
| 2013-01-01 21:00:00 |
0.898250 |
0.898250 |
0.077167 |
| 2013-01-02 00:00:00 |
0.860000 |
0.860000 |
0.075000 |
data['2012-01':'2012-03']
|
L06_347 |
LS06_347 |
LS06_348 |
| Time |
|
|
|
| 2012-01-01 00:00:00 |
0.307167 |
0.273917 |
0.028000 |
| 2012-01-01 18:00:00 |
0.322083 |
0.304167 |
0.038083 |
| 2012-01-01 21:00:00 |
0.355417 |
0.346500 |
0.080917 |
| 2012-01-02 00:00:00 |
1.069333 |
0.970000 |
0.071917 |
| 2012-01-02 03:00:00 |
0.886667 |
0.817417 |
0.070833 |
| 2012-01-02 06:00:00 |
1.231000 |
1.153083 |
0.150750 |
| 2012-01-02 09:00:00 |
1.647500 |
1.476667 |
0.076583 |
| 2012-01-02 12:00:00 |
1.111000 |
1.003833 |
0.062250 |
| 2012-01-02 15:00:00 |
0.738833 |
0.727083 |
0.052417 |
| 2012-01-02 18:00:00 |
0.641250 |
0.603417 |
0.047667 |
728 rows × 3 columns
data[data.index.month == 1]
>
|
L06_347 |
LS06_347 |
LS06_348 |
| Time |
|
|
|
| 2009-01-01 00:00:00 |
0.137417 |
0.097500 |
0.016833 |
| 2009-01-01 03:00:00 |
0.131250 |
0.088833 |
0.016417 |
| 2009-01-01 06:00:00 |
0.113500 |
0.091250 |
0.016750 |
| 2009-01-01 09:00:00 |
0.135750 |
0.091500 |
0.016250 |
| 2009-01-01 12:00:00 |
0.140917 |
0.096167 |
0.017000 |
| 2009-01-01 15:00:00 |
0.099167 |
0.091667 |
0.017583 |
| 2009-01-01 18:00:00 |
0.132667 |
0.090167 |
0.016250 |
| 2009-01-01 21:00:00 |
0.109417 |
0.091167 |
0.016000 |
| 2009-01-02 00:00:00 |
0.133833 |
0.090417 |
0.016083 |
| 2009-01-02 03:00:00 |
0.092083 |
0.088667 |
0.016000 |
| 2009-01-02 06:00:00 |
0.112917 |
0.091417 |
0.016333 |
| 2009-01-02 09:00:00 |
0.141917 |
0.097083 |
0.016417 |
| 2009-01-02 12:00:00 |
0.147833 |
0.101917 |
0.016417 |
| 2009-01-02 15:00:00 |
0.107917 |
0.100250 |
0.016417 |
1001 rows × 3 columns
data[(data.index.hour > 8) & (data.index.hour <12)]
1462 rows × 4 columns
data.between_time('08:00','12:00')
|
L06_347 |
LS06_347 |
LS06_348 |
month |
| Time |
|
|
|
|
| 2009-01-01 09:00:00 |
0.135750 |
0.091500 |
0.016250 |
1 |
| 2009-01-06 09:00:00 |
0.100083 |
0.065583 |
0.015500 |
1 |
| 2009-01-07 09:00:00 |
0.138500 |
0.093917 |
0.015000 |
1 |
| 2009-01-08 09:00:00 |
0.101333 |
0.066417 |
0.016833 |
1 |
| 2009-01-09 09:00:00 |
0.061750 |
0.059417 |
0.015167 |
1 |
|
L06_347 |
LS06_347 |
LS06_348 |
month |
| Time |
|
|
|
|
| 2009-01-01 09:00:00 |
0.135750 |
0.091500 |
0.016250 |
1 |
| 2009-01-01 12:00:00 |
0.140917 |
0.096167 |
0.017000 |
1 |
| 2009-01-02 09:00:00 |
0.141917 |
0.097083 |
0.016417 |
1 |
| 2009-01-02 12:00:00 |
0.147833 |
0.101917 |
0.016417 |
1 |
| 2009-01-03 09:00:00 |
0.124583 |
0.084417 |
0.015833 |
1 |
2924 rows × 4 columns
data.head()
|
L06_347 |
LS06_347 |
LS06_348 |
month |
| Time |
|
|
|
|
| 2009-01-01 00:00:00 |
0.137417 |
0.097500 |
0.016833 |
1 |
| 2009-01-01 03:00:00 |
0.131250 |
0.088833 |
0.016417 |
1 |
| 2009-01-01 06:00:00 |
0.113500 |
0.091250 |
0.016750 |
1 |
| 2009-01-01 09:00:00 |
0.135750 |
0.091500 |
0.016250 |
1 |
| 2009-01-01 12:00:00 |
0.140917 |
0.096167 |
0.017000 |
1 |
data.resample('D').mean().head()
|
L06_347 |
LS06_347 |
LS06_348 |
month |
| Time |
|
|
|
|
| 2009-01-01 |
0.125010 |
0.092281 |
0.016635 |
1 |
| 2009-01-02 |
0.124146 |
0.095781 |
0.016406 |
1 |
| 2009-01-03 |
0.113562 |
0.085542 |
0.016094 |
1 |
| 2009-01-04 |
0.140198 |
0.102708 |
0.017323 |
1 |
| 2009-01-05 |
0.128812 |
0.104490 |
0.018167 |
1 |
data.resample('D',how='mean').head()
C:\Anaconda3\lib\site-packages\ipykernel\__main__.py:1: FutureWarning: how in .resample() is deprecated
the new syntax is .resample(...).mean()
  if __name__ == '__main__':
|
L06_347 |
LS06_347 |
LS06_348 |
month |
| Time |
|
|
|
|
| 2009-01-01 |
0.125010 |
0.092281 |
0.016635 |
1 |
| 2009-01-02 |
0.124146 |
0.095781 |
0.016406 |
1 |
| 2009-01-03 |
0.113562 |
0.085542 |
0.016094 |
1 |
| 2009-01-04 |
0.140198 |
0.102708 |
0.017323 |
1 |
| 2009-01-05 |
0.128812 |
0.104490 |
0.018167 |
1 |
data.resample('D').max().head()
|
L06_347 |
LS06_347 |
LS06_348 |
month |
| Time |
|
|
|
|
| 2009-01-01 |
0.140917 |
0.097500 |
0.017583 |
1 |
| 2009-01-02 |
0.147833 |
0.101917 |
0.016833 |
1 |
| 2009-01-03 |
0.135833 |
0.092500 |
0.016833 |
1 |
| 2009-01-04 |
0.160417 |
0.113750 |
0.018417 |
1 |
| 2009-01-05 |
0.161500 |
0.115167 |
0.021583 |
1 |
data.resample('3D').mean().head()
|
L06_347 |
LS06_347 |
LS06_348 |
month |
| Time |
|
|
|
|
| 2009-01-01 |
0.120906 |
0.091201 |
0.016378 |
1.0 |
| 2009-01-04 |
0.121594 |
0.091708 |
0.016670 |
1.0 |
| 2009-01-07 |
0.097042 |
0.070740 |
0.014479 |
1.0 |
| 2009-01-10 |
0.115941 |
0.086340 |
0.014545 |
1.0 |
| 2009-01-13 |
0.346962 |
0.364549 |
0.034198 |
1.0 |
data.resample('M').mean().head()
|
L06_347 |
LS06_347 |
LS06_348 |
month |
| Time |
|
|
|
|
| 2009-01-31 |
0.517864 |
0.536660 |
0.045597 |
1 |
| 2009-02-28 |
0.516847 |
0.529987 |
0.047238 |
2 |
| 2009-03-31 |
0.373157 |
0.383172 |
0.037508 |
3 |
| 2009-04-30 |
0.163182 |
0.129354 |
0.021356 |
4 |
| 2009-05-31 |
0.178588 |
0.160616 |
0.020744 |
5 |
data.resample('M').mean().plot()
<IPython.core.display.Javascript object>
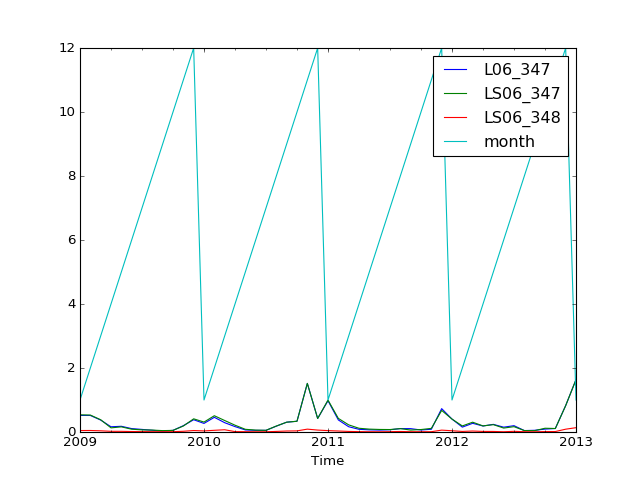
<matplotlib.axes._subplots.AxesSubplot at 0x232129ce080>