Metricbeat入门简介
一、什么是Metricbeat?
- 轻量型指标采集器
- 用于从系统和服务收集指标。Metricbeat能够以一种轻量型的方式,输送各种系统和服务统计数据,从CPU 到内存,从Redis到Nginx,不一而足。
- 定期收集操作系统或应用服务的指标数据
- 存储到Elasticsearch中,进行实时分析
二、Metricbeat组成
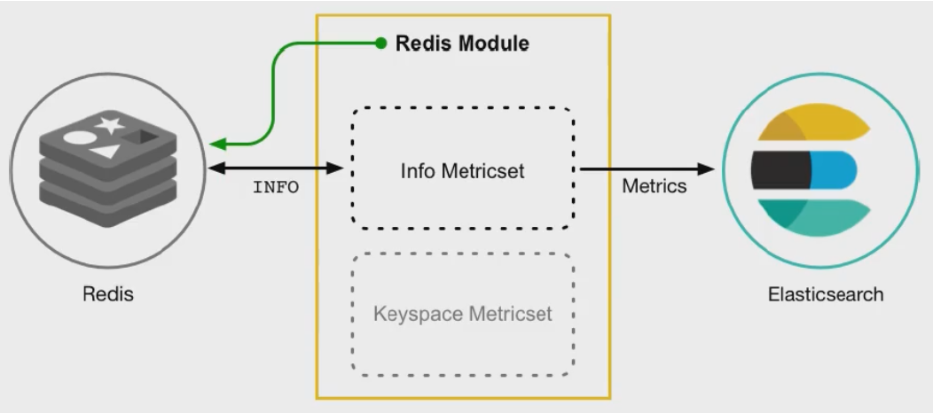
Metricbeat有2部分组成,一部分是Module,另一个部分为Metricset
- Module
- 收集的对象:如 MySQL、Redis、Nginx、操作系统等
- Metricset
- 收集指标的集合:如 cpu、memory,network等
以Redis Module为例:
redis安装:
参考:https://www.cnblogs.com/hsyw/p/13254117.html
三、部署Metricbeat与收集指标
3.1、下载
[root@node1 app]# wget https://artifacts.elastic.co/downloads/beats/metricbeat/metricbeat-6.5.4-linux-x86_64.tar.gz
3.2、安装
[root@node1 app]# tar -zxvf metricbeat-6.5.4-linux-x86_64.tar.gz
[root@node1 app]# mv metricbeat-6.5.4-linux-x86_64 metricbeat
3.3、更改配置文件
[root@node1 app]# cd metricbeat
[root@node1 metricbeat]# vim metricbeat.yml
# 第94行,改为ES集群的IP地址们
hosts: ["192.168.1.111","192.168.1.112","192.168.1.113"]ES集群的IP地址们

PS: 默认会指定的模块配置文件,在${path.config}/modules.d/*.yml   ---cd modules.d/
3.4、启动
[root@node1 metricbeat]# ./metricbeat -e
3.5、页面查看
可以看到多一个metricbeat-6.5.4-2020.12.06库
3.6、system module配置
- module: system
  period: 10s  # 采集的频率,每10秒采集一次
  metricsets:  # 采集的内容
    - cpu
    - load
    - memory
    - network
    - process
    - process_summary
四、Metricbeat Module
4.1、查看有那些Module
#查看列表
[root@node1 metricbeat]# ./metricbeat modules list
Enabled:  #默认开启的只有system
system

Disabled:
aerospike
apache
ceph
couchbase
docker
dropwizard
elasticsearch
envoyproxy
etcd
golang
graphite
haproxy
http
jolokia
kafka
kibana
kubernetes
kvm
logstash
memcached
mongodb
munin
mysql
nginx
php_fpm
postgresql
prometheus
rabbitmq
redis
traefik
uwsgi
vsphere
windows
zookeeper
4.2、开启Nginx Module
在nginx中,需要开启状态查询,才能查询到指标数据。
[root@node1 nginx-1.10.1]# ./configure --prefix=/usr/local/nginx --with-http_stub_status_module

[root@node1 nginx-1.10.1]# make && make install

# nginx 安装路径
[root@node1 nginx]# pwd
/usr/local/nginx

# 查看版本、模块信息
[root@node1 sbin]# ./nginx -V
nginx version: nginx/1.10.1
built by gcc 4.8.5 20150623 (Red Hat 4.8.5-39) (GCC)
configure arguments: --prefix=/usr/local/nginx --with-http_stub_status_module

#配置nginx、location可存在多个,找到location放在它上方即可(server模块里面)
[root@node1 nginx]# vim conf/nginx.conf
location /nginx-status {
    stub_status on;
    access_log off;
}

# 重启nginx
[root@node1 nginx]# sbin/nginx -s reload

# 页面访问
http://192.168.1.129/nginx-status

# 显示
Active connections: 2
server accepts handled requests
 5 5 16
Reading: 0 Writing: 1 Waiting: 1


# 显示结果说明:

- Active connections:正在处理的活动连接数
- server accepts handled requests
  - 第一个 server 表示Nginx启动到现在共处理了9个连接
  - 第二个 accepts 表示Nginx启动到现在共成功创建 9 次握手
  - 第三个 handled requests 表示总共处理了 21 次请求
  - 请求丢失数 = 握手数 - 连接数 ,可以看出目前为止没有丢失请求
- Reading: 0 Writing: 1 Waiting: 1
  - Reading:Nginx 读取到客户端的 Header 信息数
  - Writing:Nginx 返回给客户端 Header 信息数
  - Waiting:Nginx 已经处理完正在等候下一次请求指令的驻留链接(开启keep-alive的情况下,这个值等于
    Active - (Reading+Writing))
4.3、配置metricbeat的nginx module
#启用nginx module
[root@node1 metricbeat]# ./metricbeat modules enable nginx
Enabled nginx

#修改redis module配置
[root@node1 metricbeat]# vim modules.d/nginx.yml
- module: nginx
  #metricsets:
  #  - stubstatus
  period: 10s	# 10秒采集一次

  # Nginx hosts
  hosts: ["http://192.168.1.129"]     # nginx服务器IP地址

  # Path to server status. Default server-status
  server_status_path: "nginx-status"  # 刚刚配置的名称

  #username: "user"
  #password: "secret"
4.4、启动
[root@node1 metricbeat]# ./metricbeat -e
