【原创】Kernel调试追踪技术之 Ftrace on ARM64
【原创】Kernel调试追踪技术之 Ftrace on ARM64
本文目标:
- 理解Ftrace的一些关键实现方式,理解动态替换技术
- 理解Ftrace对性能的影响
1. Ftrace简介
Ftrace 是Kernel的官方tracing 框架。初始开发者和maintainer是Steven Rostedt,在2008年合入Kernel。
其全名是Function trace,但是功能不只有函数跟踪,还包含了静态trace event、动态trace event、stack trace、latency tracer等功能,是一个完善的trace 框架。同时提供统计、过滤、触发等功能,方便trace log的捕获和分析。
Ftrace使用per-cpu的trace buffer,buffer内容为二进制格式,执行效率高。设置CONFIG_DYNAMIC_FTRACE后,加入的trace功能在不使用时对系统性能几乎没有影响。
从下图可以看到ftrace和Linux上其它tracing系统的关系:
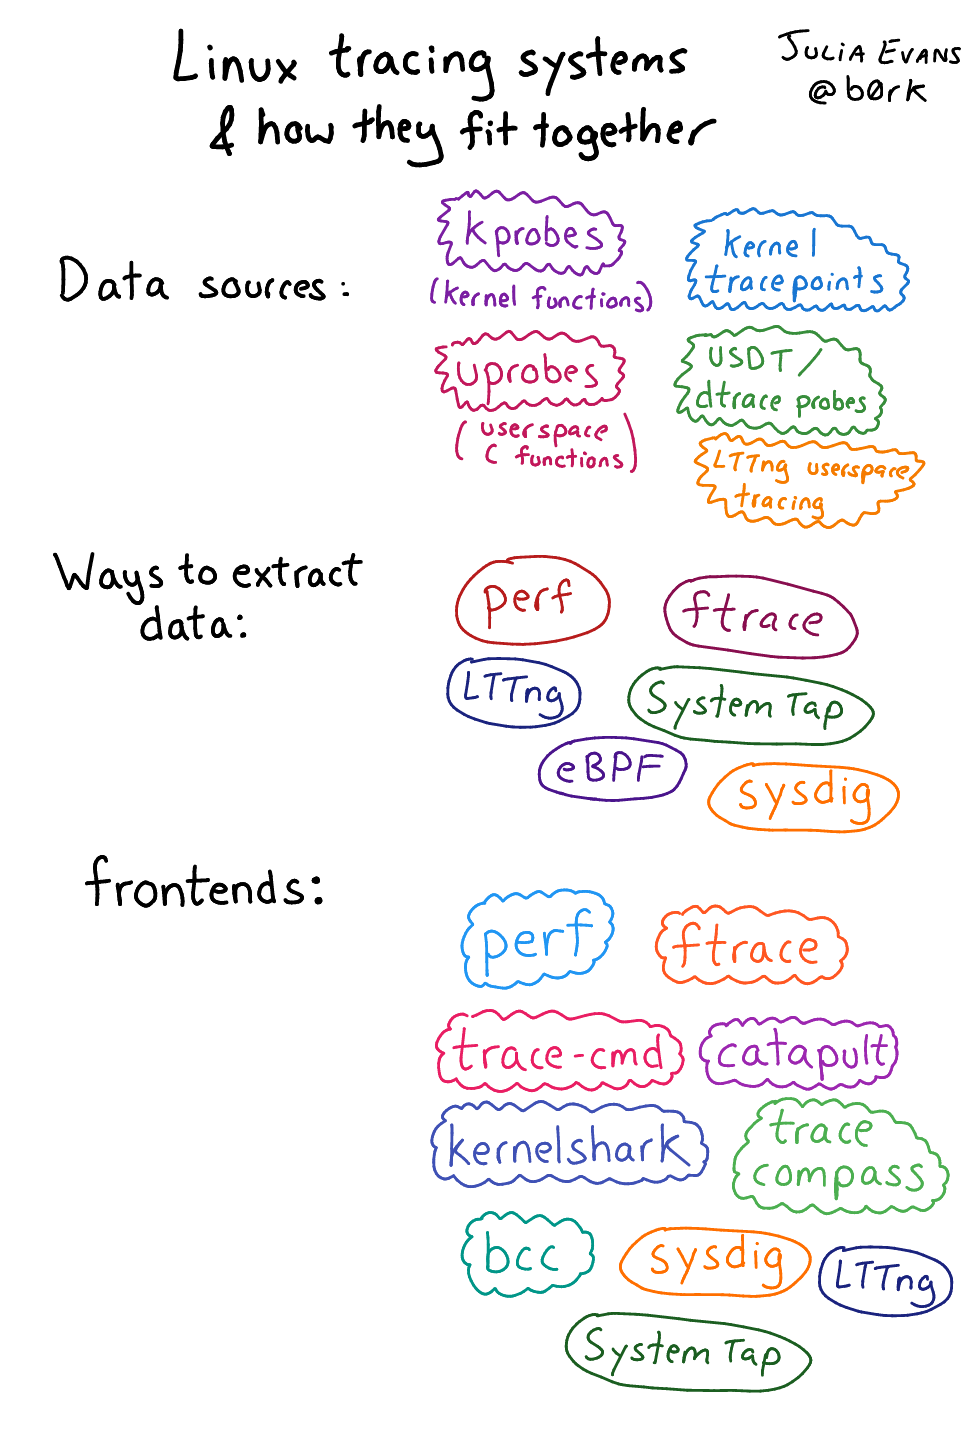
[From Julia Evans](From Julia Evans](https://jvns.ca/blog/2017/07/05/linux-tracing-systems/)
2. Ftrace的使用
Ftrace的使用可以分成三种类型:
- 应用层通过tracefs文件设置,应用程序通过trace_marker插入log
- kernel中自定义trace event
- kernel中使用ftrace的API,比如trace_printk,tracing_on/off()等。
还有一些前端工具,比如命令行工具trace-cmd, UI工具kernelShare等可以方便tracefs的配置和显示。
2.1 通过tracefs的使用
ftracefs的官方文档是 kernel/Documentation/trace/ftrace.txt,详细介绍了ftrace的主要功能,建议仔细阅读。
tracefs默认挂载在/sys/kernel/debug/tracing/目录下,第一层目录有50多个文件和目录,比较繁杂,Ftrace的配置和使用 中做了分类整理,并附有执行示例,建议逐个执行一遍,会有比较清晰的认识。
ftrace的 log主要有两种类型,一种是时间线的trace log,一种是记录最大latency log。
log显示格式类似,都会显示出执行程序名称、PID、CPU ID、 irq和抢占状态、时间戳、trace到的函数和父函数。
-
function tracer示例:
# tracer: function
#
# entries-in-buffer/entries-written: 140080/250280   #P:4
#
#                              _-----=> irqs-off
#                             / _----=> need-resched
#                            | / _---=> hardirq/softirq
#                            || / _--=> preempt-depth
#                            ||| /     delay
#           TASK-PID   CPU#  ||||    TIMESTAMP  FUNCTION
#              | |       |   ||||       |         |
            bash-1977  [000] .... 17284.993652: sys_close <-system_call_fastpath
            bash-1977  [000] .... 17284.993653: __close_fd <-sys_close
            bash-1977  [000] .... 17284.993653: _raw_spin_lock <-__close_fd
            sshd-1974  [003] .... 17284.993653: __srcu_read_unlock <-fsnotify
            bash-1977  [000] .... 17284.993654: add_preempt_count <-_raw_spin_lock
            bash-1977  [000] ...1 17284.993655: _raw_spin_unlock <-__close_fd
            bash-1977  [000] ...1 17284.993656: sub_preempt_count <-_raw_spin_unlock
            bash-1977  [000] .... 17284.993657: filp_close <-__close_fd
            bash-1977  [000] .... 17284.993657: dnotify_flush <-filp_close
            sshd-1974  [003] .... 17284.993658: sys_select <-system_call_fastpath
                             --------
latency log只记录最大latency的调用区段,比如irqsoff显示从irq off到on的一个最大延迟,会显示完整的调用栈。tracefs里的stack_trace会记录最大堆栈的调用栈。
-
irqoff latency 示例
# tracer: irqsoff
#
# irqsoff latency trace v1.1.5 on 3.8.0-test+
# -------------------------------------------------------------------
# latency: 259 us, #4/4, CPU#2 | (M:preempt VP:0, KP:0, SP:0 HP:0 #P:4)
#    -----------------
#    | task: ps-6143 (uid:0 nice:0 policy:0 rt_prio:0)
#    -----------------
#  => started at: __lock_task_sighand
#  => ended at:   _raw_spin_unlock_irqrestore
#
#
#                  _------=> CPU#
#                 / _-----=> irqs-off
#                | / _----=> need-resched
#                || / _---=> hardirq/softirq
#                ||| / _--=> preempt-depth
#                |||| /     delay
#  cmd     pid   ||||| time  |   caller
#     \   /      |||||  \    |   /
      ps-6143    2d...    0us!: trace_hardirqs_off <-__lock_task_sighand
      ps-6143    2d..1  259us+: trace_hardirqs_on <-_raw_spin_unlock_irqrestore
      ps-6143    2d..1  263us+: time_hardirqs_on <-_raw_spin_unlock_irqrestore
      ps-6143    2d..1  306us : <stack trace>
 => trace_hardirqs_on_caller
 => trace_hardirqs_on
 => _raw_spin_unlock_irqrestore
 => do_task_stat
 => proc_tgid_stat
 => proc_single_show
 => seq_read
 => vfs_read
 => sys_read
 => system_call_fastpath
2.2 通过TRACE_EVENT定义 trace event
内核或驱动模块可以定义自己的静态trace event。定义代码可以放在include/trace/events/或者驱动目录下。
在Kernel 4.14.74的典型运行时系统中,有1000+的trace event。
Trace Event是用include/linux/tracepoint.h 提供的宏接口来定义的。宏封装的是tracepoint的定义、注册和trace接口的定义。
Trace event定义好以后,在内核代码中调用。
-
include/linux/tracepoint.h中有说明注释:370 /* 371 * For use with the TRACE_EVENT macro: 372 * 373 * We define a tracepoint, its arguments, its printk format 374 * and its 'fast binary record' layout. 375 * 376 * Firstly, name your tracepoint via TRACE_EVENT(name : the 377 * 'subsystem_event' notation is fine. 378 * 379 * Think about this whole construct as the 380 * 'trace_sched_switch() function' from now on. 381 * 382 * 383 * TRACE_EVENT(sched_switch, 384 * 385 * * 386 * * A function has a regular function arguments 387 * * prototype, declare it via TP_PROTO(): 388 * * 389 * 390 * TP_PROTO(struct rq *rq, struct task_struct *prev, 391 * struct task_struct *next), 392 * 393 * * 394 * * Define the call signature of the 'function'. 395 * * (Design sidenote: we use this instead of a 396 * * TP_PROTO1/TP_PROTO2/TP_PROTO3 ugliness.) 397 * * 398 * 399 * TP_ARGS(rq, prev, next), 400 * 401 * * 402 * * Fast binary tracing: define the trace record via 403 * * TP_STRUCT__entry(). You can think about it like a 404 * * regular C structure local variable definition. 405 * * 406 * * This is how the trace record is structured and will 407 * * be saved into the ring buffer. These are the fields 408 * * that will be exposed to user-space in 409 * * /sys/kernel/debug/tracing/events/<*>/format. 410 * * 411 * * The declared 'local variable' is called '__entry' 412 * * 413 * * __field(pid_t, prev_prid) is equivalent to a standard declariton: 414 * * 415 * * pid_t prev_pid; 416 * * 417 * * __array(char, prev_comm, TASK_COMM_LEN) is equivalent to: 418 * * 419 * * char prev_comm[TASK_COMM_LEN]; 420 * * 421 * 422 * TP_STRUCT__entry( 423 * __array( char, prev_comm, TASK_COMM_LEN ) 424 * __field( pid_t, prev_pid ) 425 * __field( int, prev_prio ) 426 * __array( char, next_comm, TASK_COMM_LEN ) 427 * __field( pid_t, next_pid ) 428 * __field( int, next_prio ) 429 * ),
定义一个Trace Event使用了5个宏:
TRACE_EVENT定义一个tracepoint,它是最上层的宏,下面2-6作为它的参数TP_PROTO定义函数原型,指定每个参数的类型TP_ARGS列出所有参数,tracepoint的回调函数会用到TP_STRUCT__entry定义要存入ring buffer的数据格式TP_fast_assign对存入ring buffer的数据赋值,赋值来自前面的argsTP_printk定义打印成可读log的格式
TRACE_EVENT(ext4_allocate_inode,
     TP_PROTO(struct inode *inode, struct inode *dir, int mode),

     TP_ARGS(inode, dir, mode),

     TP_STRUCT__entry(
         __field(    dev_t,  dev         )
         __field(    ino_t,  ino         )
         __field(    ino_t,  dir         )
         __field(    __u16,  mode        )
     ),

     TP_fast_assign(
         __entry->dev    = inode->i_sb->s_dev;
         __entry->ino    = inode->i_ino;
         __entry->dir    = dir->i_ino;
         __entry->mode   = mode;
     ),

     TP_printk("dev %d,%d ino %lu dir %lu mode 0%o",
           MAJOR(__entry->dev), MINOR(__entry->dev),
           (unsigned long) __entry->ino,
           (unsigned long) __entry->dir, __entry->mode)
 );
TRACE_EVENT会定义一个名为trace_xxx的接口函数,比如
trace_ext4_allocate_inode(struct inode *inode, struct inode *dir, int mode),驱动模块调用这个接口就插入了一个tracepoint。
vi fs/ext4/ialloc.c
struct inode *__ext4_new_inode(handle_t *handle, struct inode *dir,
		...
		ext4_debug("allocating inode %lu\n", inode->i_ino);
		trace_ext4_allocate_inode(inode, dir, mode);  // 调用Trace event接口
		brelse(inode_bitmap_bh);
		return ret;
		...
}

或者
struct inode *__ext4_new_inode(handle_t *handle, struct inode *dir,
		...
		ext4_debug("allocating inode %lu\n", inode->i_ino);
		if (trace_ext4_allocate_inode_enabled()) {
				// -- do something about paraments here ----
				trace_ext4_allocate_inode(inode, dir, mode);  // 调用Trace event接口
		}
		brelse(inode_bitmap_bh);
		return ret;
		...
}
这个trace event在tracefs中的events/sysxxx/eventxxx/format 中可以看到具体格式
从format可以看到,前4个field是trace的通用信息,包括type、flags、prempt_count和pid
第5个开始是定义的数据域,dev、ino、dir、mode,然后是打印格式。
这里定义的数据域是在二进制的trace buffer中的格式,cat trace或者trace-cmd等工具会把这个trace buffer中的二进制格式解析并打印。
# cat /sys/kernel/debug/tracing/events/ext4/ext4_allocate_inode/format
name: ext4_allocate_inode
ID: 746
format:
        field:unsigned short common_type;       offset:0;       size:2; signed:0;
        field:unsigned char common_flags;       offset:2;       size:1; signed:0;
        field:unsigned char common_preempt_count;       offset:3;       size:1; signed:0;
        field:int common_pid;   offset:4;       size:4; signed:1;

        field:dev_t dev;        offset:8;       size:4; signed:0;
        field:ino_t ino;        offset:16;      size:8; signed:0;
        field:ino_t dir;        offset:24;      size:8; signed:0;
        field:__u16 mode;       offset:32;      size:2; signed:0;

print fmt: "dev %d,%d ino %lu dir %lu mode 0%o", ((unsigned int) ((REC->dev) >> 20)), ((unsigned int) ((REC->dev) & ((1U << 20) - 1))), (unsigned long) REC->ino, (unsigned long) REC->dir, REC->mode
-
实例:增加一个打印温度传感器抽样值的trace event
// drivers/hwmon/comp-ts_trace.h
#undef TRACE_SYSTEM
#define TRACE_SYSTEM trts   //定义subsys,对应events下的目录

#if !defined(comp_ts_TRACEE_H) || defined(TRACE_HEADER_MULTI_READ)
#define comp_ts_TRACEE_H

#include <linux/tracepoint.h>
TRACE_EVENT(ts_irq_samples,

        TP_PROTO(struct ts_device *ts),

        TP_ARGS(ts),

        TP_STRUCT__entry(
                __field(int, irq)
                __array(int, smpl, 4)
        ),

        TP_fast_assign(
                __entry->irq = ts->irq;
                __entry->smpl[0] = ts->cur_smpl[0];
                __entry->smpl[1] = ts->cur_smpl[1];
                __entry->smpl[2] = ts->cur_smpl[2];
                __entry->smpl[3] = ts->cur_smpl[3];
        ),

        TP_printk(
                "SMPL_TS[0]:%d, SMPL_TS[1]:%d, SMPL_TS[2]:%d, SMPL_TS[3]:%d",
                __entry->smpl[0], __entry->smpl[1], __entry->smpl[2], __entry->smpl[3])
);

TRACE_EVENT(ts_temp,

        TP_PROTO(struct ts_device *ts ),

        TP_ARGS(ts),

        TP_STRUCT__entry(
                __field(int, avg)
                __array(int, temp, 4)
        ),

        TP_fast_assign(
                __entry->avg = ts->cur_temp_avg;
                __entry->temp[0] = ts->cur_temp[0];
                __entry->temp[1] = ts->cur_temp[1];
                __entry->temp[2] = ts->cur_temp[2];
                __entry->temp[3] = ts->cur_temp[3];
        ),

        TP_printk(
                "temp_avg:%d, temp_TS[0]:%d, temp_TS[1]:%d, temp_TS[2]:%d, temp_TS[3]:%d",
                __entry->avg, __entry->temp[0], __entry->temp[1],
                __entry->temp[2], __entry->temp[3])
);

#endif

#undef TRACE_INCLUDE_PATH
#undef TRACE_INCLUDE_FILE
#define TRACE_INCLUDE_PATH ../../drivers/hwmon/    // 指定comp-ts_trace.h 头文件路径
#define TRACE_INCLUDE_FILE   comp-ts_trace
/* This part must be outside protection */
#include <trace/define_trace.h>
diff --git a/drivers/hwmon/comp-ts.c b/drivers/hwmon/comp-ts.c index fcac293b1..002e77f0f 100755 --- a/drivers/hwmon/comp-ts.c +++ b/drivers/hwmon/comp-ts.c @@ -71,6 +71,9 @@ struct ts_device { spinlock_t lock; }; +#define CREATE_TRACE_POINTS // 定义struct tracepoint +#include "comp-ts_trace.h" + static inline u32 ts_reg_rd(struct ts_device *dev, u32 reg) { return ioread32(dev->reg_base + reg); @@ -207,6 +210,9 @@ static int ts_temp_read(struct device *dev, enum hwmon_sensor_types type, pr_debug("avg:%ld, min:%ld, max:%ld, diff:%ld\n", ts_dev->cur_temp_avg, temp_min, temp_max, diff); + trace_ts_irq_samples(ts_dev); + trace_ts_temp(ts_dev); + spin_unlock_irqrestore(&ts_dev->lock, flags); return 0; @@ -269,6 +275,7 @@ static irqreturn_t ts_irq_handler(int irq, void *dev_id) int i = 0; ts_status = ts_reg_rd(ts_dev, IRQ_TS_STATUS_ADDR); + trace_ts_irq_samples(ts_dev); spin_lock(&ts_dev->lock); for (i = 0; i < ts_NUM; i++) { @@ -313,6 +320,7 @@ static irqreturn_t ts_irq_handler(int irq, void *dev_id) ts_reg_wr(ts_dev, IRQ_TS_MASK_ADDR, ts_MASK); ts_dev->updated = 1; } + trace_ts_irq_samples(ts_dev); return IRQ_HANDLED; }打开event后,得到如下log:
# echo 1>  /sys/kernel/debug/tracing/events/trts/enable
root:/sys/kernel/debug/tracing# cat trace
# tracer: nop
#
#                              _-----=> irqs-off
#                             / _----=> need-resched
#                            | / _---=> hardirq/softirq
#                            || / _--=> preempt-depth
#                            ||| /     delay
#           TASK-PID   CPU#  ||||    TIMESTAMP  FUNCTION
#              | |       |   ||||       |         |
          <idle>-0     [000] d.H1    35.151111: ts_irq_samples: SMPL_TS[0]:1866, SMPL_TS[1]:1876, SMPL_TS[2]:1871, SMPL_TS[3]:1881
          <idle>-0     [000] d.H1    35.151122: ts_irq_samples: SMPL_TS[0]:1867, SMPL_TS[1]:1877, SMPL_TS[2]:1872, SMPL_TS[3]:1881
          <idle>-0     [000] dnH1    35.175116: ts_irq_samples: SMPL_TS[0]:1867, SMPL_TS[1]:1877, SMPL_TS[2]:1872, SMPL_TS[3]:1881
          <idle>-0     [000] dnH1    35.175122: ts_irq_samples: SMPL_TS[0]:1866, SMPL_TS[1]:1874, SMPL_TS[2]:1871, SMPL_TS[3]:1883
2.3 可用的trace API
除了trace event的宏定义接口以外,include/linux/kernel.h 中还提供了一些trace打印和控制接口
int trace_printk(const char *fmt, ...)
void tracing_on(void);
void tracing_off(void);
int tracing_is_on(void);
void tracing_snapshot(void);
void tracing_snapshot_alloc(void);

extern void tracing_start(void);
extern void tracing_stop(void);
extern void ftrace_dump(enum ftrace_dump_mode oops_dump_mode);
extern void trace_dump_stack(int skip);
使用trace_printk()可以向trace buffer中插入log,相比printk,可以输出cpuid、pid、irq/preempts状态等更多信息,且因为是per-cpu的buffer,性能影响比printk低,适用于对性能敏感的代码中。
2.4 内核启动参数和sysctrl设置ftrace
启动时,也可以通过内核参数对ftrace进行配置。
https://01.org/linuxgraphics/gfx-docs/drm/admin-guide/kernel-parameters.html
trace_buf_size=nn[KMG]
trace_event=[event-list]
trace_options=[option-list]
tp_printk[FTRACE]   // 把trace log 打印到kernel log buffer
traceoff_on_warning
alloc_snapshot  [FTRACE]
ftrace=[tracer]
ftrace_dump_on_oops[=orig_cpu]  // panic 时dump ftrace 也很有用
ftrace_filter=[function-list]
ftrace_notrace=[function-list]
ftrace_graph_filter=[function-list]
ftrace_graph_notrace=[function-list]
ftrace_graph_max_depth=<uint>
kprobe_event=[probe-list]
rcupdate.rcu_cpu_stall_ftrace_dump= [KNL]
stacktrace      [FTRACE]
stacktrace_filter=[function-list]
/proc/sys/kernel 的sysctrl有几个ftrace相关的全局配置。
/proc/sys/kernel/ftrace_dump_on_oops   // oops打印ftrace log
/proc/sys/kernel/ftrace_enabled        // ftrace全局开关,默认是1,设0时tracefs中无法打开trace
/proc/sys/kernel/stack_tracer_enabled
/proc/sys/kernel/traceoff_on_warning
/proc/sys/kernel/tracepoint_printk     // 把trace log打印到printk log bfufer,用于早期启动debug
3. Ftrace的实现
Ftrace是多个tracing技术的结合,这里按照function trace、静态tracepoint、动态tracepoint和tracer来介绍主要的trace功能的实现。
3.1 Function Trace的实现
Ftrace是function trace的简称,但是function trace只是ftrace里面的一个功能,它可以作为function tracer工作,也可以和其它tracer一起工作,跟踪每个函数的调用关系。
function trace是基于gcc的-pg参数插入mcount函数实现的,这部分依赖于处理器架构,文档 Documentation/trace/ftrace-design.txt 中详细介绍了kernel中实现一个处理器架构支持mcount需要的接口。
mcount在不同处理器的gcc实现名字可能略有差异,可能是mcount,_mcount或者__mcount,可以通过下面命令查看,arm64中是_mcount本文统一使用mcount。
$ echo 'main(){}' | aarch64-linux-gnu-gcc -x c -S -o - - -pg | grep mcount
<stdin>:1:1: warning: return type defaults to ‘int’ [-Wimplicit-int]
        .global _mcount
        bl      _mcount
ARM64的实现主要有下面三个文件
arch/arm64/kernel/entry-ftrace.S   // mcount的核心实现
arch/arm64/kernel/ftrace.c         // CONFIG_DYNAMIC_FTRACE 的支持接口
arch/arm64/include/asm/ftrace.h    // 声明和定义arm64为ftrace核心模块提供的接口
mcount的主要任务是根据是否打开了ftrace,跳转到对应的注册函数中,做进步一处理。
3.1.1 静态mcount实现
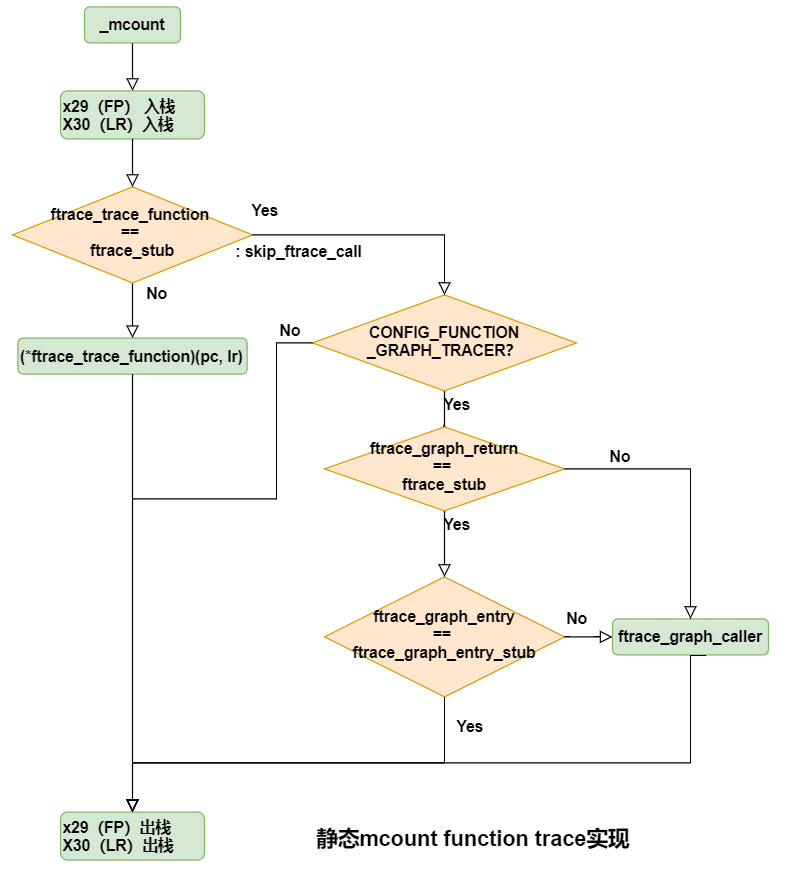
Kernel中打开CONFIG_FUNCTION_TRACER 后,会增加-pg编译选项,这样在每个函数入口处都会插入bl mcount跳转指令,函数运行时会进入mcount函数。mcount会判断函数指针ftrace_trace_function是否被注册,默认注册的是空函数ftrace_stub,只有打开function tracer后才会注册具体的处理函数ftrace_trace_function。
Makefile:
766 ifdef CONFIG_FUNCTION_TRACER
767 ifndef CC_FLAGS_FTRACE
768 CC_FLAGS_FTRACE := -pg
769 endif
770 export CC_FLAGS_FTRACE
(gdb) disassemble platform_get_irq
Dump of assembler code for function platform_get_irq:
   0xffffff8008579d68 <+0>:     stp     x29, x30, [sp, #-32]!
   0xffffff8008579d6c <+4>:     mov     x29, sp
   0xffffff8008579d70 <+8>:     stp     x19, x20, [sp, #16]
   0xffffff8008579d74 <+12>:    mov     x19, x0
   0xffffff8008579d78 <+16>:    mov     w20, w1
   0xffffff8008579d7c <+20>:    mov     x0, x30  // X30(LR)作为第一个参数,ARM64 kernel中实际不使用这个参数
   0xffffff8008579d80 <+24>:    bl      0xffffff8008093694 <_mcount>   <== 跳入_mcount
   0xffffff8008579d84 <+28>:    ldr     x0, [x19, #904]
   0xffffff8008579d88 <+32>:    cbz     x0, 0xffffff8008579da4 <platform_get_irq+60>
另外,如果配置了CONFIG_FUNCTION_GRAPH_TRACER,就不再是注册ftrace_trace_function,而是注册ftrace_graph_entry和ftrace_graph_return。function graph tracer是function trace的增强版,可以打印出完整的函数调用关系。
下图是静态ftrace中mount调用的function trace和function graph trace的实现流程, 代码在arch/arm64/kernel/entry-ftrace.S
3.1.2 Dynamic Ftrace
如果配置了CONFIG_DYNAMIC_FTRACE, mcount会被实现成一个空函数(只有一条ret 指令)。在系统启动时,mcount会被替换成nop指令。打开tracer后,所有函数的对应位置会被动态替换成跳转到ftrace_caller()的指令。
-
Dynamic Ftrace 代码
#else /* CONFIG_DYNAMIC_FTRACE */
/*
 * _mcount() is used to build the kernel with -pg option, but all the branch
 * instructions to _mcount() are replaced to NOP initially at kernel start up,
 * and later on, NOP to branch to ftrace_caller() when enabled or branch to
 * NOP when disabled per-function base.
 */
ENTRY(_mcount)
    ret
ENDPROC(_mcount)

/*
 * void ftrace_caller(unsigned long return_address)
 * @return_address: return address to instrumented function
 *
 * This function is a counterpart of _mcount() in 'static' ftrace, and
 * makes calls to:
 *     - tracer function to probe instrumented function's entry,
 *     - ftrace_graph_caller to set up an exit hook
 */
ENTRY(ftrace_caller)
    mcount_enter

    mcount_get_pc0  x0      //     function's pc
    mcount_get_lr   x1      //     function's lr

    .global ftrace_call
ftrace_call:                // tracer(pc, lr);
    nop             // This will be replaced with "bl xxx"
                    // where xxx can be any kind of tracer.

#ifdef CONFIG_FUNCTION_GRAPH_TRACER
    .global ftrace_graph_call
ftrace_graph_call:          // ftrace_graph_caller();
    nop             // If enabled, this will be replaced
                    // "b ftrace_graph_caller"
#endif

    mcount_exit
ENDPROC(ftrace_caller)
#endif /* CONFIG_DYNAMIC_FTRACE */
为了动态替换,需要在编译阶段就知道mcount在每个函数中的位置,这是通过scripts/recordmcount.pl 脚本在.o 编译后链接前记录的。所有的记录保存在kernel镜像或者xxx.ko的__mcount_loc section里,在ftrace_init()和ftrace_module_init()会为这些记录(record)分配record pages内存页存放,使用指针ftrace_pages_start 指向的record pages,运行时动态打开tracer时,会做替换。
void __init ftrace_init(void)
{
	ret = ftrace_process_locs(NULL,     //在这里替换
	              __start_mcount_loc,
	              __stop_mcount_loc);
}

#ifdef CONFIG_FTRACE_MCOUNT_RECORD
#define MCOUNT_REC()    . = ALIGN(8);               \
            VMLINUX_SYMBOL(__start_mcount_loc) = .; \
            *(__mcount_loc)             \
            VMLINUX_SYMBOL(__stop_mcount_loc) = .;
#else
#define MCOUNT_REC()
#endif
替换3万多个函数用时14ms左右
crash> sym __start_mcount_loc
ffffff8008ced458 (T) __start_mcount_loc
crash> sym __stop_mcount_loc
ffffff8008d28b88 (T) __stop_mcount_loc

[    0.000000]       .text : 0xffffff8008080000 - 0xffffff8008930000   (  8896 KB)
[    0.000000]     .rodata : 0xffffff8008930000 - 0xffffff8008c50000   (  3200 KB)
[    0.000000]       .init : 0xffffff8008c50000 - 0xffffff8008d50000   (  1024 KB)
[    0.000000]       .data : 0xffffff8008d50000 - 0xffffff8008eb2008   (  1417 KB)
[    0.000000]        .bss : 0xffffff8008eb2008 - 0xffffff8009a49e00   ( 11872 KB)

这个替换大概用了14ms
[3.281092 0.001971] [    0.000000] ---ftrace_init start---
[3.281930 0.000838] [    0.000000] ftrace: allocating 30444 entries in 119 pages
[3.295482 0.013552] [    0.000000] ---ftrace_init end---

在ftrace_replace_code中做计数,总共替换了31726个函数。
[  136.262494] --ftrace_replace_code---count:31726
通过tracefs或者sysctrl 打开ftrace功能时,会把record对应位置替换成调用ftrace_caller()
下面是设置/proc/sys/kernel/ftrace_enabled时的执行更新操作。
- ftrace_enable_sysctl
- update_ftrace_function
- 获取
ftrace_ops_list头部的ftrace_ops
- 获取
- ftrace_startup_sysctl
- ftrace_startup_enable
- ftrace_run_update_code(command);
- arch_ftrace_update_code(command);
- ftrace_modify_all_code(command);
-
ftrace_replace_code
do_for_each_ftrace_rec(pg, rec) { if (rec->flags & FTRACE_FL_DISABLED) continue; failed = __ftrace_replace_code(rec, enable); if (failed) { ftrace_bug(failed, rec); /* Stop processing */ return; } } while_for_each_ftrace_rec();- ftrace_make_call
- ftrace_modify_code
- ftrace_make_call
-
- ftrace_modify_all_code(command);
- arch_ftrace_update_code(command);
- ftrace_run_update_code(command);
- ftrace_startup_enable
- update_ftrace_function
3.2 静态Trace event的实现
3.2.1 Kernel的tracepoint 概念
静态trace event就是在kernel代码中插入trace 代码。
2.2 节讲的Trace event的定义和我们在/sys/kernel/debug/tracing/events里控制的trace event,是通过kernel 的tracepoint接口实现的,源码和文档是:
kernel/tracepoint.c     // tracepoint核心实现
include/linux/tracepoint.h  // tracepoint 宏接口头文件,
Documentation/trace/tracepoints.txt  // 介绍tracepoint的使用方法
kernel的tracepoint是一个通用接口,用来定义个trace 点。
除了ftrace以外, perf、LTTng、Systemtap等trace 框架也会使用。
struct tracepoint {
    const char *name;          /* Tracepoint name */
    struct static_key key;     /* 用来控制trace的enable 和disable */
    int (*regfunc)(void);      /* tracepoint 注册回调函数*/
    void (*unregfunc)(void);
    struct tracepoint_func __rcu *funcs;   /* tracepint 执行回调函数数组, 即可以有多个回调函数 */
};
struct tracepoint_func {
    void *func;
    void *data;
    int prio;
};
tracepoint的定义非常简单,主要是实现一个tracepoint对象的注册函数和回调函数。但是实际要适配各种类型回调函数的注册,又要考虑执行效率、接口易用性,实际提供的是类似于模板的宏定义接口, 在include/linux/tracepoint.h 中提供。
#define TRACE_EVENT(name, proto, args, struct, assign, print)  // 定义个tracepoint

#define DECLARE_EVENT_CLASS(name, proto, args, tstruct, assign, print) // 定义一个tracepoint类
#define DEFINE_EVENT(template, name, proto, args)   // 定义属于一个类的tracepoint

这些宏最终的调用的是__DECLARE_TRACE:
185 #define __DECLARE_TRACE(name, proto, args, cond, data_proto, data_args) \
186     extern struct tracepoint __tracepoint_##name;           \
187     static inline void trace_##name(proto)              \
188     {                               \
189         if (static_key_false(&__tracepoint_##name.key))     \
190             __DO_TRACE(&__tracepoint_##name,        \
191                 TP_PROTO(data_proto),           \
192                 TP_ARGS(data_args),         \
193                 TP_CONDITION(cond), 0);         \
194         if (IS_ENABLED(CONFIG_LOCKDEP) && (cond)) {     \
195             rcu_read_lock_sched_notrace();          \
196             rcu_dereference_sched(__tracepoint_##name.funcs);\
197             rcu_read_unlock_sched_notrace();        \
198         }                           \
199     }                               \
200     __DECLARE_TRACE_RCU(name, PARAMS(proto), PARAMS(args),      \
201         PARAMS(cond), PARAMS(data_proto), PARAMS(data_args))    \
202     static inline int                       \
203     register_trace_##name(void (*probe)(data_proto), void *data)    \     //生成多个函数
204     {                               \
205         return tracepoint_probe_register(&__tracepoint_##name,  \
206                         (void *)probe, data);   \
207     }                               \
208     static inline int                       \
209     register_trace_prio_##name(void (*probe)(data_proto), void *data,\
210                    int prio)                \
211     {                               \
212         return tracepoint_probe_register_prio(&__tracepoint_##name, \
213                           (void *)probe, data, prio); \
214     }                               \
215     static inline int                       \
216     unregister_trace_##name(void (*probe)(data_proto), void *data)  \
217     {                               \
218         return tracepoint_probe_unregister(&__tracepoint_##name,\
219                         (void *)probe, data);   \
220     }                               \
221     static inline void                      \
222     check_trace_callback_type_##name(void (*cb)(data_proto))    \
223     {                               \
224     }                               \
225     static inline bool                      \
226     trace_##name##_enabled(void)                    \
227     {                               \
228         return static_key_false(&__tracepoint_##name.key);  \
229     }
接口越易用,往往实现越复杂。
这些宏的定义比较复杂难懂,带有很多编译、链接相关信息,可读性很差。
可以在kernel编译过程中生成的预处理文件来看看生成的数据结构和trace函数实现是什么样的。
在Kernel/Makefile编译选项里加入-save-temps就会保存宏展开的预处理的.i 和汇编的.s 文件了,也可以在驱动模块里加入,减少文件量。
ifdef CONFIG_DEBUG_INFO_SPLIT
 KBUILD_CFLAGS   += $(call cc-option, -gsplit-dwarf, -g)
 else
-KBUILD_CFLAGS  += -g
+KBUILD_CFLAGS  += -g -save-temps
 endif
以sched_switch event为例
include/trace/events/sched.h
125 /*
126  * Tracepoint for task switches, performed by the scheduler:
127  */
128 TRACE_EVENT(sched_switch,
129
130     TP_PROTO(bool preempt,
131          struct task_struct *prev,
132          struct task_struct *next),
133
134     TP_ARGS(preempt, prev, next),
135
136     TP_STRUCT__entry(
137         __array(    char,   prev_comm,  TASK_COMM_LEN   )
138         __field(    pid_t,  prev_pid            )
139         __field(    int,    prev_prio           )
140         __field(    long,   prev_state          )
141         __array(    char,   next_comm,  TASK_COMM_LEN   )
142         __field(    pid_t,  next_pid            )
143         __field(    int,    next_prio           )
144     ),
145
146     TP_fast_assign(
147         memcpy(__entry->next_comm, next->comm, TASK_COMM_LEN);
148         __entry->prev_pid   = prev->pid;
149         __entry->prev_prio  = prev->prio;
150         __entry->prev_state = __trace_sched_switch_state(preempt, prev);
151         memcpy(__entry->prev_comm, prev->comm, TASK_COMM_LEN);
152         __entry->next_pid   = next->pid;
153         __entry->next_prio  = next->prio;
154         /* XXX SCHED_DEADLINE */
155     ),
156
157     TP_printk("prev_comm=%s prev_pid=%d prev_prio=%d prev_state=%s%s ==> next_comm=%s next_pid=%d next_prio=%d",
158         __entry->prev_comm, __entry->prev_pid, __entry->prev_prio,
159
160         (__entry->prev_state & (TASK_REPORT_MAX - 1)) ?
161           __print_flags(__entry->prev_state & (TASK_REPORT_MAX - 1), "|",
162                 { 0x01, "S" }, { 0x02, "D" }, { 0x04, "T" },
163                 { 0x08, "t" }, { 0x10, "X" }, { 0x20, "Z" },
164                 { 0x40, "P" }, { 0x80, "I" }) :
165           "R",
166
167         __entry->prev_state & TASK_REPORT_MAX ? "+" : "",
168         __entry->next_comm, __entry->next_pid, __entry->next_prio)
169 );
下面是sched_switch event的展开内容,非常不易读
extern struct tracepoint __tracepoint_sched_switch;
static inline __attribute__((always_inline, unused)) __attribute__((no_instrument_function)) void trace_sched_switch(struct task_struct *t) { if (static_key_false(&__tracepoint_sched_switch.key)) do { struct tracepoint_func *it_func_ptr; void *it_func; void *__data; if (!(cpumask_test_cpu(((*({ do { const void *__vpp_verify = (typeof((&cpu_number) + 0))((void *)0); (void)__vpp_verify; } while (0); ({ unsigned long __ptr; __asm__ ("" : "=r"(__ptr) : "0"((typeof(*(&cpu_number)) *)(&cpu_number))); (typeof((typeof(*(&cpu_number)) *)(&cpu_number))) (__ptr + ((__my_cpu_offset()))); }); }))), ((const struct cpumask *)&__cpu_online_mask)))) return; if (0) { if (({ int __ret_warn_on = !!(rcu_irq_enter_disabled()); if (__builtin_expect(!!(__ret_warn_on), 0)) asm volatile (".pushsection __bug_table,\"aw\"; .align 2; 0: .long 1f - 0b; .pushsection .rodata.str,\"aMS\",@progbits,1; 2: .string \"./include/trace/events/sched.h\"; .popsection; .long 2b - 0b; .short 32; .short (1 << 0)|((1 << 1)|((9) << 8)); .popsection; 1: brk 0x800");; __builtin_expect(!!(__ret_warn_on), 0); })) return; rcu_irq_enter_irqson(); } rcu_read_lock_sched_notrace(); it_func_ptr = ({ typeof(*((&__tracepoint_sched_switch)->funcs)) *________p1 = (typeof(*((&__tracepoint_sched_switch)->funcs)) *)({ union { typeof(((&__tracepoint_sched_switch)->funcs)) __val; char __c[1]; } __u; if (1) __read_once_size(&(((&__tracepoint_sched_switch)->funcs)), __u.__c, sizeof(((&__tracepoint_sched_switch)->funcs))); else __read_once_size_nocheck(&(((&__tracepoint_sched_switch)->funcs)), __u.__c, sizeof(((&__tracepoint_sched_switch)->funcs))); do { } while (0); __u.__val; }); do { } while (0); ; ((typeof(*((&__tracepoint_sched_switch)->funcs)) *)(________p1)); }); if (it_func_ptr) { do { it_func = (it_func_ptr)->func; __data = (it_func_ptr)->data; ((void(*)(void *__data, struct task_struct *t))(it_func))(__data, t); } while ((++it_func_ptr)->func); } rcu_read_unlock_sched_notrace(); if (0) rcu_irq_exit_irqson(); } while (0); if (1 && (cpumask_test_cpu(((*({ do { const void *__vpp_verify = (typeof((&cpu_number) + 0))((void *)0); (void)__vpp_verify; } while (0); ({ unsigned long __ptr; __asm__ ("" : "=r"(__ptr) : "0"((typeof(*(&cpu_number)) *)(&cpu_number))); (typeof((typeof(*(&cpu_number)) *)(&cpu_number))) (__ptr + ((__my_cpu_offset()))); }); }))), ((const struct cpumask *)&__cpu_online_mask)))) { rcu_read_lock_sched_notrace(); ({ typeof(*(__tracepoint_sched_switch.funcs)) *________p1 = (typeof(*(__tracepoint_sched_switch.funcs)) *)({ union { typeof((__tracepoint_sched_switch.funcs)) __val; char __c[1]; } __u; if (1) __read_once_size(&((__tracepoint_sched_switch.funcs)), __u.__c, sizeof((__tracepoint_sched_switch.funcs))); else __read_once_size_nocheck(&((__tracepoint_sched_switch.funcs)), __u.__c, sizeof((__tracepoint_sched_switch.funcs))); do { } while (0); __u.__val; }); do { } while (0); ; ((typeof(*(__tracepoint_sched_switch.funcs)) *)(________p1)); }); rcu_read_unlock_sched_notrace(); } }
static inline __attribute__((always_inline, unused)) __attribute__((no_instrument_function)) void trace_sched_switch_rcuidle(struct task_struct *t) { if (static_key_false(&__tracepoint_sched_switch.key)) do { struct tracepoint_func *it_func_ptr; void *it_func; void *__data; if (!(cpumask_test_cpu(((*({ do { const void *__vpp_verify = (typeof((&cpu_number) + 0))((void *)0); (void)__vpp_verify; } while (0); ({ unsigned long __ptr; __asm__ ("" : "=r"(__ptr) : "0"((typeof(*(&cpu_number)) *)(&cpu_number))); (typeof((typeof(*(&cpu_number)) *)(&cpu_number))) (__ptr + ((__my_cpu_offset()))); }); }))), ((const struct cpumask *)&__cpu_online_mask)))) return; if (1) { if (({ int __ret_warn_on = !!(rcu_irq_enter_disabled()); if (__builtin_expect(!!(__ret_warn_on), 0)) asm volatile (".pushsection __bug_table,\"aw\"; .align 2; 0: .long 1f - 0b; .pushsection .rodata.str,\"aMS\",@progbits,1; 2: .string \"./include/trace/events/sched.h\"; .popsection; .long 2b - 0b; .short 32; .short (1 << 0)|((1 << 1)|((9) << 8)); .popsection; 1: brk 0x800");; __builtin_expect(!!(__ret_warn_on), 0); })) return; rcu_irq_enter_irqson(); } rcu_read_lock_sched_notrace(); it_func_ptr = ({ typeof(*((&__tracepoint_sched_switch)->funcs)) *________p1 = (typeof(*((&__tracepoint_sched_switch)->funcs)) *)({ union { typeof(((&__tracepoint_sched_switch)->funcs)) __val; char __c[1]; } __u; if (1) __read_once_size(&(((&__tracepoint_sched_switch)->funcs)), __u.__c, sizeof(((&__tracepoint_sched_switch)->funcs))); else __read_once_size_nocheck(&(((&__tracepoint_sched_switch)->funcs)), __u.__c, sizeof(((&__tracepoint_sched_switch)->funcs))); do { } while (0); __u.__val; }); do { } while (0); ; ((typeof(*((&__tracepoint_sched_switch)->funcs)) *)(________p1)); }); if (it_func_ptr) { do { it_func = (it_func_ptr)->func; __data = (it_func_ptr)->data; ((void(*)(void *__data, struct task_struct *t))(it_func))(__data, t); } while ((++it_func_ptr)->func); } rcu_read_unlock_sched_notrace(); if (1) rcu_irq_exit_irqson(); } while (0); }
static inline __attribute__((always_inline, unused)) __attribute__((no_instrument_function)) int register_trace_sched_switch(void (*probe)(void *__data, struct task_struct *t), void *data) { return tracepoint_probe_register(&__tracepoint_sched_switch, (void *)probe, data); }
static inline __attribute__((always_inline, unused)) __attribute__((no_instrument_function)) int register_trace_prio_sched_switch(void (*probe)(void *__data, struct task_struct *t), void *data, int prio) { return tracepoint_probe_register_prio(&__tracepoint_sched_switch, (void *)probe, data, prio); }
static inline __attribute__((always_inline, unused)) __attribute__((no_instrument_function)) int unregister_trace_sched_switch(void (*probe)(void *__data, struct task_struct *t), void *data) { return tracepoint_probe_unregister(&__tracepoint_sched_switch, (void *)probe, data); }
static inline __attribute__((always_inline, unused)) __attribute__((no_instrument_function)) void check_trace_callback_type_sched_switch(void (*cb)(void *__data, struct task_struct *t)) { }
static inline __attribute__((always_inline, unused)) __attribute__((no_instrument_function)) bool trace_sched_switch_enabled(void) { return static_key_false(&__tracepoint_sched_switch.key); }
把trace_sched_switch()函数格式化一下,删掉部分,可以看到,流程是先通过key判断这个tracepoint是否打开了,如果打开,先检查当前cpu online的情况,再调用注册函数和trace函数原型。
static inline 	__attribute__((always_inline, unused))
				__attribute__((no_instrument_function))
void trace_sched_switch(struct task_struct *t)
{
	if (static_key_false(&__tracepoint_sched_switch.key))   // 检查是否enabled
		do {
			struct tracepoint_func *it_func_ptr;
			void *it_func; void *__data;
			if (!(cpumask_test_cpu(((*(     // 检查是否trace 当前CPU
				{.....}))), ((const struct cpumask *)&__cpu_online_mask))))
				return;
			rcu_read_lock_sched_notrace();
			it_func_ptr = ({ ... *________p1 = (typeof(*((&__tracepoint_sched_switch)->funcs)) *)...}); // 获得函数指针
			if (it_func_ptr) {
				do {
					it_func = (it_func_ptr)->func;
					__data = (it_func_ptr)->data;
					((void(*)(void *__data, struct task_struct *t))(it_func))(__data, t);   // 调用probe handler
				} while ((++it_func_ptr)->func);
			} rcu_read_unlock_sched_notrace();
		} while (0);
		...
}
3.2.2 EVENT CLASS优化代码空间占用
一个系统里可能有几千个tracepoint,每个都要定义一个tracepoint全局变量和一组函数,会导致代码段和数据段明显增加。
而经常同一个模块的多个tracepoint可能是有同样的参数、记录同样的数据结构,只是打印时机或者格式不同,利用这样的共性,可以进行分类,定义同样的注册函数和回调函数。
所以增加了两个宏:
DECLARE_EVENT_CLASS : 定义一个模板类
DEFINE_EVENT: 使用模板类定义一个EVENT
#define DECLARE_EVENT_CLASS(name, proto, args, tstruct, assign, print)
#define DEFINE_EVENT(template, name, proto, args)       \
        DECLARE_TRACE(name, PARAMS(proto), PARAMS(args))

201 DECLARE_EVENT_CLASS(sched_process_template,
202
203     TP_PROTO(struct task_struct *p),
204
205     TP_ARGS(p),
206
207     TP_STRUCT__entry(
208         __array(    char,   comm,   TASK_COMM_LEN   )
209         __field(    pid_t,  pid         )
210         __field(    int,    prio            )
211     ),
212
213     TP_fast_assign(
214         memcpy(__entry->comm, p->comm, TASK_COMM_LEN);
215         __entry->pid        = p->pid;
216         __entry->prio       = p->prio; /* XXX SCHED_DEADLINE */
217     ),
218
219     TP_printk("comm=%s pid=%d prio=%d",
220           __entry->comm, __entry->pid, __entry->prio)
221 );
222
223 /*
224  * Tracepoint for freeing a task:
225  */
226 DEFINE_EVENT(sched_process_template, sched_process_free,
227          TP_PROTO(struct task_struct *p),
228          TP_ARGS(p));
229
230
231 /*
232  * Tracepoint for a task exiting:
233  */
234 DEFINE_EVENT(sched_process_template, sched_process_exit,
235          TP_PROTO(struct task_struct *p),
236          TP_ARGS(p));
237
238 /*
239  * Tracepoint for waiting on task to unschedule:
240  */
241 DEFINE_EVENT(sched_process_template, sched_wait_task,
242     TP_PROTO(struct task_struct *p),
243     TP_ARGS(p));
下面是一个使用了TRACE_EVENT和DECLARE_EVENT_CLASS 对比的数据,可以看到代码段明显减少。
				text          data     bss     dec     hex filename
      452114          2788    3520  458422   6feb6 fs/xfs/xfs.o.notrace
      996954         38116    4480 1039550   fdcbe fs/xfs/xfs.o.trace
      638482         38116    3744  680342   a6196 fs/xfs/xfs.o.class
3.2.3 如何降低性能影响?
在代码中插入tracepoint,肯定希望在不打开时,对源码性能影响最小,这里使用了动态分支(dynamic branching)技术。
struct tracepoint中的struct static_key key就是用于dynamic branching的。
kernel的dynamic_debug接口(pr_debug,dev_dbg)也是基于这个技术实现log的动态开关。
statck-keys技术详情请参考下面文档和代码。
Documentation/static-keys.txt
include/linux/jump_label.h
arch/arm64/include/asm/jump_label.h
 89 #ifdef HAVE_JUMP_LABEL      //依赖于HAVA_JUMP_LABEL宏
 90
 91 struct static_key {
 92     atomic_t enabled;
 93 /*
 94  * Note:
 95  *   To make anonymous unions work with old compilers, the static
 96  *   initialization of them requires brackets. This creates a dependency
 97  *   on the order of the struct with the initializers. If any fields
 98  *   are added, STATIC_KEY_INIT_TRUE and STATIC_KEY_INIT_FALSE may need
 99  *   to be modified.
100  *
101  * bit 0 => 1 if key is initially true
102  *      0 if initially false
103  * bit 1 => 1 if points to struct static_key_mod
104  *      0 if points to struct jump_entry
105  */
106     union {
107         unsigned long type;
108         struct jump_entry *entries;
109         struct static_key_mod *next;
110     };
111 };
112
113 #else
114 struct static_key {
115     atomic_t enabled;
116 };
常见的控制代码的执行的方法是if (enabled) 或者if unlikely(enabled)做判断;
单独的if 没有分支优化,会引入较多的branch-miss;
后一种unlikely()在enabled被设置后,也会有同样的问题。
检查的enabled往往也是全局变量,在频繁执行的代码中,也可能引入cache 同步问题,比如这变量和其它变量共享同一个cacheline时。
最好的办法就是不判断,通过动态替换指令的方式,根据enabled值先把指令替换好,消除运行时的if 判断。具体实现原理见static-keys.txt。这个功能需要gcc v4.5以上的“asm goto”的支持,同时需要体系结构提供硬件相关实现,arm64已经提供支持,代码在arch/arm64/include/asm/jump_label.h。
static-key提供的接口在include/linux/jump_label.h中
DEFINE_STATIC_KEY_TRUE(key);       // 定义一个默认是True的key
DEFINE_STATIC_KEY_FALSE(key);      // 定义一个默认是False的key
DEFINE_STATIC_KEY_ARRAY_TRUE(keys, count);  // 定义一组
DEFINE_STATIC_KEY_ARRAY_FALSE(keys, count);
static_branch_likely()             // 分支判断
static_branch_unlikely()
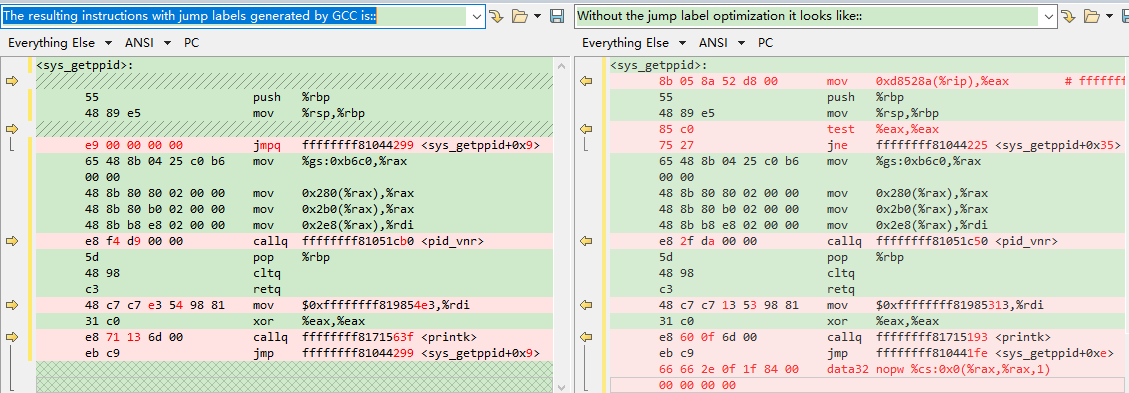
SYSCALL_DEFINE0(getppid)
{
      int pid;

+     if (static_branch_unlikely(&key))
+             printk("I am the true branch\n");

      rcu_read_lock();
      pid = task_tgid_vnr(rcu_dereference(current->real_parent));
      rcu_read_unlock();

      return pid;
}
从一个X86的例子可以看到,使用static key接口的代码,经过jump label优化以后,去掉了分支判断操作。如果条件为false,会直接替换成nop指令。
3.2.4 为什么使用宏定义
tracepoint里的宏定义非常难阅读和维护,为什么作者要使用宏定义开发呢?
个人认为主要有下面这些原因:
- 接口统一,使用简单
- 自动化定义接口函数、格式化数据,用户无需关心内部实现
- 模板化通用类型支持
- 性能优化,精心设计宏定义内部实现,
- 格式统一,方便设计trace解析工具
3.3 动态Trace event的实现
静态trace event需要在kernel 代码中插入trace point代码,而动态trace event是在运行时插入的。
对应tracefs里的文件是:
/sys/kernel/debug/tracing/kprobe_profile
/sys/kernel/debug/tracing/kprobe_events
/sys/kernel/debug/tracing/uprobe_profile
/sys/kernel/debug/tracing/uprobe_events
从名字可以看到是基于kprobe和uprobe机制实现的。ftrace 的dynamic trace event是通过解析写入kprobe_events的命令行字符串,注册对应函数的kprobe或者kretprobe 的 handler,handler的工作就是把需要打印的内容写入trace buffer。
Kernel 调试追踪技术之Kprobe 介绍了kprobe的机制和使用方式。
uprobe的实现和kprobe类似。
3.4 Tracer的实现
除了上面的静态 trace event和动态 trace event以外,ftrace 还定义了一些tracer。
这些tracer是用于某个特定功能的跟踪器,可能利用trace event,function trace的功能,也可以定义一些记录时间戳的接口用于记录最大latency。
目前主要的tracer如下:
nop             // 默认的空tracer,使用trace event、 dynamic trace event时设置为nop
function        // function tracer,打印所有函数调用,或者通过set_ftrace_filter过滤
function_graph  // 通过fucntion tracer,可以打印带缩进的调用关系

wakeup          // 记录最高优先级的进程的被唤醒后的最大调度延迟
wakeup_dl       // 记录SCHED_DEADLINE进程被唤醒后的最大调度延迟
wakeup_rt       // 记录RT 进程的被唤醒后的最大调度延迟

preemptirqsoff  // 记录irq和/或抢占被关闭的最大时间的backtrace
preemptoff      // 记录抢占被关闭的最大时间的backtrace
irqsoff         // 记录中断被关闭的最大时间的backtrac

blk   // block 事件tracer,需要在/sys/blk/xxx/trace/enable 中打开,和events/block/ 功能基本一样
这里以irqsoff tracer代码为例做简单介绍。
preemptirqsoff、preemptoff、irqsoff这三个tracer 都定义在kernel/trace/trace_irqsoff.c里。
定义一个tracer,首先要注册一个struct tracer,这个tracer主要是用在做tracer状态控制的。
static struct tracer irqsoff_tracer __read_mostly =
{
    .name       = "irqsoff",
    .init       = irqsoff_tracer_init,  // 初始化状态,注册function trace call
    .reset      = irqsoff_tracer_reset, // 重置为初始化状态,关闭function trace
    .start      = irqsoff_tracer_start, // tracer_enabled = 1;
    .stop       = irqsoff_tracer_stop,  // tracer_enabled = 0;
    .print_max  = true,
    .print_header   = irqsoff_print_header,  // 打印log 头
    .print_line     = irqsoff_print_line,    // 空
    .flag_changed   = irqsoff_flag_changed,  // 空
#ifdef CONFIG_FTRACE_SELFTEST
    .selftest    = trace_selftest_startup_irqsoff,
#endif
    .open           = irqsoff_trace_open,   // 空
    .close          = irqsoff_trace_close,  // 空
    .allow_instances = true,
    .use_max_tr = true,
};
另外根据CONFIG_FUNCTION_TRACER和CONFIG_FUNCTION_GRAPH_TRACER是否配置,注册对应的函数trace 接口(跟踪每个函数)。
其实irqsoff tracer主要是定义了两个时间记录接口,在kernel关闭中断和打开中断的位置调用,计算关闭时长,如果是最大,就把latency、backtrace等信息打印到trace buffer里。
EXPORT_SYMBOL(trace_hardirqs_on);
EXPORT_SYMBOL(trace_hardirqs_off);
EXPORT_SYMBOL(trace_hardirqs_on_caller);
EXPORT_SYMBOL(trace_hardirqs_off_caller);
EXPORT_SYMBOL_GPL(start_critical_timings);
EXPORT_SYMBOL_GPL(stop_critical_timings);
irqsoff输出的log根据是否打开function trace和function graph trace会不同,可以通过trace_options里的function-trace 和display_graph选项来控制。
- 如果设置了nofunction-trace,irqsoff 的trace log显示的调用栈
- 如果设置了function-trace, nodisplay_graph,打印整个irqoff阶段的所有函数
- 如果设置了function-trace, display_graph,打印整个irqoff阶段的所有函数的结构化调用关系
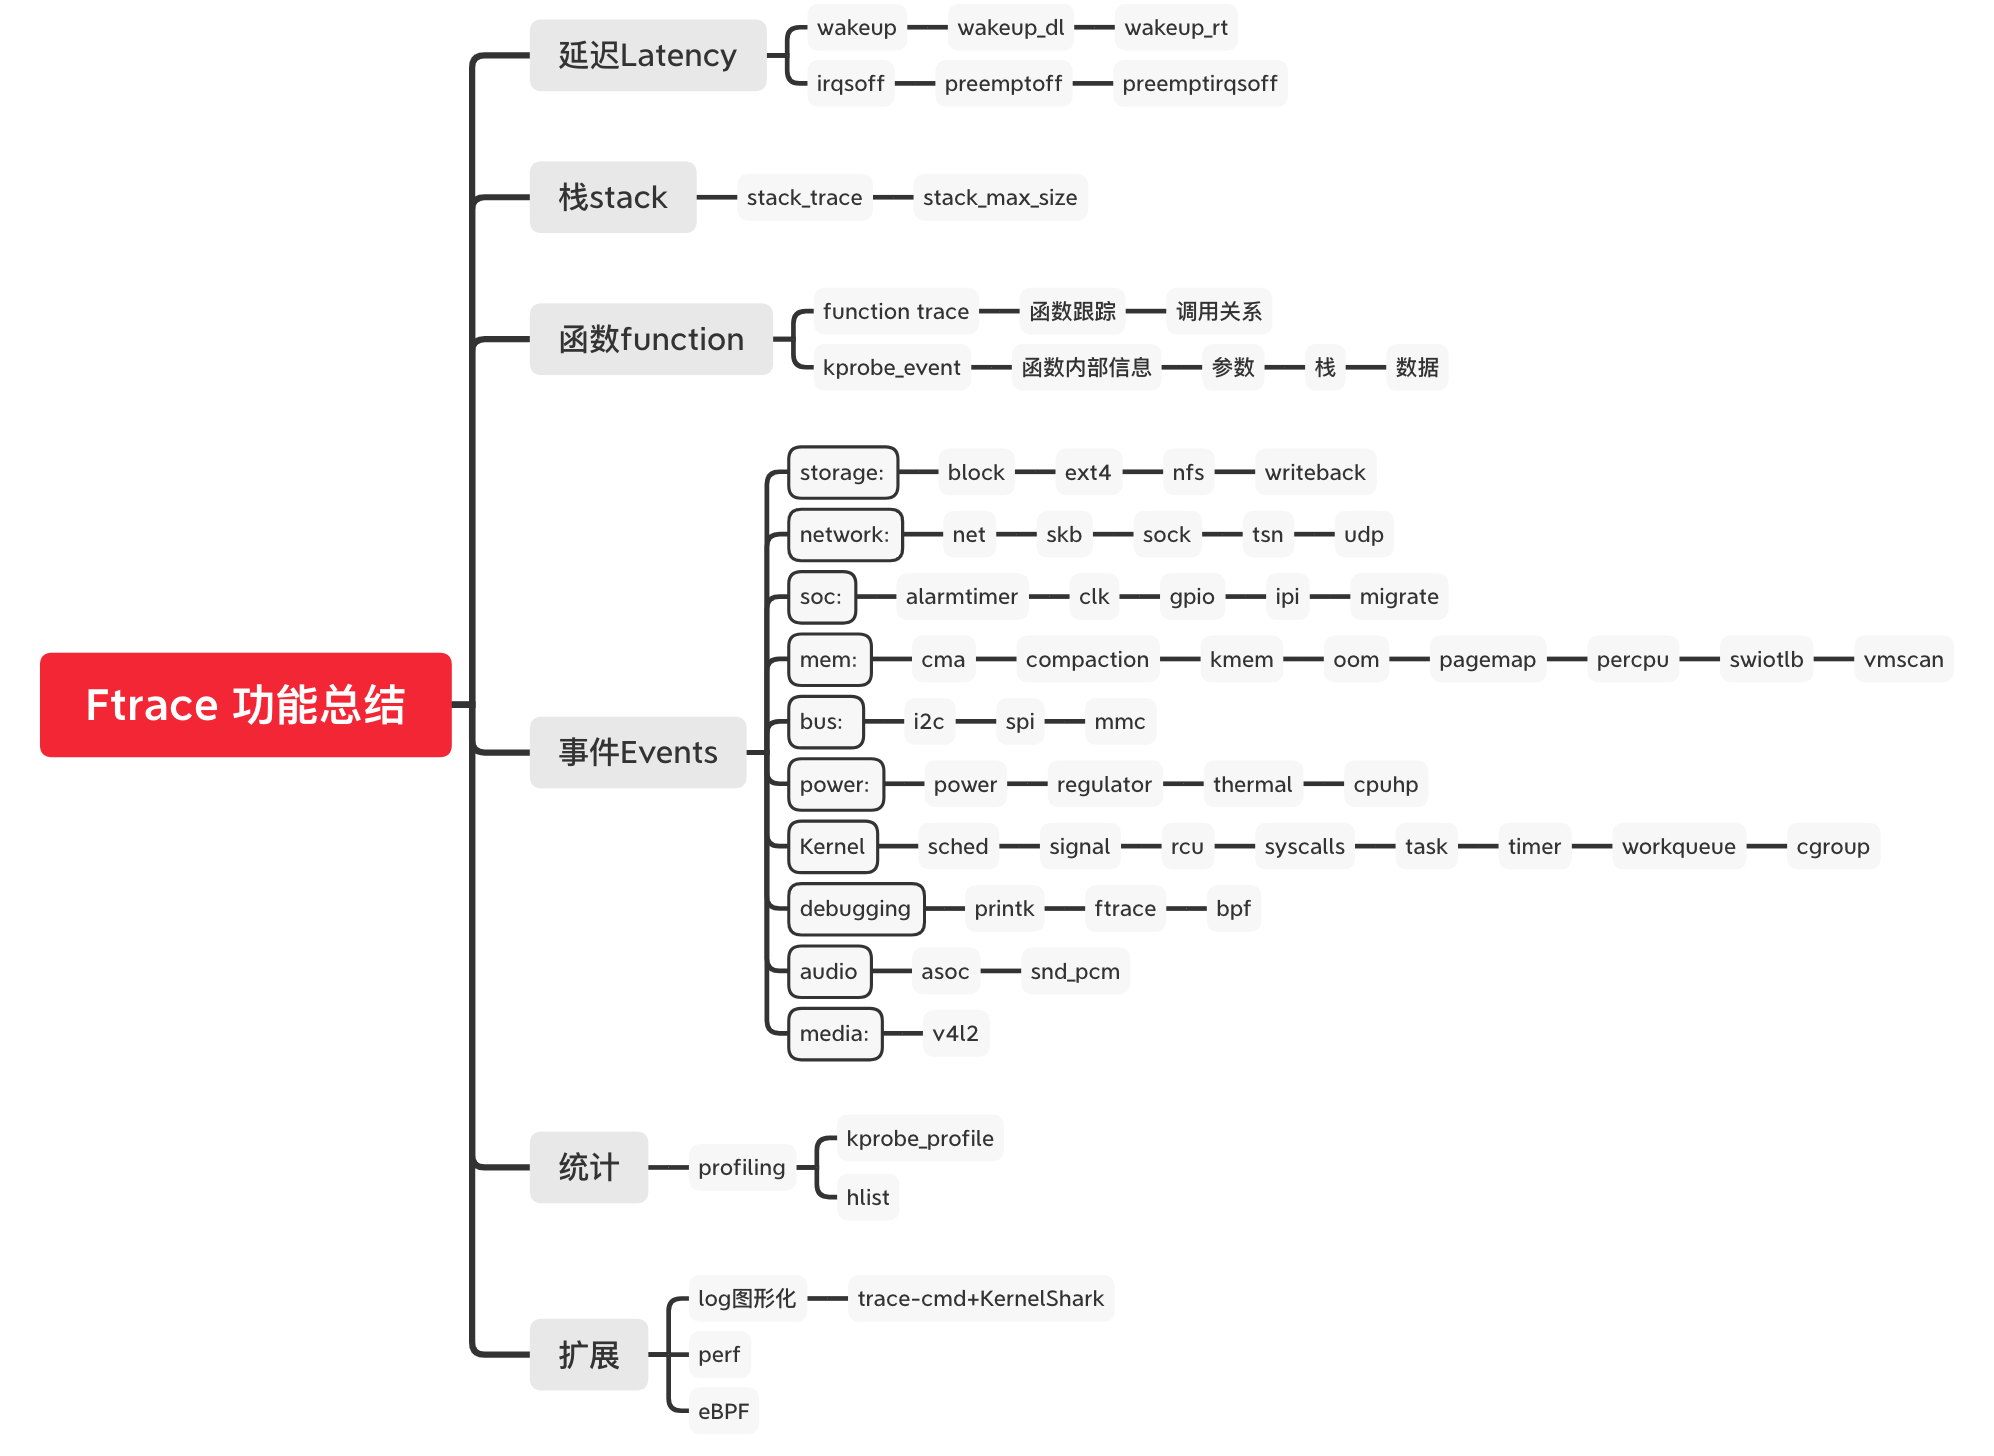
4. Ftrace功能总结
Reference
- Linux tracing systems & how they fit together https://jvns.ca/blog/2017/07/05/linux-tracing-systems/
- Linux Tracing Technologies https://www.kernel.org/doc/html/latest/trace/index.html
- LWN: Using the TRACE_EVENT() macro (Part 1)
- LWN: Using the TRACE_EVENT() macro (Part 2)
- LWN: Using the TRACE_EVENT() macro (Part 3)
文章标题:Ftrace的配置和使用
本文作者:hpyu
本文链接:https://www.cnblogs.com/hpyu/articles/14348523.html
欢迎转载,请注明原文链接

 浙公网安备 33010602011771号