
【原创】Ftrace的配置和使用
【原创】Ftrace的配置和使用
Ftrace是Linux Kernel的官方tracing系统,支持Function trace、静态tracepoint、动态Tracepoint的跟踪,还提供各种Tracer,用于统计最大irq延迟、最大函数调用栈大小、调度事件等。
Ftrace还提供了强大的过滤、快照snapshot、实例(instance)等功能,可以灵活配置。
内核配置Ftrace后,如果功能不打开,对性能几乎没有影响。打开事件记录后,由于是在percpu buffer中记录log,各CPU无需同步,引入的负载不大,非常适合在性能敏感的场景中使用。
相比kernle的log_buf和dynamic_debug机制,Ftrace的buffer大小可以灵活配置,可以生成快照,也有一定的优势。
ftrace功能比较多,但是归类整理以后主要使用场景也就是常见的几种,如果能按本文的说明操作一遍,就能快速上手了。
trace log格式,详细文档参看kernel/Documentation/trace/ftrace.txt
关键信息:
-
cmd: 执行程序名 -
pid:进程pid -
CPU#: CPU id -
irqs-off:当前CPU中断是否是关闭状态 -
need-resched:TIF_NEED_RESCHED和TIF_NEED_RESCHED的设置状态 -
hardirq/softirq: 中断处理上下文状态 -
preempt-depth:preempt_disabled的深度# tracer: irqsoff # # irqsoff latency trace v1.1.5 on 3.8.0-test+ # -------------------------------------------------------------------- # latency: 259 us, #4/4, CPU#2 | (M:preempt VP:0, KP:0, SP:0 HP:0 #P:4) # ----------------- # | task: ps-6143 (uid:0 nice:0 policy:0 rt_prio:0) # ----------------- # => started at: __lock_task_sighand # => ended at: _raw_spin_unlock_irqrestore # # # _------=> CPU# # / _-----=> irqs-off # | / _----=> need-resched # || / _---=> hardirq/softirq # ||| / _--=> preempt-depth # |||| / delay # cmd pid ||||| time | caller # \ / ||||| \ | / ps-6143 2d... 0us!: trace_hardirqs_off <-__lock_task_sighand ps-6143 2d..1 259us+: trace_hardirqs_on <-_raw_spin_unlock_irqrestore ps-6143 2d..1 263us+: time_hardirqs_on <-_raw_spin_unlock_irqrestore ps-6143 2d..1 306us : <stack trace> => trace_hardirqs_on_caller => trace_hardirqs_on => _raw_spin_unlock_irqrestore => do_task_stat => proc_tgid_stat => proc_single_show => seq_read => vfs_read => sys_read => system_call_fastpath
1. Ftrace的配置
Ftrace的相关配置如下
# 体系结构相关的实现
CONFIG_HAVE_FUNCTION_TRACER=y
CONFIG_HAVE_FUNCTION_GRAPH_TRACER=y
CONFIG_HAVE_DYNAMIC_FTRACE=y
CONFIG_HAVE_FTRACE_MCOUNT_RECORD=y
CONFIG_HAVE_SYSCALL_TRACEPOINTS=y
CONFIG_HAVE_ARCH_TRACEHOOK=y

# Function Trace
CONFIG_FTRACE=y
CONFIG_FUNCTION_TRACER=y
CONFIG_FUNCTION_GRAPH_TRACER=y
CONFIG_DYNAMIC_FTRACE=y # 打开DYANMIC_FTRACE后性能开销可忽略

# 各种tracer的支持
CONFIG_GENERIC_TRACER=y
CONFIG_NOP_TRACER=y
CONFIG_STACK_TRACER=y
CONFIG_IRQSOFF_TRACER=y
CONFIG_PREEMPT_TRACER=y
CONFIG_SCHED_TRACER=y
CONFIG_CONTEXT_SWITCH_TRACER=y
CONFIG_TRACER_SNAPSHOT=y
CONFIG_TRACER_SNAPSHOT_PER_CPU_SWAP=y

# 静态Trace events
CONFIG_TRACEPOINTS=y
CONFIG_EVENT_TRACING=y
CONFIG_TRACING_SUPPORT=y
CONFIG_TRACING=y

# 动态Trace events
CONFIG_PROBE_EVENTS=y
CONFIG_KPROBE_EVENTS=y
CONFIG_UPROBE_EVENTS=y

# 其它相关配置
CONFIG_TRACE_CLOCK=y
CONFIG_STACKTRACE_SUPPORT=y
CONFIG_STACKTRACE=y
CONFIG_TRACE_IRQFLAGS_SUPPORT=y
CONFIG_TRACE_IRQFLAGS=y
CONFIG_SYSCTL_EXCEPTION_TRACE=y
CONFIG_TRACER_MAX_TRACE=y
CONFIG_FTRACE_SYSCALLS=y
CONFIG_BLK_DEV_IO_TRACE=y
2. Tracefs的使用
Ftrace实现了一个tracefs的内存文件系统,默认挂载在/sys/kernel/debug/tracing/目录下。
本节把该目录下的文件和目录分组归类,做详细介绍。
另外可以参看kernel源码下的 Documentation/trace/ftrace.txt,这个是ftrace的官方使用文档,介绍比较详细。
2.1 README
-
README
README是tracefs的一个简要说明文档,可以cat 查看
# cat README
tracing mini-HOWTO:

# echo 0 > tracing_on : quick way to disable tracing
# echo 1 > tracing_on : quick way to re-enable tracing

 Important files:
  trace                 - The static contents of the buffer
                          To clear the buffer write into this file: echo > trace
  trace_pipe            - A consuming read to see the contents of the buffer
  current_tracer        - function and latency tracers
  available_tracers     - list of configured tracers for current_tracer
  buffer_size_kb        - view and modify size of per cpu buffer
  buffer_total_size_kb  - view total size of all cpu buffers

  trace_clock           -change the clock used to order events
       local:   Per cpu clock but may not be synced across CPUs
      global:   Synced across CPUs but slows tracing down.
     counter:   Not a clock, but just an increment
      uptime:   Jiffy counter from time of boot
        perf:   Same clock that perf events use

  trace_marker          - Writes into this file writes into the kernel buffer

  trace_marker_raw      - Writes into this file writes binary data into the kernel buffer
  tracing_cpumask       - Limit which CPUs to trace
  instances             - Make sub-buffers with: mkdir instances/foo
                          Remove sub-buffer with rmdir
  trace_options         - Set format or modify how tracing happens
                          Disable an option by adding a suffix 'no' to the option name
  saved_cmdlines_size   - echo command number in here to store comm-pid list

  available_filter_functions - list of functions that can be filtered on
  set_ftrace_filter     - echo function name in here to only trace these functions
             accepts: func_full_name or glob-matching-pattern
             modules: Can select a group via module
              Format: :mod:<module-name>
             example: echo :mod:ext3 > set_ftrace_filter
            triggers: a command to perform when function is hit
              Format: <function>:<trigger>[:count]
             trigger: traceon, traceoff
                      enable_event:<system>:<event>
                      disable_event:<system>:<event>
                      stacktrace
                      snapshot
                      dump
                      cpudump
             example: echo do_fault:traceoff > set_ftrace_filter
                      echo do_trap:traceoff:3 > set_ftrace_filter
             The first one will disable tracing every time do_fault is hit
             The second will disable tracing at most 3 times when do_trap is hit
               The first time do trap is hit and it disables tracing, the
               counter will decrement to 2. If tracing is already disabled,
               the counter will not decrement. It only decrements when the
               trigger did work
             To remove trigger without count:
               echo '!<function>:<trigger> > set_ftrace_filter
             To remove trigger with a count:
               echo '!<function>:<trigger>:0 > set_ftrace_filter
  set_ftrace_notrace    - echo function name in here to never trace.
            accepts: func_full_name, *func_end, func_begin*, *func_middle*
            modules: Can select a group via module command :mod:
            Does not accept triggers
  set_ftrace_pid        - Write pid(s) to only function trace those pids (function)
  snapshot              - Like 'trace' but shows the content of the static
                          snapshot buffer. Read the contents for more information
  stack_trace           - Shows the max stack trace when active
  stack_max_size        - Shows current max stack size that was traced
                          Write into this file to reset the max size (trigger a  new trace)
  stack_trace_filter    - Like set_ftrace_filter but limits what stack_trace traces
  kprobe_events         - Add/remove/show the kernel dynamic events
                          Write into this file to define/undefine new trace events.
  uprobe_events         - Add/remove/show the userspace dynamic events
                          Write into this file to define/undefine new trace events.
          accepts: event-definitions (one definition per line)
           Format: p[:[<group>/]<event>] <place> [<args>]
                   r[maxactive][:[<group>/]<event>] <place> [<args>]
                   -:[<group>/]<event>
            place: [<module>:]<symbol>[+<offset>]|<memaddr>
place (kretprobe): [<module>:]<symbol>[+<offset>]|<memaddr>
            place: <path>:<offset>
             args: <name>=fetcharg[:type]
         fetcharg: %<register>, @<address>, @<symbol>[+|-<offset>],
                   $stack<index>, $stack, $retval, $comm
             type: s8/16/32/64, u8/16/32/64, x8/16/32/64, string,
                   b<bit-width>@<bit-offset>/<container-size>
  events/               - Directory containing all trace event subsystems:
      enable            - Write 0/1 to enable/disable tracing of all events
  events/<system>/      - Directory containing all trace events for <system>:
      enable            - Write 0/1 to enable/disable tracing of all <system> events
      filter            - If set, only events passing filter are traced
  events/<system>/<event>/      - Directory containing control files for
                          <event>:
      enable            - Write 0/1 to enable/disable tracing of <event>
      filter            - If set, only events passing filter are traced
      trigger           - If set, a command to perform when event is hit
            Format: <trigger>[:count][if <filter>]
           trigger: traceon, traceoff
                    enable_event:<system>:<event>
                    disable_event:<system>:<event>
                    stacktrace
                    snapshot
           example: echo traceoff > events/block/block_unplug/trigger
                    echo traceoff:3 > events/block/block_unplug/trigger
                    echo 'enable_event:kmem:kmalloc:3 if nr_rq > 1' > \
                          events/block/block_unplug/trigger
           The first disables tracing every time block_unplug is hit.
           The second disables tracing the first 3 times block_unplug is hit.
           The third enables the kmalloc event the first 3 times block_unplug
             is hit and has value of greater than 1 for the 'nr_rq' event field.
           Like function triggers, the counter is only decremented if it
            enabled or disabled tracing.
           To remove a trigger without a count:
             echo '!<trigger> > <system>/<event>/trigger
           To remove a trigger with a count:
             echo '!<trigger>:0 > <system>/<event>/trigger
           Filters can be ignored when removing a trigger.
2.2 Trace buffer的设置和显示
- buffer_size_kb
- buffer_total_size_kb
- free_buffer
这三个文件用来对trace buffer分配、释放和查询。 Ftrace每个CPU都有一个对应的buffer,buffer_size_kb设置的是每个CPU上buffer的大小。
比如这里设置buffer_size_kb为100,000KB,对于4核处理器,实际是分配400MB。
free_buffers用于释放buffer。
# echo 100000 > buffer_size_kb
# cat buffer_total_size_kb
400000
# echo 1 > free_buffer
# cat buffer_size_kb
0
# cat buffer_total_size_kb
0
- trace
- trace_pipe
- snapshot
- trace_marker
- trace_marker_raw
- per_cpu/
这几个文件是对trace buffer的导出和插入功能。
trace是静态buffer,每次cat后log还保存在buffer中;echo > trace 可以清空buffer。
trace_pipe是消耗性的,cat一次后buffer会清空,可用于持续导出trace log:
cat trace_pipe > /tmp/trace.out &
snapshot可以获得当前的一个trace buffer的备份,方便保存某个时间点的buffer 内容,不影响原trace buffer的记录。
trace_marker 可以用来把用户层的log插入trace buffer,可以实现用户层和kernel的的trace log的同步,这是个很方便的功能,Android的Systrace就使用这个功能导出用户层trace log。
trace_marker_raw 是用来写入二进制数据的。
per_cpu是个目录,可以对每隔cpu的buffer size进行设置,和查看trace内容
root:/sys/kernel/debug/tracing# cat trace
# tracer: irqsoff
#
# irqsoff latency trace v1.1.5 on 4.14.74
# --------------------------------------------------------------------
# latency: 3305 us, #18446744073709432385/46979595, CPU#3 | (M:preempt VP:0, KP:0, SP:0 HP:0 #P:4)
#    -----------------
#    | task: kworker/3:1-63 (uid:0 nice:0 policy:0 rt_prio:0)
#    -----------------
#  => started at: drain_pages
#  => ended at:   drain_pages
#
#
#                  _------=> CPU#
#                 / _-----=> irqs-off
#                | / _----=> need-resched
#                || / _---=> hardirq/softirq
#                ||| / _--=> preempt-depth
#                |||| /     delay
#  cmd     pid   ||||| time  |   caller
#     \   /      |||||  \    |   /
kworker/-63      3d..3 3082us : get_pfnblock_flags_mask <-free_pcppages_bulk
kworker/-63      3d..3 3083us : __mod_zone_page_state <-free_pcppages_bulk
kworker/-63      3d..3 3084us : pfn_valid <-free_pcppages_bulk
kworker/-63      3d..3 3085us : memblock_is_map_memory <-pfn_valid
kworker/-63      3d..3 3086us : pfn_valid <-free_pcppages_bulk
kworker/-63      3d..3 3087us : memblock_is_map_memory <-pfn_valid
...
kworker/-32073   2dn.1 3655us : <stack trace>
 => drain_local_pages_wq
 => process_one_work
 => worker_thread
 => kthread
 => ret_from_fork

root:/sys/kernel/debug/tracing# echo 1111111111111111111111 > trace_marker
root:/sys/kernel/debug/tracing# cat trace
# tracer: nop
#
#                              _-----=> irqs-off
#                             / _----=> need-resched
#                            | / _---=> hardirq/softirq
#                            || / _--=> preempt-depth
#                            ||| /     delay
#           TASK-PID   CPU#  ||||    TIMESTAMP  FUNCTION
#              | |       |   ||||       |         |
              sh-1516  [003] .... 16131.075350: tracing_mark_write: 1111111111111111111111

root:/sys/kernel/debug/tracing# cat snapshot
# tracer: nop
#
#
# * Snapshot is freed *
#
# Snapshot commands:
# echo 0 > snapshot : Clears and frees snapshot buffer
# echo 1 > snapshot : Allocates snapshot buffer, if not already allocated.
#                      Takes a snapshot of the main buffer.
# echo 2 > snapshot : Clears snapshot buffer (but does not allocate or free)
#                      (Doesn't have to be '2' works with any number that
#                       is not a '0' or '1')
root:/sys/kernel/debug/tracing# echo 1 > snapshot
root:/sys/kernel/debug/tracing# cat snapshot
# tracer: nop
#
#                              _-----=> irqs-off
#                             / _----=> need-resched
#                            | / _---=> hardirq/softirq
#                            || / _--=> preempt-depth
#                            ||| /     delay
#           TASK-PID   CPU#  ||||    TIMESTAMP  FUNCTION
#              | |       |   ||||       |         |
              sh-1516  [003] .... 16131.075350: tracing_mark_write: 1111111111111111111111

root:/sys/kernel/debug/tracing# echo > trace 可以请空buffer
root:/sys/kernel/debug/tracing# ls per_cpu/ -R
per_cpu/:
cpu0  cpu1  cpu2  cpu3

per_cpu/cpu0:
buffer_size_kb  snapshot        snapshot_raw    stats           trace           trace_pipe      trace_pipe_raw

per_cpu/cpu1:
buffer_size_kb  snapshot        snapshot_raw    stats           trace           trace_pipe      trace_pipe_raw
2.3 trace 的控制
- tracing_on
- tracing_cpumask
- trace_clock
- trace_options
- options/
tracing_on是 trace的总开关,配置好以后 echo 1 > tracing_on 才开始记录。
许多配置需要关闭tracing才能设置,需要先 echo 0 > tracing_on
tracing_cpumask 是打开每个CPU的bitmap,比如默认是0xf。如果设置成0x3,就只trace CPU0和1。
trace_clock用于选择使用哪个时钟,这个会影响trace long中时间戳的打印,默认使用local的。
trace_options可以用来设置和查询trace log的输出选项,echo xxx > trace_options 就是打开xxx选项,echo noxxx > trace_options 就是关闭该选项。
options/目录下对每个选项有单独的文件,可以通过echo 1 或者0 来打开或关闭。
root:/sys/kernel/debug/tracing# echo 1 > tracing_on
root:/sys/kernel/debug/tracing# cat tracing_cpumask
f
root:/sys/kernel/debug/tracing# echo 1 > tracing_cpumask
root:/sys/kernel/debug/tracing# cat tracing_cpumask
1
root:/sys/kernel/debug/tracing# cat trace_options
print-parent
nosym-offset
nosym-addr
noverbose
noraw
root:/sys/kernel/debug/tracing# echo noprint-parent > trace_options
root:/sys/kernel/debug/tracing# cat trace_options
noprint-parent
nosym-offset
nosym-addr
noverbose
noraw
nohex
root:/sys/kernel/debug/tracing# cat options/print-parent
0
root:/sys/kernel/debug/tracing# echo 1 > options/print-parent
root:/sys/kernel/debug/tracing# cat options/print-parent
1

root:/sys/kernel/debug/tracing# echots_temp_read > set_ftrace_filter
root:/sys/kernel/debug/tracing# echo function > current_tracer
root:/sys/kernel/debug/tracing# echo func_stack_trace > trace_options
root:/sys/kernel/debug/tracing# echo 1 > tracing_on

root:/sys/kernel/debug/tracing# cat trace
# tracer: function
#
#                              _-----=> irqs-off
#                             / _----=> need-resched
#                            | / _---=> hardirq/softirq
#                            || / _--=> preempt-depth
#                            ||| /     delay
#           TASK-PID   CPU#  ||||    TIMESTAMP  FUNCTION
#              | |       |   ||||       |         |
     kworker/1:0-13974 [001] ...1 44214.144716:ts_temp_read <-hwmon_thermal_get_temp
     kworker/1:0-13974 [001] ...1 44244.864751:ts_temp_read <-hwmon_thermal_get_temp
     kworker/1:0-13974 [001] ...1 44244.864758: <stack trace>
 => of_thermal_get_temp
 => thermal_zone_get_temp
 => thermal_zone_device_update.part.12
 => thermal_zone_device_check
 => process_one_work
 => worker_thread
 => kthread
 => ret_from_fork
     kworker/1:0-13974 [001] ...1 44245.888747:ts_temp_read <-hwmon_thermal_get_temp
     kworker/1:0-13974 [001] ...1 44245.888755: <stack trace>
 => of_thermal_get_temp
 => thermal_zone_get_temp
 => thermal_zone_device_update.part.12
 => thermal_zone_device_check
 => process_one_work
 => worker_thread
 => kthread
 => ret_from_fork
     kworker/1:0-13974 [001] ...1 44246.912716:ts_temp_read <-hwmon_thermal_get_temp
     kworker/1:0-13974 [001] ...1 44246.912724: <stack trace>
 => of_thermal_get_temp
 => thermal_zone_get_temp
 => thermal_zone_device_update.part.12
 => thermal_zone_device_check
 => process_one_work
 => worker_thread
 => kthread
 => ret_from_fork
2.4. Tracer 的设置
- available_tracers
- current_tracer
- tracing_thresh
- tracing_max_latency
available_tracers显示目前支持的tracer,current_tracer用于设置当前使用的tracer
目前支持的tracer如下:
- blk:block tracer,主要用于blktrace 应用程序
- function: 跟踪函数调用,默认跟踪所有函数,如果设置set_ftrace_filter, 则跟踪过滤的函数
- function_graph:同function,但是打印带缩进的函数调用关系
- wakeup_dl: dealine调度的最大长wakeup latency
- wakeup_rt: rt调度的最大wakeup latency
- wakeup: 普通调度的的最大wakeup latency
- preemptirqsoff:关抢占或关irq的最大lantency,也称最大调度latency
- preemptoff: 关抢占的最大latency
- irqsoff: 关中断的最大lantecy
- nop:空tracer
另外function和function_graph即使不打开,实际也会记录每个函数的调用过程,在打印其它trace log中许多都要显示函数调用关系。
默认只显示parent的调用关系,可以通过echo display-graph > trace_options 设置显示function_graph
blk tracer比较特别,需要设置/sys/block/xxx/trace/enable 才工作,可参考https://lwn.net/Articles/315508/
root:/sys/kernel/debug/tracing# echo function > current_tracer
root:/sys/kernel/debug/tracing# cat trace
# tracer: function
#
#                              _-----=> irqs-off
#                             / _----=> need-resched
#                            | / _---=> hardirq/softirq
#                            || / _--=> preempt-depth
#                            ||| /     delay
#           TASK-PID   CPU#  ||||    TIMESTAMP  FUNCTION
#              | |       |   ||||       |         |
          <idle>-0     [001] dn.3   378.235883: preempt_count_add <-prandom_u32
          <idle>-0     [001] dn.4   378.235885: preempt_count_sub <-prandom_u32
          <idle>-0     [001] dn.3   378.235887: update_rq_clock <-__schedule
          <idle>-0     [001] dn.3   378.235889: pick_next_task_fair <-__schedule
          <idle>-0     [001] dn.3   378.235891: put_prev_task_idle <-pick_next_task_fair
          <idle>-0     [001] dn.3   378.235893: pick_next_entity <-pick_next_task_fair
          <idle>-0     [001] dn.3   378.235894: clear_buddies <-pick_next_entity
          <idle>-0     [001] dn.3   378.235896: set_next_entity <-pick_next_task_fair
          <idle>-0     [001] dn.3   378.235898: __update_load_avg_se.isra.3 <-set_next_entity
          <idle>-0     [001] dn.3   378.235900: decay_load <-__update_load_avg_se.isra.3
          <idle>-0     [001] dn.3   378.235902: decay_load <-__update_load_avg_se.isra.3
          <idle>-0     [001] dn.3   378.235903: __accumulate_pelt_segments <-__update_load_avg_se.isra.3
          <idle>-0     [001] dn.3   378.235905: __update_load_avg_cfs_rq.isra.4 <-set_next_entity
          <idle>-0     [001] d..3   378.235910: fpsimd_thread_switch <-__switch_to
          <idle>-0     [001] d..3   378.235912: hw_breakpoint_thread_switch <-__switch_to
          <idle>-0     [001] d..3   378.235914: uao_thread_switch <-__switch_to
    kworker/u8:0-9166  [001] d..3   378.235916: finish_task_switch <-__schedule
    kworker/u8:0-9166  [001] d..3   378.235919: _raw_spin_unlock_irq <-finish_task_switch
    kworker/u8:0-9166  [001] d..3   378.235921: do_raw_spin_unlock <-_raw_spin_unlock_irq
    kworker/u8:0-9166  [001] ...3   378.235923: preempt_count_sub <-_raw_spin_unlock_irq
    kworker/u8:0-9166  [001] ...2   378.235925: preempt_count_sub <-schedule
    kworker/u8:0-9166  [001] ...1   378.235927: _raw_spin_lock_irq <-worker_thread
    kworker/u8:0-9166  [001] d..1   378.235929: preempt_count_add <-_raw_spin_lock_irq
    kworker/u8:0-9166  [001] d..2   378.235931: preempt_count_add.part.2 <-preempt_count_add
    kworker/u8:0-9166  [001] d..2   378.235933: do_raw_spin_lock <-_raw_spin_lock_irq
    kworker/u8:0-9166  [001] d..2   378.235935: process_one_work <-worker_thread
    kworker/u8:0-9166  [001] d..2   378.235938: set_work_pool_and_clear_pending <-process_one_work
    kworker/u8:0-9166  [001] d..2   378.235939: _raw_spin_unlock_irq <-process_one_work
    kworker/u8:0-9166  [001] d..2   378.235941: do_raw_spin_unlock <-_raw_spin_unlock_irq
    kworker/u8:0-9166  [001] ...2   378.235943: preempt_count_sub <-_raw_spin_unlock_irq
    kworker/u8:0-9166  [001] ...1   378.235948: flush_to_ldisc <-process_one_work
    kworker/u8:0-9166  [001] ...1   378.235950: mutex_lock_nested <-flush_to_ldisc

root:/sys/kernel/debug/tracing# echo function_graph > current_tracer
root:/sys/kernel/debug/tracing# echo preempt_count_add > set_ftrace_filter
root:/sys/kernel/debug/tracing# echo  > trace
root:/sys/kernel/debug/tracing# cat trace
# tracer: function
#
#                              _-----=> irqs-off
#                             / _----=> need-resched
#                            | / _---=> hardirq/softirq
#                            || / _--=> preempt-depth
#                            ||| /     delay
#           TASK-PID   CPU#  ||||    TIMESTAMP  FUNCTION
#              | |       |   ||||       |         |
              sh-1512  [003] ...1   433.935445: preempt_count_add <-_raw_spin_lock
              sh-1512  [003] ...1   433.935452: preempt_count_add <-__mnt_drop_write
              sh-1512  [003] ...2   433.935454: preempt_count_add <-__mnt_drop_write
              sh-1512  [003] ...1   433.935457: preempt_count_add <-__sb_end_write
              sh-1512  [003] ...1   433.935460: preempt_count_add <-_raw_spin_lock
              sh-1512  [003] ...1   433.935465: preempt_count_add <-mntput_no_expire
              sh-1512  [003] ...1   433.935469: preempt_count_add <-__fd_install
              sh-1512  [003] ...1   433.935473: preempt_count_add <-kmem_cache_free
              sh-1512  [003] ...1   433.935481: preempt_count_add <-_raw_spin_lock
              sh-1512  [003] ...1   433.935485: preempt_count_add <-__fd_install
              sh-1512  [003] ...1   433.935491: preempt_count_add <-_raw_spin_lock
              sh-1512  [003] ...1   433.935498: preempt_count_add <-_raw_spin_lock

root:/sys/kernel/debug/tracing# echo > set_ftrace_filter
root:/sys/kernel/debug/tracing#
root:/sys/kernel/debug/tracing# echo > trace
root:/sys/kernel/debug/tracing# cat trace
# tracer: function_graph
#
# CPU  DURATION                  FUNCTION CALLS
# |     |   |                     |   |   |   |
 1)   0.166 us    |        } /* __msecs_to_jiffies */
 1)   0.167 us    |        __rcu_read_unlock();
 1)   7.416 us    |      } /* pick_next_task_fair */
 1)               |      pick_next_task_idle() {
 1)               |        put_prev_task_fair() {
 1)   0.250 us    |          put_prev_entity();
 1)   2.167 us    |        }
 1)   4.000 us    |      }
 1)   0.208 us    |      fpsimd_thread_switch();
 1)   0.209 us    |      hw_breakpoint_thread_switch();
 1)   0.167 us    |      uao_thread_switch();
 ------------------------------------------
 1)   rcu_pre-8    =>    <idle>-0
 ------------------------------------------

 1)               |      finish_task_switch() {
 1)               |        _raw_spin_unlock_irq() {
 1)   0.208 us    |          do_raw_spin_unlock();
 1)   0.209 us    |          preempt_count_sub();
 1)   4.167 us    |        }
 1)   6.500 us    |      }
 1) ! 269.166 us  |    } /* schedule_idle */
 1) # 3218.375 us |  } /* do_idle */
 1)               |  do_idle() {
 1)               |    quiet_vmstat() {
 1)               |      need_update() {
 1)   0.208 us    |        first_online_pgdat();
 1)   0.208 us    |        next_zone();
 1)   0.167 us    |        next_zone();
 1)   0.208 us    |        next_zone();
 1)   7.959 us    |      }
 1)   9.792 us    |    }

root:/sys/kernel/debug/tracing# echo wakeup > current_tracer
root:/sys/kernel/debug/tracing# echo > trace
root:/sys/kernel/debug/tracing# cat trace
# tracer: wakeup
#
# wakeup latency trace v1.1.5 on 4.14.74
# --------------------------------------------------------------------
# latency: 9427 us, #4517/4517, CPU#0 | (M:preempt VP:0, KP:0, SP:0 HP:0 #P:4)
#    -----------------
#    | task: isp_evt0-16588 (uid:0 nice:0 policy:1 rt_prio:99)
#    -----------------
#
#                  _------=> CPU#
#                 / _-----=> irqs-off
#                | / _----=> need-resched
#                || / _---=> hardirq/softirq
#                ||| / _--=> preempt-depth
#                |||| /     delay
#  cmd     pid   ||||| time  |   caller
#     \   /      |||||  \    |   /
xxx_test-16618   3d..4    0us :  16618:120:R   + [000] 16588:  0:R yyy_zzz0
xxx_test-16618   3d..4    2us : try_to_wake_up <-wake_up_process
yyy_zzz0-16588   0d..3    6us : preempt_count_add <-prandom_u32
yyy_zzz0-16588   0d..4    7us : preempt_count_sub <-prandom_u32
yyy_zzz0-16588   0d..3    8us : update_rq_clock <-__schedule
yyy_zzz0-16588   0d..3   10us : pick_next_task_stop <-__schedule
yyy_zzz0-16588   0d..3   11us : pick_next_task_dl <-__schedule
yyy_zzz0-16588   0d..3   13us : pick_next_task_rt <-__schedule
yyy_zzz0-16588   0d..3   14us : update_curr_rt <-pick_next_task_rt
yyy_zzz0-16588   0d..3   16us : dbs_update_util_handler <-update_curr_rt
yyy_zzz0-16588   0d..3   17us : cpuacct_charge <-update_curr_rt
yyy_zzz0-16588   0d..3   18us : __rcu_read_lock <-cpuacct_charge

root:/sys/kernel/debug/tracing# echo preemptirqsoff > current_tracer
root:/sys/kernel/debug/tracing# echo display-graph > trace_options
root:/sys/kernel/debug/tracing# cat trace
# tracer: preemptirqsoff
#
# preemptirqsoff latency trace v1.1.5 on 4.14.74
# --------------------------------------------------------------------
# latency: 4920 us, #5233/5233, CPU#1 | (M:preempt VP:0, KP:0, SP:0 HP:0 #P:4)
#    -----------------
#    | task: ls-22713 (uid:0 nice:0 policy:0 rt_prio:0)
#    -----------------
#  => started at: preempt_count_add
#  => ended at:   unmap_page_range
#
#
#                                       _-----=> irqs-off
#                                      / _----=> need-resched
#                                     | / _---=> hardirq/softirq
#                                     || / _--=> preempt-depth
#                                     ||| /
#     TIME        CPU  TASK/PID       ||||  DURATION                  FUNCTION CALLS
#      |          |     |    |        ||||   |   |                     |   |   |   |
 1153.066240 |   1)    ls-22713    |  ...1  0.000 us    |  preempt_count_add();
 1153.066242 |   1)    ls-22713    |  ...1  0.250 us    |  do_raw_spin_lock();
 1153.066244 |   1)    ls-22713    |  ...1  0.208 us    |  _vm_normal_page();
 1153.066246 |   1)    ls-22713    |  ...1  0.208 us    |  mark_page_accessed();
 1153.066248 |   1)    ls-22713    |  ...1              |  page_remove_rmap() {
 1153.066249 |   1)    ls-22713    |  ...1              |    lock_page_memcg() {
 1153.066250 |   1)    ls-22713    |  ...1  0.167 us    |      __rcu_read_lock();
 1153.066251 |   1)    ls-22713    |  ...1  2.167 us    |    }
 1153.066252 |   1)    ls-22713    |  ...1              |    unlock_page_memcg() {
 1153.066253 |   1)    ls-22713    |  ...1              |      __unlock_page_memcg() {
 1153.066254 |   1)    ls-22713    |  ...1  0.167 us    |        __rcu_read_unlock();
 1153.066256 |   1)    ls-22713    |  ...1  2.167 us    |      }
 1153.066257 |   1)    ls-22713    |  ...1  3.875 us    |    }
 1153.066258 |   1)    ls-22713    |  ...1  9.542 us    |  }
 1153.066259 |   1)    ls-22713    |  ...1  0.167 us    |  _vm_normal_page();
 1153.066261 |   1)    ls-22713    |  ...1  0.208 us    |  mark_page_accessed();
 1153.066263 |   1)    ls-22713    |  ...1              |  page_remove_rmap() {
 1153.066264 |   1)    ls-22713    |  ...1              |    lock_page_memcg() {
 1153.066265 |   1)    ls-22713    |  ...1  0.208 us    |      __rcu_read_lock();
 1153.066266 |   1)    ls-22713    |  ...1  2.209 us    |    }
 1153.066267 |   1)    ls-22713    |  ...1              |    unlock_page_memcg() {
 1153.066268 |   1)    ls-22713    |  ...1              |      __unlock_page_memcg() {
 1153.066269 |   1)    ls-22713    |  ...1  0.208 us    |        __rcu_read_unlock();
 1153.066271 |   1)    ls-22713    |  ...1  2.125 us    |      }
 1153.066273 |   1)    ls-22713    |  ...1  3.834 us    |    }
 1153.066273 |   1)    ls-22713    |  ...1  10.167 us   |  }
 1153.066274 |   1)    ls-22713    |  ...1  0.208 us    |  _vm_normal_page();
 1153.066276 |   1)    ls-22713    |  ...1  0.208 us    |  mark_page_accessed();
 1153.066278 |   1)    ls-22713    |  ...1              |  page_remove_rmap() {
 1153.066279 |   1)    ls-22713    |  ...1              |    lock_page_memcg() {
 1153.066280 |   1)    ls-22713    |  ...1  0.167 us    |      __rcu_read_lock();
 1153.066282 |   1)    ls-22713    |  ...1  2.209 us    |    }
 1153.066283 |   1)    ls-22713    |  ...1              |    unlock_page_memcg() {
 1153.066284 |   1)    ls-22713    |  ...1              |      __unlock_page_memcg() {
 1153.066285 |   1)    ls-22713    |  ...1  0.208 us    |        __rcu_read_unlock();
 1153.066287 |   1)    ls-22713    |  ...1  2.084 us    |      }
 1153.066288 |   1)    ls-22713    |  ...1  3.917 us    |    }
 1153.066288 |   1)    ls-22713    |  ...1  9.459 us    |  }

root:/sys/kernel/debug/tracing# cat tracing_max_latency
1684
root:/sys/kernel/debug/tracing# cat trace
# tracer: irqsoff
#
# irqsoff latency trace v1.1.5 on 4.14.74
# --------------------------------------------------------------------
# latency: 1684 us, #917/917, CPU#1 | (M:preempt VP:0, KP:0, SP:0 HP:0 #P:4)
#    -----------------
#    | task: stressapptest-1889 (uid:0 nice:0 policy:0 rt_prio:0)
#    -----------------
#  => started at: el0_irq_naked
#  => ended at:   irq_exit
#
#
#                                       _-----=> irqs-off
#                                      / _----=> need-resched
#                                     | / _---=> hardirq/softirq
#                                     || / _--=> preempt-depth
#                                     ||| /
#     TIME        CPU  TASK/PID       ||||  DURATION                  FUNCTION CALLS
#      |          |     |    |        ||||   |   |                     |   |   |   |
 1170.547913 |   1)  stressa-1889  |  d...  0.000 us    |  el0_irq_naked();
 1170.549600 |   1)  stressa-1889  |  dns.  0.000 us    |  trace_hardirqs_on();
stressap-1889    1dns. 1715us : <stack trace>
 => gic_handle_irq
 => el0_irq_naked

root:~# echo 1 >  /sys/block/mmcblk0/trace/enable
root:~# echo blk > /sys/kernel/debug/tracing/current_tracer
root:~# echo 1 > /sys/kernel/debug/tracing/tracing_on
root:~# cat /sys/kernel/debug/tracing/trace
# tracer: blk
#
 jbd2/mmcblk0p9--1100  [001] ...1   679.901410: 179,0    A  WS 323710 + 8 <- (179,9) 265048
 jbd2/mmcblk0p9--1100  [001] ...1   679.901428: 179,0    Q  WS 323710 + 8 [jbd2/mmcblk0p9-]
 jbd2/mmcblk0p9--1100  [001] ...1   679.901469: 179,0    G  WS 323710 + 8 [jbd2/mmcblk0p9-]
 jbd2/mmcblk0p9--1100  [001] ...1   679.901474: 179,0    P   N [jbd2/mmcblk0p9-]
 jbd2/mmcblk0p9--1100  [001] ...1   679.901491: 179,0    A  WS 323718 + 8 <- (179,9) 265056
         mmcqd/0-998   [000] ...1   679.901627: 179,0    m   N cfq1100SN dispatch_insert
         mmcqd/0-998   [000] ...1   679.901635: 179,0    m   N cfq1100SN dispatched a request
         mmcqd/0-998   [000] ...1   679.901641: 179,0    m   N cfq1100SN activate rq, drv=1
         mmcqd/0-998   [000] ...2   679.901645: 179,0    D  WS 323710 + 16 [mmcqd/0]
         mmcqd/0-998   [000] ...1   679.902979: 179,0    C  WS 323710 + 16 [0]

# tracer: irqsoff
#
# irqsoff latency trace v1.1.5 on 4.14.74
# --------------------------------------------------------------------
# latency: 1152 us, #4/4, CPU#1 | (M:preempt VP:0, KP:0, SP:0 HP:0 #P:4)
#    -----------------
#    | task: hapi_xj3_test-4680 (uid:0 nice:0 policy:0 rt_prio:0)
#    -----------------
#  => started at: dwe0_reset_control
#  => ended at:   dwe0_reset_control
#
#
#                  _------=> CPU#
#                 / _-----=> irqs-off
#                | / _----=> need-resched
#                || / _---=> hardirq/softirq
#                ||| / _--=> preempt-depth
#                |||| /     delay
#  cmd     pid   ||||| time  |   caller
#     \   /      |||||  \    |   /
hapi_xj3-4680    1d...    0us#: _raw_spin_lock_irqsave <-dwe0_reset_control
hapi_xj3-4680    1d..1 1151us : _raw_spin_unlock_irqrestore <-dwe0_reset_control
hapi_xj3-4680    1d..1 1155us : trace_hardirqs_on <-dwe0_reset_control
hapi_xj3-4680    1d..1 1160us : <stack trace>
 => dwe_fop_open
 => chrdev_open
 => do_dentry_open.isra.1
 => vfs_open
 => path_openat
 => do_filp_open
 => do_sys_open
 => SyS_openat
 => el0_svc_naked

root:/sys/kernel/debug/tracing# cat trace
# tracer: irqsoff
#
# irqsoff latency trace v1.1.5 on 4.14.74
# --------------------------------------------------------------------
# latency: 1934 us, #1076/1076, CPU#0 | (M:preempt VP:0, KP:0, SP:0 HP:0 #P:4)
#    -----------------
#    | task: swapper/0-0 (uid:0 nice:0 policy:0 rt_prio:0)
#    -----------------
#  => started at: arch_cpu_idle
#  => ended at:   irq_exit
#
#
#                  _------=> CPU#
#                 / _-----=> irqs-off
#                | / _----=> need-resched
#                || / _---=> hardirq/softirq
#                ||| / _--=> preempt-depth
#                |||| /     delay
#  cmd     pid   ||||| time  |   caller
#     \   /      |||||  \    |   /
  <idle>-0       0d..1    1us : el1_irq <-arch_cpu_idle
  <idle>-0       0d..2    5us : __handle_domain_irq <-gic_handle_irq
  <idle>-0       0d..2    8us : irq_enter <-__handle_domain_irq
  <idle>-0       0d..2   11us : rcu_irq_enter <-irq_enter
  <idle>-0       0d..2   15us : rcu_dynticks_eqs_exit <-rcu_irq_enter
  <idle>-0       0d..2   19us : __local_bh_disable_ip <-irq_enter
  <idle>-0       0d..2   22us : tick_irq_enter <-irq_enter
  <idle>-0       0d..2   26us : tick_check_oneshot_broadcast_this_cpu <-tick_irq_enter
  <idle>-0       0d..2   30us : ktime_get <-tick_irq_enter
  <idle>-0       0d..2   38us : arch_counter_read <-ktime_get
  <idle>-0       0d..2   41us : arch_counter_read_cc <-arch_counter_read
  <idle>-0       0d..2   45us : tick_nohz_stop_idle <-tick_irq_enter
  <idle>-0       0d..2   48us : update_ts_time_stats <-tick_nohz_stop_idle
  <idle>-0       0d..2   52us : nr_iowait_cpu <-update_ts_time_stats
  <idle>-0       0d..2   58us : _local_bh_enable <-irq_enter
.......
  <idle>-0       0d.h2 1344us : _raw_spin_lock <-x3_ldc_irq
  <idle>-0       0d.h2 1346us : preempt_count_add <-_raw_spin_lock
  <idle>-0       0d.h3 1347us : do_raw_spin_lock <-_raw_spin_lock
  <idle>-0       0d.h3 1349us : LOG_INTER <-x3_ldc_irq
  <idle>-0       0d.h3 1350us : _raw_spin_unlock <-x3_ldc_irq
  <idle>-0       0d.h3 1352us : do_raw_spin_unlock <-_raw_spin_unlock
  <idle>-0       0d.h3 1353us : preempt_count_sub <-_raw_spin_unlock
  <idle>-0       0d.h2 1354us : enable_irq <-x3_ldc_irq
  <idle>-0       0d.h2 1355us : __irq_get_desc_lock <-enable_irq
  <idle>-0       0d.h2 1356us : _raw_spin_lock_irqsave <-__irq_get_desc_lock
  <idle>-0       0d.h2 1357us : preempt_count_add <-_raw_spin_lock_irqsave
  <idle>-0       0d.h3 1359us : do_raw_spin_lock <-_raw_spin_lock_irqsave
  <idle>-0       0d.h3 1360us : __enable_irq <-enable_irq
  <idle>-0       0d.h3 1361us : irq_startup <-__enable_irq
  <idle>-0       0d.h3 1362us : irq_enable <-irq_startup
  <idle>-0       0d.h3 1364us : check_irq_resend <-irq_startup
  <idle>-0       0d.h3 1365us : __irq_put_desc_unlock <-enable_irq
  <idle>-0       0d.h3 1366us : _raw_spin_unlock_irqrestore <-__irq_put_desc_unlock
  <idle>-0       0d.h3 1367us : do_raw_spin_unlock <-_raw_spin_unlock_irqrestore
  <idle>-0       0d.h3 1369us : preempt_count_sub <-_raw_spin_unlock_irqrestore
  <idle>-0       0d.h2 1370us : add_interrupt_randomness <-handle_irq_event_percpu
  <idle>-0       0d.h2 1372us : note_interrupt <-handle_irq_event_percpu
  <idle>-0       0d.h2 1373us : _raw_spin_lock <-handle_irq_event
  <idle>-0       0d.h2 1374us : preempt_count_add <-_raw_spin_lock
.......
  <idle>-0       0d.h2 1925us : irqtime_account_irq <-irq_exit
  <idle>-0       0d.h2 1926us : irqtime_account_delta.isra.0 <-irqtime_account_irq
  <idle>-0       0d.h2 1927us : preempt_count_sub <-irq_exit
  <idle>-0       0d..2 1929us : ksoftirqd_running <-irq_exit
  <idle>-0       0d..2 1930us : __do_softirq <-irq_exit
  <idle>-0       0d..2 1931us : irqtime_account_irq <-__do_softirq
  <idle>-0       0d..2 1932us : __local_bh_disable_ip <-__do_softirq
  <idle>-0       0d.s1 1934us : __do_softirq <-irq_exit
  <idle>-0       0d.s1 1937us : trace_hardirqs_on <-irq_exit
  <idle>-0       0d.s1 1946us : <stack trace>
 => gic_handle_irq
 => el1_irq
 => arch_cpu_idle
 => default_idle_call
 => do_idle
 => cpu_startup_entry
 => rest_init
 => start_kernel

# tracer: irqsoff
#
# irqsoff latency trace v1.1.5 on 4.14.74
# --------------------------------------------------------------------
# latency: 3374 us, #3732/3732, CPU#2 | (M:preempt VP:0, KP:0, SP:0 HP:0 #P:4)
#    -----------------
#    | task: hapi_xj3_test-3282 (uid:0 nice:0 policy:0 rt_prio:0)
#    -----------------
#  => started at: unset_migratetype_isolate
#  => ended at:   unset_migratetype_isolate
#
#
#                                       _-----=> irqs-off
#                                      / _----=> need-resched
#                                     | / _---=> hardirq/softirq
#                                     || / _--=> preempt-depth
#                                     ||| /
#     TIME        CPU  TASK/PID       ||||  DURATION                  FUNCTION CALLS
#      |          |     |    |        ||||   |   |                     |   |   |   |
  108.240596 |   2)  hapi_xj-3282  |  d...  0.000 us    |  _raw_spin_lock_irqsave();
  108.240597 |   2)  hapi_xj-3282  |  d...              |  preempt_count_add() {
  108.240598 |   2)  hapi_xj-3282  |  d..1  0.209 us    |    preempt_count_add.part.2();
  108.240601 |   2)  hapi_xj-3282  |  d..1  2.041 us    |  }
  108.240602 |   2)  hapi_xj-3282  |  d..1  0.208 us    |  do_raw_spin_lock();
  108.240604 |   2)  hapi_xj-3282  |  d..1  0.208 us    |  get_pfnblock_flags_mask();
  108.240606 |   2)  hapi_xj-3282  |  d..1              |  move_freepages_block() {    //这块是cma的操作,可见CMA可能影响性能
  108.240607 |   2)  hapi_xj-3282  |  d..1              |    pfn_valid() {
  108.240608 |   2)  hapi_xj-3282  |  d..1  0.209 us    |      memblock_is_map_memory();
  108.240610 |   2)  hapi_xj-3282  |  d..1  2.083 us    |    }
...省略掉大量重复
  108.243953 |   2)  hapi_xj-3282  |  d..1              |    pfn_valid() {
  108.243954 |   2)  hapi_xj-3282  |  d..1  0.209 us    |      memblock_is_map_memory();
  108.243956 |   2)  hapi_xj-3282  |  d..1  2.042 us    |    }
  108.243956 |   2)  hapi_xj-3282  |  d..1  3349.792 us |  }
  108.243957 |   2)  hapi_xj-3282  |  d..1  0.458 us    |  __mod_zone_page_state();
  108.243960 |   2)  hapi_xj-3282  |  d..1  0.292 us    |  __mod_zone_page_state();
  108.243962 |   2)  hapi_xj-3282  |  d..1              |  set_pageblock_migratetype() {
  108.243963 |   2)  hapi_xj-3282  |  d..1  0.375 us    |    set_pfnblock_flags_mask();
  108.243965 |   2)  hapi_xj-3282  |  d..1  2.292 us    |  }
  108.243966 |   2)  hapi_xj-3282  |  d..1              |  _raw_spin_unlock_irqrestore() {
  108.243967 |   2)  hapi_xj-3282  |  d..1  0.250 us    |    do_raw_spin_unlock();
  108.243969 |   2)  hapi_xj-3282  |  d..1  0.000 us    |  _raw_spin_unlock_irqrestore();
  108.243972 |   2)  hapi_xj-3282  |  d..1  0.000 us    |  trace_hardirqs_on();
hapi_xj3-3282    2d..1 3386us : <stack trace>
 => alloc_contig_range
 => cma_alloc
 => ion_cma_allocate
 => ion_alloc
 => pym_alloc_ion_bufffer
 => x3_pym_ioctl
 => do_vfs_ioctl
 => SyS_ioctl
 => el0_svc_naked
  108.243955 |   2)  hapi_xj-3282  |  d..1  0.209 us    |      } /* memblock_is_map_memory */
  108.243956 |   2)  hapi_xj-3282  |  d..1  2.042 us    |    } /* pfn_valid */
  108.243956 |   2)  hapi_xj-3282  |  d..1  3349.792 us |  } /* move_freepages_block */
  108.243957 |   2)  hapi_xj-3282  |  d..1  0.458 us    |  __mod_zone_page_state();
  108.243960 |   2)  hapi_xj-3282  |  d..1  0.292 us    |  __mod_zone_page_state();
  108.243962 |   2)  hapi_xj-3282  |  d..1              |  set_pageblock_migratetype() {
  108.243963 |   2)  hapi_xj-3282  |  d..1  0.375 us    |    set_pfnblock_flags_mask();
  108.243965 |   2)  hapi_xj-3282  |  d..1  2.292 us    |  }
  108.243966 |   2)  hapi_xj-3282  |  d..1              |  _raw_spin_unlock_irqrestore() {
  108.243967 |   2)  hapi_xj-3282  |  d..1  0.250 us    |    do_raw_spin_unlock();
  108.243969 |   2)  hapi_xj-3282  |  d..1  0.000 us    |  _raw_spin_unlock_irqrestore();
  108.243972 |   2)  hapi_xj-3282  |  d..1  0.000 us    |  trace_hardirqs_on();
hapi_xj3-3282    2d..1 3386us : <stack trace>
 => alloc_contig_range
 => cma_alloc
 => ion_cma_allocate
 => ion_alloc
 => pym_alloc_ion_bufffer
 => x3_pym_ioctl
 => do_vfs_ioctl
 => SyS_ioctl
 => el0_svc_naked
- tracing_thresh
- 记录超过这个tracing_thresh的lantecy
- tracing_max_latency
- 显示最大的lantency,和当前trace里记录的一致。
2.5 Function Trace的设置
- available_filter_functions: 列出所有可以过滤的函数
- dyn_ftrace_total_info: 函数总数
- set_ftrace_filter: 设置跟踪的函数
- set_ftrace_notrace: 设置不跟踪的函数
- set_ftrace_pid: 设置只在哪些进程上过滤
- enabled_functions: 显示当前所有被跟踪的函数
这组文件用于过滤函数。从dyn_ftrace_total_info可以看到,一个运行的kernel可跟踪的函数可能有几万个,如果不做过滤,得到的log冗余信息太多。
set_ftrace_filter的使用规则如下
  set_ftrace_filter     - echo function name in here to only trace these functions,使用echo 设置
             accepts: func_full_name or glob-matching-pattern,函数全名或者匹配字符串
             modules: Can select a group via module, 可以通过module选择一组函数
              Format: :mod:<module-name>, module设置使用:mod:开头,例如:mod:hobot_ipu
             example: echo :mod:ext3 > set_ftrace_filter
            triggers: a command to perform when function is hit,执行到被trace的函数时,可以指定一个动作,还可以指定第几次执行trigger
              Format: <function>:<trigger>[:count]
             trigger: traceon, traceoff
                      enable_event:<system>:<event>
                      disable_event:<system>:<event>
                      stacktrace
                      snapshot
                      dump
                      cpudump
             example: echo do_fault:traceoff > set_ftrace_filter
                      echo do_trap:traceoff:3 > set_ftrace_filter
             The first one will disable tracing every time do_fault is hit
             The second will disable tracing at most 3 times when do_trap is hit
               The first time do trap is hit and it disables tracing, the
               counter will decrement to 2. If tracing is already disabled,
               the counter will not decrement. It only decrements when the
               trigger did work
             To remove trigger without count:
               echo '!<function>:<trigger> > set_ftrace_filter
             To remove trigger with a count:
               echo '!<function>:<trigger>:0 > set_ftrace_filter
需要把tracer设置成function或者function_graph
root:/sys/kernel/debug/tracing# echo function_graph > current_tracer
root:/sys/kernel/debug/tracing# echo :mod:comp_xpu > set_ftrace_filter
root:/sys/kernel/debug/tracing# head enabled_functions
xpu_set_input_img_size [comp_xpu] (1)
xpu_set_rdma_stride [comp_xpu] (1)
xpu_set_us_wdma_stride [comp_xpu] (1)
xpu_set_ds_wdma_stride [comp_xpu] (1)
xpu_set_ds_roi_enable [comp_xpu] (1)
xpu_set_ds_roi_rect [comp_xpu] (1)
xpu_set_ds_enable [comp_xpu] (1)
xpu_set_ds2_wdma_enable [comp_xpu] (1)
xpu_set_ds_target_size [comp_xpu] (1)
xpu_set_ds_step [comp_xpu] (1)
root:/sys/kernel/debug/tracing# echo 0 > tracing_on
root:/sys/kernel/debug/tracing# echo > trace
root:/sys/kernel/debug/tracing# echo 1 > tracing_on
root:/sys/kernel/debug/tracing# cat trace
# tracer: function_graph
#
# CPU  DURATION                  FUNCTION CALLS
# |     |   |                     |   |   |   |
 0) + 10.792 us   |  xx_xpu_open [comp_xpu]();
 0)               |  xx_xpu_ioctl [comp_xpu]() {
 0) + 23.708 us   |    xpu_bind_chain_group [comp_xpu]();
 0) + 28.042 us   |  }
 0)               |  xx_xpu_ioctl [comp_xpu]() {
 0)               |    xpu_video_init [comp_xpu]() {
 0)               |      xpu_update_ds_param [comp_xpu]() {
 0)               |        xpu_update_ds_ch_param [comp_xpu]() {
 0)   0.834 us    |          xpu_get_shd_rdy [comp_xpu]();
 0)   0.375 us    |          xpu_set_shd_rdy [comp_xpu]();
 0)   1.167 us    |          xpu_set_ds_target_size [comp_xpu]();
 0)   0.583 us    |          xpu_set_ds_wdma_stride [comp_xpu]();
 0)   1.333 us    |          xpu_set_ds_step [comp_xpu]();
 0)   1.625 us    |          xpu_set_ds_roi_rect [comp_xpu]();
 0)   0.292 us    |          xpu_get_shd_rdy [comp_xpu]();
 0)   0.209 us    |          xpu_set_shd_rdy [comp_xpu]();
 0) + 28.042 us   |        }
 0) + 10.875 us   |        xpu_set_group_leader [comp_xpu]();
 0) + 45.000 us   |      }
 0) ! 229.083 us  |    }
 0) ! 232.666 us  |  }
 0)               |  xx_xpu_ioctl [comp_xpu]() {
 0) + 25.292 us   |    xpu_video_reqbufs [comp_xpu]();
 0) + 28.667 us   |  }
 0)               |  xx_xpu_ioctl [comp_xpu]() {
 0)   0.375 us    |    xpu_video_getindex [comp_xpu]();
 0)   3.458 us    |  }
 0)               |  xx_xpu_ioctl [comp_xpu]() {
 0) * 15894.87 us |    xpu_alloc_ion_bufffer [comp_xpu]();
 0) * 15916.04 us |  }
 0) + 23.208 us   |  xx_xpu_mmap [comp_xpu]();
 0)   9.958 us    |  xx_xpu_mmap [comp_xpu]();
 0) + 11.625 us   |  xx_xpu_mmap [comp_xpu]();
 0)   4.500 us    |  xx_xpu_mmap [comp_xpu]();
 0) + 12.375 us   |  xx_xpu_mmap [comp_xpu]();
 0)   9.583 us    |  xx_xpu_mmap [comp_xpu]();
 0) + 11.417 us   |  xx_xpu_mmap [comp_xpu]();
 0) + 49.542 us   |  xx_xpu_mmap [comp_xpu]();
 0) + 12.375 us   |  xx_xpu_mmap [comp_xpu]();
 0)   9.541 us    |  xx_xpu_mmap [comp_xpu]();
 0) + 11.458 us   |  xx_xpu_mmap [comp_xpu]();
 0)   4.667 us    |  xx_xpu_mmap [comp_xpu]();
 0)   6.333 us    |  xx_xpu_open [comp_xpu]();
 0)               |  xx_xpu_ioctl [comp_xpu]() {
 0) + 31.334 us   |    xpu_bind_chain_group [comp_xpu]();
 0) + 35.791 us   |  }
 0)               |  xx_xpu_ioctl [comp_xpu]() {
 0)               |    xpu_video_init [comp_xpu]() {
 0)               |      xpu_update_common_param [comp_xpu]() {
 0)   0.541 us    |        xpu_get_shd_rdy [comp_xpu]();
 0)   0.333 us    |        xpu_set_shd_rdy [comp_xpu]();
 0)   0.833 us    |        xpu_src_select [comp_xpu]();
 0)   0.375 us    |        xpu_set_frameid_enable [comp_xpu]();
 0)   0.625 us    |        xpu_set_input_img_size [comp_xpu]();
 0)   0.958 us    |        xpu_set_ds2_wdma_enable [comp_xpu]();
 0)               |        xpu_update_ds_ch_param [comp_xpu]() {
 0)   0.334 us    |          xpu_get_shd_rdy [comp_xpu]();
 0)   0.250 us    |          xpu_set_shd_rdy [comp_xpu]();
 0)   1.209 us    |          xpu_set_ds_target_size [comp_xpu]();
 0)   0.708 us    |          xpu_set_ds_wdma_stride [comp_xpu]();
 0)   1.542 us    |          xpu_set_ds_step [comp_xpu]();
 0)   1.916 us    |          xpu_set_ds_roi_rect [comp_xpu]();
 0)   0.333 us    |          xpu_get_shd_rdy [comp_xpu]();
 0)   0.250 us    |          xpu_set_shd_rdy [comp_xpu]();
 0) + 26.958 us   |        }

root:/sys/kernel/debug/tracing# echo :mod:comp_pim >> set_ftrace_filter
root:/sys/kernel/debug/tracing# cat enabled_functions | grep pim
pim_select_input_path [comp_pim] (1)
pim_enable_module [comp_pim] (1)
pim_enable_otf_clk [comp_pim] (1)
pim_enable_ddr_clk [comp_pim] (1)
pim_rdma_set_addr [comp_pim] (1)
pim_wdma_ds_set_addr [comp_pim] (1)
2.6 静态trace事件的配置
- available_events: 当前所有支持的trace event,比如xj3上有1236个,
- events/: events/目录下第一级目录是模块目录,第二级目录时事件目录
- set_event:用于设置打开事件,也可以查询
- set_event_pid
跟踪静态事件一般把tracer设置为nop。
root:/sys/kernel/debug/tracing# echo ext4_releasepage > set_event
root:/sys/kernel/debug/tracing# echo ext4_mballoc_alloc >> set_event
root:/sys/kernel/debug/tracing# echo 0 > tracing_on
root:/sys/kernel/debug/tracing# echo nop > current_tracer
root:/sys/kernel/debug/tracing# echo > trace
root:/sys/kernel/debug/tracing# echo 1 > tracing_on
root:/sys/kernel/debug/tracing# mkdir /userdata/xxxxx
root:/sys/kernel/debug/tracing# sync

root:/sys/kernel/debug/tracing# cat trace
# tracer: nop
#
#                              _-----=> irqs-off
#                             / _----=> need-resched
#                            | / _---=> hardirq/softirq
#                            || / _--=> preempt-depth
#                            ||| /     delay
#           TASK-PID   CPU#  ||||    TIMESTAMP  FUNCTION
#              | |       |   ||||       |         |
           mkdir-29520 [002] ....  3492.156569: ext4_mballoc_alloc: dev 179,12 inode 271 orig 0/0/1@0 goal 0/0/1@0 result 0/8357/1@0 blks 1 grps 1 cr 1 flags  tail 0 broken 0

root:/sys/kernel/debug/tracing# echo syscalls > set_event
root:/sys/kernel/debug/tracing# cat set_event
syscalls:sys_exit_arm64_personality
syscalls:sys_enter_arm64_personality
syscalls:sys_exit_unshare
syscalls:sys_enter_unshare
syscalls:sys_exit_clone
syscalls:sys_enter_clone
syscalls:sys_exit_set_tid_address
syscalls:sys_enter_set_tid_address
syscalls:sys_exit_wait4
syscalls:sys_enter_wait4
syscalls:sys_exit_waitid
syscalls:sys_enter_waitid

root:/sys/kernel/debug/tracing# echo > trace
root:/sys/kernel/debug/tracing# echo xxxxx > /userdata/test.txt
root:/sys/kernel/debug/tracing# sync
root:/sys/kernel/debug/tracing# trace
-sh: trace: not found
root:/sys/kernel/debug/tracing# cat trace
# tracer: function_graph
#
# CPU  DURATION                  FUNCTION CALLS
# |     |   |                     |   |   |   |
 1)               |  /* sys_openat -> 0x3 */
 1)               |  /* sys_fcntl(fd: 1, cmd: 406, arg: a) */
 1)               |  /* sys_fcntl -> 0xb */
 1)               |  /* sys_dup3(oldfd: 3, newfd: 1, flags: 0) */
 1)               |  /* sys_dup3 -> 0x1 */
 1)               |  /* sys_close(fd: 3) */
 1)               |  /* sys_close -> 0x0 */
 1)               |  /* sys_wait4(upid: ffffffffffffffff, stat_addr: 7feae680fc, options: 3, ru: 0) */
 1)               |  /* sys_wait4 -> 0xfffffffffffffff6 */
 1)               |  /* sys_write(fd: 1, buf: 55825a3b00, count: 1) */
 1)               |  /* sys_write -> 0x1 */
 1)               |  /* sys_dup3(oldfd: b, newfd: 1, flags: 0) */
 1)               |  /* sys_dup3 -> 0x1 */
 1)               |  /* sys_close(fd: b) */
 1)               |  /* sys_close -> 0x0 */
 1)               |  /* sys_wait4(upid: ffffffffffffffff, stat_addr: 7feae6821c, options: 3, ru: 0) */
 1)               |  /* sys_wait4 -> 0xfffffffffffffff6 */
 1)               |  /* sys_ioctl(fd: 0, cmd: 5401, arg: 7feae68048) */
 1)               |  /* sys_ioctl -> 0x0 */
 1)               |  /* sys_ioctl(fd: 0, cmd: 5402, arg: 7feae68068) */
 1)               |  /* sys_ioctl -> 0x0 */
 1)               |  /* sys_geteuid() */
 1)               |  /* sys_geteuid -> 0x0 */
 1)               |  /* sys_openat(dfd: ffffffffffffff9c, filename: 7fa221dae0, flags: 80000, mode: 0) */
 1)               |  /* sys_openat -> 0x3 */

root:~# cd /sys/kernel/debug/tracing/events/ext4/ext4_readpage
root:/sys/kernel/debug/tracing/events/ext4/ext4_readpage# cat enable
0
root:/sys/kernel/debug/tracing/events/ext4/ext4_readpage# cat filter
none
root:/sys/kernel/debug/tracing/events/ext4/ext4_readpage# cat format
name: ext4_readpage
ID: 731
format:
        field:unsigned short common_type;       offset:0;       size:2; signed:0;
        field:unsigned char common_flags;       offset:2;       size:1; signed:0;
        field:unsigned char common_preempt_count;       offset:3;       size:1; signed:0;
        field:int common_pid;   offset:4;       size:4; signed:1;

        field:dev_t dev;        offset:8;       size:4; signed:0;
        field:ino_t ino;        offset:16;      size:8; signed:0;
        field:unsigned long index;      offset:24;      size:8; signed:0;

print fmt: "dev %d,%d ino %lu page_index %lu", ((unsigned int) ((REC->dev) >> 20)), ((unsigned int) ((REC->dev) & ((1U << 20) - 1))), (unsigned long) REC->ino, (unsigned long) REC->index
root:/sys/kernel/debug/tracing/events/ext4/ext4_readpage# cat id
731
root:/sys/kernel/debug/tracing/events/ext4/ext4_readpage# cat trigger
# Available triggers:
# traceon traceoff snapshot stacktrace enable_event disable_event
2.7 动态trace事件的配置
-
kprobe_events,内核函数动态trace事件的设置和查询
-
kprobe_profile,动态事件触发的次数
-
uprobe_events,用户空间函数动态trace事件的设置和查询
-
uprobe_profile
root:/sys/kernel/debug/tracing# echo 0 > tracing_on
root:/sys/kernel/debug/tracing# edho > trace
root:/sys/kernel/debug/tracing# echo nop > current_tracer
root:/sys/kernel/debug/tracing# echo 'p:myprobe xxx_set_dma_addr base_addr=%x0 ds_ch=%x1 y_addr=%x2 cb_addr=%x
root:/sys/kernel/debug/tracing# cat kprobe_events
p:kprobes/myprobe xxx_set_dma_addr base_addr=%x0 ds_ch=%x1 y_addr=%x2 cb_addr=%x3
root:/sys/kernel/debug/tracing# echo 1 > tracing_on
root:/sys/kernel/debug/tracing# echo 1 > events/kprobes/enable
root:/sys/kernel/debug/tracing# /app/bin/test_prog.sh
root:/sys/kernel/debug/tracing# cat trace
# tracer: nop
#
#                              _-----=> irqs-off
#                             / _----=> need-resched
#                            | / _---=> hardirq/softirq
#                            || / _--=> preempt-depth
#                            ||| /     delay
#           TASK-PID   CPU#  ||||    TIMESTAMP  FUNCTION
#              | |       |   ||||       |         |
         test_exe-29655 [001] d..1  4905.371874: myprobe: (xxx_set_dma_addr+0x0/0xa0 [comp_xxx]) base_addr=0xffffff800a57d000 ds_ch=0x5a00000 y_addr=0x5b00000 cb_addr=0xfc0bf9
         test_exe-29655 [001] d..1  4905.401943: myprobe: (xxx_set_dma_addr+0x0/0xa0 [comp_xxx]) base_addr=0xffffff800a57d000 ds_ch=0x5c00000 y_addr=0x5b80000 cb_addr=0xfc0bf9
         test_exe-29655 [001] d..1  4905.432149: myprobe: (xxx_set_dma_addr+0x0/0xa0 [comp_xxx]) base_addr=0xffffff800a57d000 ds_ch=0x5d00000 y_addr=0x5e00000 cb_addr=0xfc0bf9
         test_exe-29655 [001] d..1  4905.462380: myprobe: (xxx_set_dma_addr+0x0/0xa0 [comp_xxx]) base_addr=0xffffff800a57d000 ds_ch=0x5f00000 y_addr=0x5e80000 cb_addr=0xfc0bf9
         test_exe-29655 [001] d..1  4905.492587: myprobe: (xxx_set_dma_addr+0x0/0xa0 [comp_xxx]) base_addr=0xffffff800a57d000 ds_ch=0x6000000 y_addr=0x6100000 cb_addr=0xfc0bf9
         test_exe-29655 [001] d..1  4905.522793: myprobe: (xxx_set_dma_addr+0x0/0xa0 [comp_xxx]) base_addr=0xffffff800a57d000 ds_ch=0x6200000 y_addr=0x6180000 cb_addr=0xfc0bf9
         test_exe-29655 [001] d..1  4905.552998: myprobe: (xxx_set_dma_addr+0x0/0xa0 [comp_xxx]) base_addr=0xffffff800a57d000 ds_ch=0x6300000 y_addr=0x6400000 cb_addr=0xfc0bf9
         test_exe-29655 [001] d..1  4905.583207: myprobe: (xxx_set_dma_addr+0x0/0xa0 [comp_xxx]) base_addr=0xffffff800a57d000 ds_ch=0x6500000 y_addr=0x6480000 cb_addr=0xfc0bf9
         test_exe-29655 [001] d..1  4905.613419: myprobe: (xxx_set_dma_addr+0x0/0xa0 [comp_xxx]) base_addr=0xffffff800a57d000 ds_ch=0x5a00000 y_addr=0x5b00000 cb_addr=0xfc0bf9
         test_exe-29655 [001] d..1  4905.643628: myprobe: (xxx_set_dma_addr+0x0/0xa0 [comp_xxx]) base_addr=0xffffff800a57d000 ds_ch=0x5c00000 y_addr=0x5b80000 cb_addr=0xfc0bf9
         test_exe-29655 [001] d..1  4905.673825: myprobe: (xxx_set_dma_addr+0x0/0xa0 [comp_xxx]) base_addr=0xffffff800a57d000 ds_ch=0x5d00000 y_addr=0x5e00000 cb_addr=0xfc0bf9
2.8 instance功能
instance功能很强大。
在这个目录下创建一个目录,可以生成和tracefs下相同的所有配置文件。
相当于在全局的设置之外,可以创建多个instance,每个都有自己的独立配置,比如下面这样,foo跟踪sched_wakeup event;bar跟踪irq event;zoot跟踪syscalls event,这样可以很清晰地把不同类型的事件区分开。
/sys/kernel/debug/tracing/instances# mkdir xxx
/sys/kernel/debug/tracing/instances# ls xxx/
available_tracers     free_buffer           set_ftrace_filter     trace_clock           tracing_cpumask
buffer_size_kb        options               set_ftrace_notrace    trace_marker          tracing_max_latency
buffer_total_size_kb  per_cpu               set_ftrace_pid        trace_marker_raw      tracing_on
current_tracer        set_event             snapshot              trace_options
events

# mkdir instances/foo
# mkdir instances/bar
# mkdir instances/zoot
# echo 100000 > buffer_size_kb
# echo 1000 > instances/foo/buffer_size_kb
# echo 5000 > instances/bar/per_cpu/cpu1/buffer_size_kb
# echo function > current_trace
# echo 1 > instances/foo/events/sched/sched_wakeup/enable
# echo 1 > instances/foo/events/sched/sched_wakeup_new/enable
# echo 1 > instances/foo/events/sched/sched_switch/enable
# echo 1 > instances/bar/events/irq/enable
# echo 1 > instances/zoot/events/syscalls/enable
2.9 其它功能
- stack_max_size
- stack_trace
- stack_trace_filter
stack trace就是利用ftrace的function tracer,在每次trace函数调用时来记录stack的状态
stack trace是个独立的技术,可以使用中断等方式抽样,也可是利用ftrace,所以其配置文件在/proc下
stack_max_size记录的是最大的深度的栈,Depth是栈的深度,Size是每个栈帧的大小,Location是函数的调用顺序
CONFIG_STACK_TRACER enables the ftrace stack tracing functionality.
To enable it, write a '1' into /proc/sys/kernel/stack_tracer_enabled.

 # echo 1 > /proc/sys/kernel/stack_tracer_enabled

# cat stack_max_size
2928

 # cat stack_trace
        Depth    Size   Location    (18 entries)
        -----    ----   --------
  0)     2928     224   update_sd_lb_stats+0xbc/0x4ac
  1)     2704     160   find_busiest_group+0x31/0x1f1
  2)     2544     256   load_balance+0xd9/0x662
  3)     2288      80   idle_balance+0xbb/0x130
  4)     2208     128   __schedule+0x26e/0x5b9
  5)     2080      16   schedule+0x64/0x66
  6)     2064     128   schedule_timeout+0x34/0xe0
  7)     1936     112   wait_for_common+0x97/0xf1
  8)     1824      16   wait_for_completion+0x1d/0x1f
  9)     1808     128   flush_work+0xfe/0x119
 10)     1680      16   tty_flush_to_ldisc+0x1e/0x20
 11)     1664      48   input_available_p+0x1d/0x5c
 12)     1616      48   n_tty_poll+0x6d/0x134
 13)     1568      64   tty_poll+0x64/0x7f
 14)     1504     880   do_select+0x31e/0x511
 15)      624     400   core_sys_select+0x177/0x216
 16)      224      96   sys_select+0x91/0xb9
 17)      128     128   system_call_fastpath+0x16/0x1b
-
printk_formats
用于外部工具读取二进制的buffer数据,不常用,略。
-
saved_cmdlines
-
saved_cmdlines_size
-
saved_tgids
saved_cmdlines 显示当前tracing到的所有执行程序的pid和程序名.
saved_cmdlines_size 用来设置最多显示多少条,默认是128
save_tgids记录所有的pid和tigd对。
root:/sys/kernel/debug/tracing# cat saved_cmdlines
14497 awk
14498 hobot-log
14499 hobot-log
14500 awk
1062 tsn_worker
2012 stressapptest
2052 stressapptest
2049 stressapptest
14501 sleep
2046 stressapptest
12 watchdog/0
15 watchdog/1
2050 stressapptest
2060 stressapptest

root:/sys/kernel/debug/tracing# echo 1 > options/record-tgid
root:/sys/kernel/debug/tracing# cat saved_tgids
7 7
8 8
9 9
11 11
12 12
...
28 28
62 62
994 994
996 996
1062 1062
1099 1099
...
2058 2012
...
2097 2097
13090 13090
18191 18191
...
22737 22737
22738 22738
2.10 Trigger
用一个事件trigger一个命令(command)
可以trigger如下command:
-
enable_event/disable_event
-
stacktrace
-
snapshot
-
traceon/traceoff
-
hist
# echo 'command[:count] [if filter]' > trigger

For example, the following trigger causes kmalloc events to be
 traced when a read system call is entered, and the :1 at the end
 specifies that this enablement happens only once:

 # echo 'enable_event:kmem:kmalloc:1' > \
     /sys/kernel/debug/tracing/events/syscalls/sys_enter_read/trigger

For example, the following trigger dumps a stacktrace every time the
kmalloc tracepoint is hit:
# echo 'stacktrace' > \
      /sys/kernel/debug/tracing/events/kmem/kmalloc/trigger
2.10 Hlist
hist功能很强大,通过trigger触发,可以提供强大的统计功能
# echo 'hist:key=id.syscall,common_pid.execname:val=hitcount:sort=id,hitcount if id == 16' > \
       /sys/kernel/debug/tracing/events/raw_syscalls/sys_enter/trigger

# cat /sys/kernel/debug/tracing/events/raw_syscalls/sys_enter/hist
# trigger info: hist:keys=id.syscall,common_pid.execname:vals=hitcount:sort=id.syscall,hitcount:size=2048 if id == 16 [active]

{ id: sys_ioctl                     [ 16], common_pid: gmain           [      2769] } hitcount:          1
{ id: sys_ioctl                     [ 16], common_pid: evolution-addre [      8571] } hitcount:          1
{ id: sys_ioctl                     [ 16], common_pid: gmain           [      3003] } hitcount:          1
{ id: sys_ioctl                     [ 16], common_pid: gmain           [      2781] } hitcount:          1
{ id: sys_ioctl                     [ 16], common_pid: gmain           [      2829] } hitcount:          1
{ id: sys_ioctl                     [ 16], common_pid: bash            [      8726] } hitcount:          1
{ id: sys_ioctl                     [ 16], common_pid: bash            [      8508] } hitcount:          1
{ id: sys_ioctl                     [ 16], common_pid: gmain           [      2970] } hitcount:          1
{ id: sys_ioctl                     [ 16], common_pid: gmain           [      2768] } hitcount:          1
.
.
.
{ id: sys_ioctl                     [ 16], common_pid: pool            [      8559] } hitcount:         45
{ id: sys_ioctl                     [ 16], common_pid: pool            [      8555] } hitcount:         48
{ id: sys_ioctl                     [ 16], common_pid: pool            [      8551] } hitcount:         48
{ id: sys_ioctl                     [ 16], common_pid: avahi-daemon    [       896] } hitcount:         66
{ id: sys_ioctl                     [ 16], common_pid: Xorg            [      1267] } hitcount:      26674
{ id: sys_ioctl                     [ 16], common_pid: compiz          [      2994] } hitcount:      73443

Totals:
    Hits: 101162
    Entries: 103
    Dropped: 0

The above output shows that 'compiz' and 'Xorg' are far and away
the heaviest ioctl callers (which might lead to questions about
whether they really need to be making all those calls and to
possible avenues for further investigation.)
3. 前端工具
除了通过tracefs设置ftrace以外,还可以使用trace-cmd来设置。trace-cmd可以简化命令,生成trace.dat文件,并提供给kernelShark等UI工具解析,实现trace 可视化。
下载编译ARM64 trace-cmd方法
git clone [https://github.com/rostedt/trace-cmd.git](https://github.com/rostedt/trace-cmd.git)
export CROSS_COMPILE=aarch64-linux-gnu-
export ARCH=arm64
make
源码的Documentation目录有trace-cmd和kernelShark的帮助文档。
3.1 trace-cmd
root:/userdata# ./trace-cmd record -e hbpvt -e sched -e irq
/sys/kernel/debug/tracing/events/hbpvt/filter
/sys/kernel/debug/tracing/events/*/hbpvt/filter
/sys/kernel/debug/tracing/events/sched/filter
/sys/kernel/debug/tracing/events/*/sched/filter
/sys/kernel/debug/tracing/events/irq/filter
/sys/kernel/debug/tracing/events/*/irq/filter
Hit Ctrl^C to stop recording
^CKernel buffer statistics:
  Note: "entries" are the entries left in the kernel ring buffer and are not
        recorded in the trace data. They should all be zero.

......

CPU0 data recorded at offset=0x3bf000
    1646592 bytes in size
CPU1 data recorded at offset=0x551000
    122880 bytes in size
CPU2 data recorded at offset=0x56f000
    69632 bytes in size
CPU3 data recorded at offset=0x580000
    860160 bytes in size

root:/userdata# ls trace.dat -l
-rw-r--r--    1 root     root       6627328 Jan  1 08:06 trace.dat

root:/userdata# ./trace-cmd  report
version = 6
cpus=4
       trace-cmd-8484  [003]   391.101843: sched_stat_runtime:   comm=trace-cmd pid=8484 runtime=274667 [ns] vruntime=216201549 [ns]
       trace-cmd-8484  [003]   391.101857: sched_switch:         prev_comm=trace-cmd prev_pid=8484 prev_prio=120 prev_state=D ==> next_comm=trace-cmd next_pid=8526 next_prio=120
       trace-cmd-8524  [002]   391.101862: sched_stat_runtime:   comm=trace-cmd pid=8524 runtime=1816750 [ns] vruntime=447143972 [ns]
       trace-cmd-8524  [002]   391.101883: sched_switch:         prev_comm=trace-cmd prev_pid=8524 prev_prio=120 prev_state=D ==> next_comm=swapper/2 next_pid=0 next_prio=120
       trace-cmd-8525  [000]   391.102127: irq_handler_entry:    irq=10 name=hobot-uart0
       trace-cmd-8525  [000]   391.102140: irq_handler_exit:     irq=10 ret=handled
       trace-cmd-8525  [000]   391.102148: sched_waking:         comm=trace-cmd pid=8523 prio=120 target_cpu=001
       trace-cmd-8525  [000]   391.102161: sched_wakeup:         comm=trace-cmd pid=8523 prio=120 target_cpu=001
       trace-cmd-8525  [000]   391.102166: irq_handler_entry:    irq=10 name=hobot-uart0
          <idle>-0     [001]   391.102166: sched_switch:         prev_comm=swapper/1 prev_pid=0 prev_prio=120 prev_state=S ==> next_comm=trace-cmd next_pid=8523 next_prio=120
       trace-cmd-8525  [000]   391.102170: irq_handler_exit:     irq=10 ret=handled
       trace-cmd-8523  [001]   391.102174: sched_waking:         comm=trace-cmd pid=8524 prio=120 target_cpu=002
       trace-cmd-8523  [001]   391.102183: sched_wakeup:         comm=trace-cmd pid=8524 prio=120 target_cpu=002
          <idle>-0     [002]   391.102188: sched_switch:         prev_comm=swapper/2 prev_pid=0 prev_prio=120 prev_state=S ==> next_comm=trace-cmd next_pid=8524 next_prio=120
       trace-cmd-8523  [001]   391.102206: sched_stat_runtime:   comm=trace-cmd pid=8523 runtime=36749 [ns] vruntime=358754408 [ns]
       trace-cmd-8524  [002]   391.102207: sched_stat_runtime:   comm=trace-cmd pid=8524 runtime=28458 [ns] vruntime=447172430 [ns]
       trace-cmd-8523  [001]   391.102212: sched_switch:         prev_comm=trace-cmd prev_pid=8523 prev_prio=120 prev_state=D ==> next_comm=swapper/1 next_pid=0 next_prio=120
       trace-cmd-8524  [002]   391.102212: sched_switch:         prev_comm=trace-cmd prev_pid=8524 prev_prio=120 prev_state=D ==> next_comm=swapper/2 next_pid=0 next_prio=120
       trace-cmd-8525  [000]   391.102244: sched_stat_runtime:   comm=trace-cmd pid=8525 runtime=480585 [ns] vruntime=393791861 [ns]
       trace-cmd-8525  [000]   391.102251: sched_switch:         prev_comm=trace-cmd prev_pid=8525 prev_prio=120 prev_state=D ==> next_comm=swapper/0 next_pid=0 next_prio=120
       trace-cmd-8526  [003]   391.102671: irq_handler_entry:    irq=3 name=arch_timer
       trace-cmd-8526  [003]   391.102679: sched_waking:         comm=tsn_worker pid=1043 prio=89 target_cpu=000
       trace-cmd-8526  [003]   391.102687: sched_wakeup:         comm=tsn_worker pid=1043 prio=89 target_cpu=000
       trace-cmd-8526  [003]   391.102693: irq_handler_exit:     irq=3 ret=handled
          <idle>-0     [000]   391.102693: sched_switch:         prev_comm=swapper/0 prev_pid=0 prev_prio=120 prev_state=S ==> next_comm=tsn_worker next_pid=1043 next_prio=89
      tsn_worker-1043  [000]   391.102706: sched_switch:         prev_comm=tsn_worker prev_pid=1043 prev_prio=89 prev_state=D ==> next_comm=swapper/0 next_pid=0 next_prio=120
       trace-cmd-8526  [003]   391.102923: sched_stat_runtime:   comm=trace-cmd pid=8526 runtime=1051791 [ns] vruntime=225938915 [ns]
       trace-cmd-8526  [003]   391.102932: sched_switch:         prev_comm=trace-cmd prev_pid=8526 prev_prio=120 prev_state=D ==> next_comm=swapper/3 next_pid=0 next_prio=120
          <idle>-0     [001]   391.103063: irq_handler_entry:    irq=3 name=arch_timer
          <idle>-0     [000]   391.103063: irq_handler_entry:    irq=3 name=arch_timer
          <idle>-0     [002]   391.103063: irq_handler_entry:    irq=3 name=arch_timer
          <idle>-0     [003]   391.103063: irq_handler_entry:    irq=3 name=arch_timer
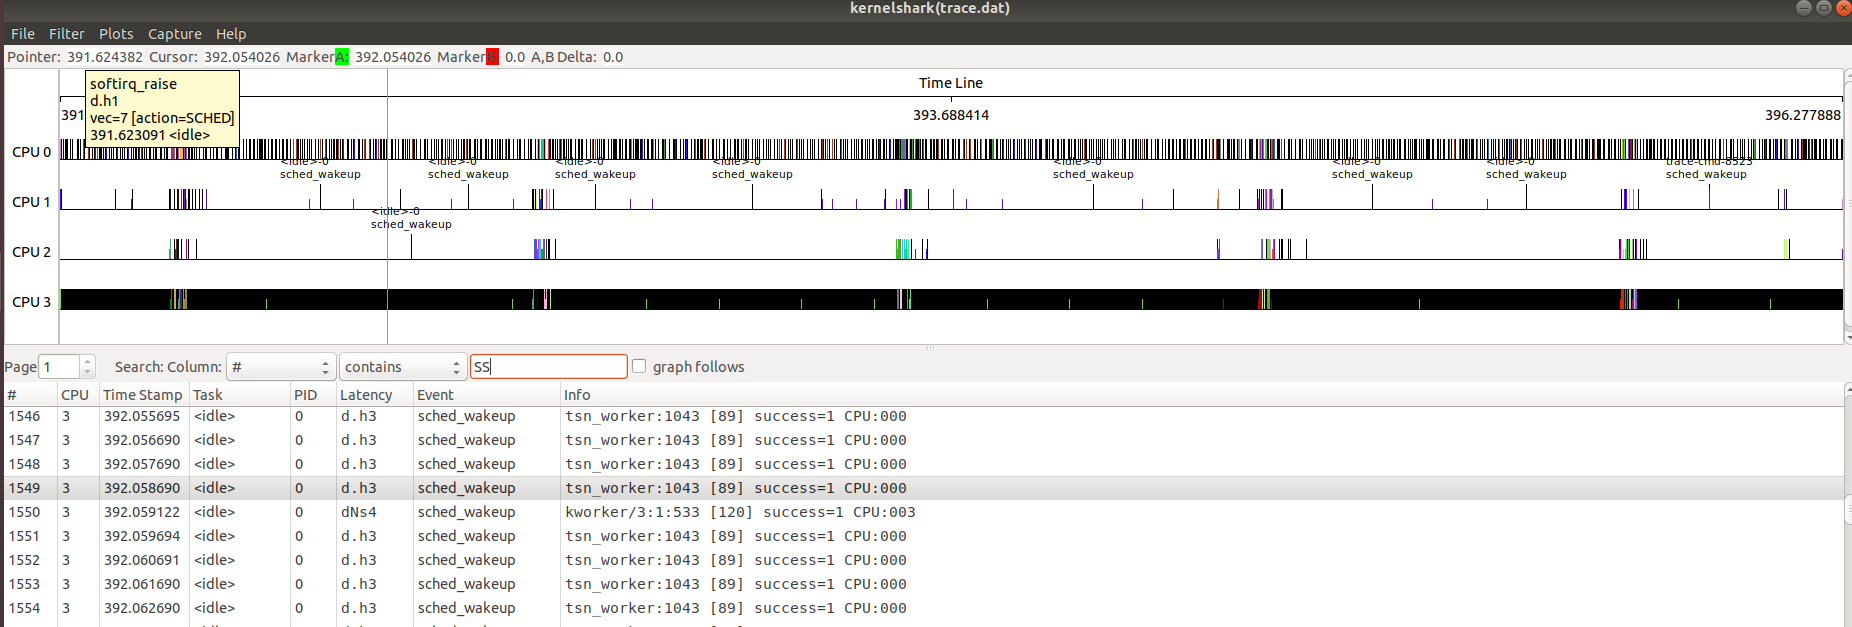
3.2 kernelShark
可以在板子上使用trace-cmd record 记录事件,把得到的trace.data放到linux 桌面系统,用kernelshark打开,看到图形化的信息
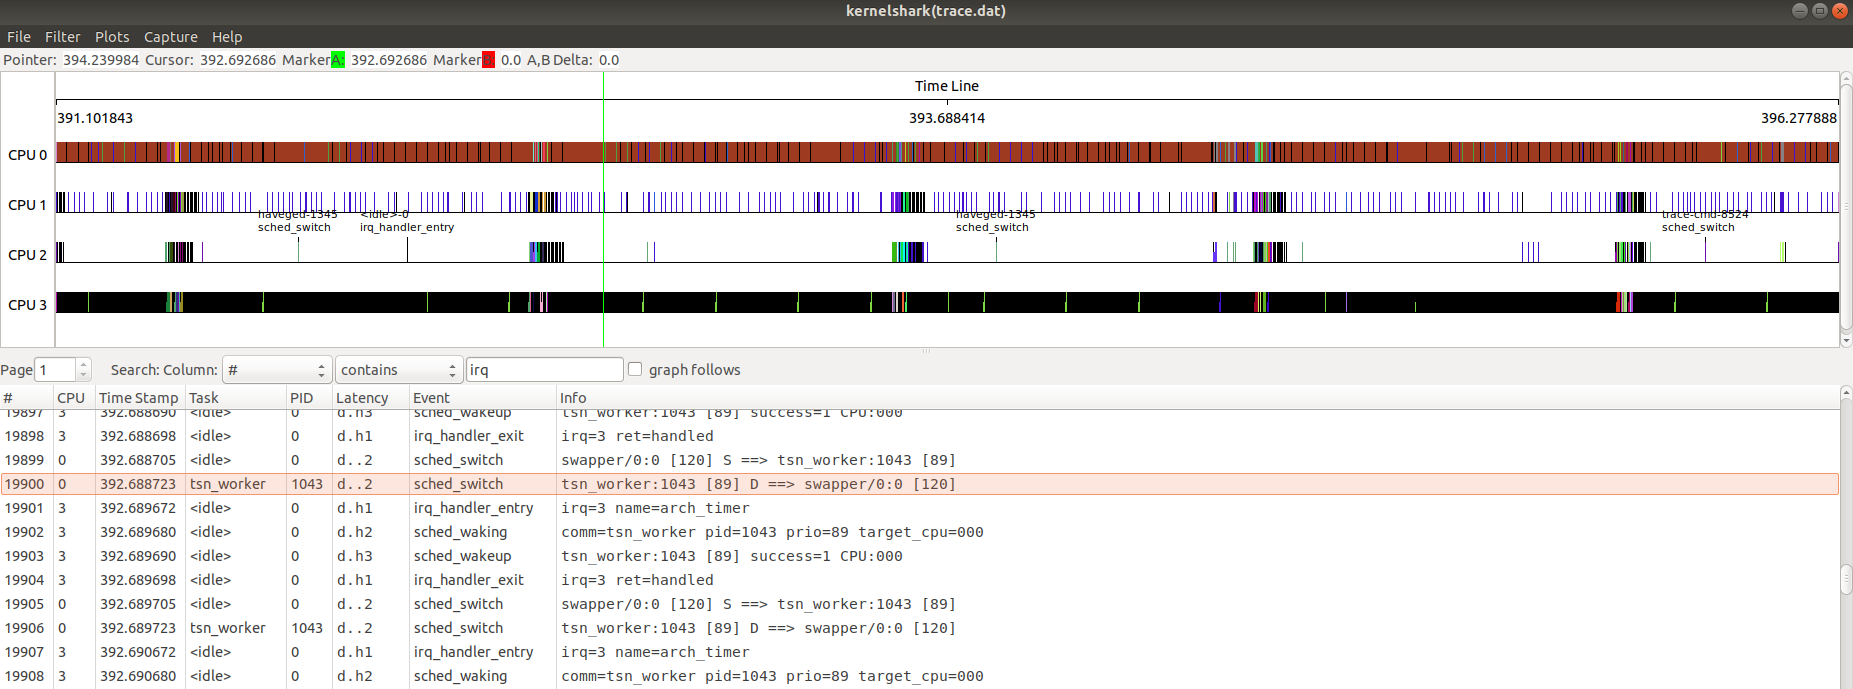
过滤只显示sched_wakeup 事件:
— End—
文章标题:Ftrace的配置和使用
本文作者:hpyu
本文链接:https://www.cnblogs.com/hpyu/articles/14348151.html
欢迎转载,请注明原文链接

 浙公网安备 33010602011771号