1.2.1 在同一个图形界面上画出如下三个函数的图形并进行标注 y=chx y=shx y=(1/2)e^x2.2.2 画出函数图形3.2.3 在同一个图形界面中分别画出6条曲线 y=kx^2+2k k=1,2,3...4.2.4 把屏幕开成2行3列6个子窗口,每个子窗口画一条曲线,画出曲线y=kx^2+2k,k=1,2,3...65.2.5 分别画出下列二次曲面6.2.6 某区域43.65km*58.2km的高程数据,画出该区域的三维表面图和等高线图,在A(30,0)和B(43,30)(单位:km)点处建立了两个基地,在等高线图上标注出这两个点,并求该区域地表面积的近似值7.2.7 先判断下列线性方程组解的情况,然后求对应的唯一解、最小二乘解或最小范数解8.2.8 求解下列线性方程组 4x1+x2=1,x1+4x2+x3=2,x2+4x3+x4=3,......,x998+4x999+x1000=999,x999+4x1000=10009.2.9 求下列方程组的符号解和数值解10.2.10 某容器内侧是由曲线x^2+y^2=4y(1<=y<=3)与x^2+y^2=4(y<=1)绕y轴旋转一周而形成的曲面,求容器的体积,求至少做的功11.2.11 已知f(x)=(|x+1|-|x-1|)/2+sinx,g(x)=(|x+3|-|x-3|)/2+cosx,求下列方程组的解 2x1=3f(y1)+4g(y2)-1 3x2=2f(y1)+6g(y2)-2 y1=f(x1)+3g(x2)-3 5y2=4f(x1)+g(x2)-1 python12.2.12 求下列矩阵的特征值和特征向量的数值解和符号解 (-1 1 0 -4 3 0 1 0 2)的3*3矩阵13.2.13 已知f(x)=(|x+1|-|x-1|)/2+sinx,g(x)=(|x+3|-|x-3|)/2+cosx,求下列超定方程组的最小二乘解14.3.2 求下列差分方程的解 X(n+2)-X(n+1)-2X(n)=0 X(0)=X(1)=-215.3.3 文章影响力评价问题16.4.3 求4.3节模型二的解17.4.4 美佳公司计划制造i Ⅱ两种家电产品18.5.4 5.519.5.720.6.1 用python代码绘制以下图形21.6.222.6.3 6.423.6.5 已知有6个村子,相互间道路的距离如图所示,拟合建一所小学,现计划建造一所医院和一所小学,问医院应该建在哪个村庄才能使得最远村庄的人到医院看病所走的路最短?小学应该建在哪个村庄使得所有学生上学走的总路程最短?24.6.6 1队战胜了2、4、5、6队,输给了3队;2队战胜了4、5、6队,输给了1、3队;3队战胜了1、2、4队,输给了5、6队;4队战胜了5、6队,输给了1、2、3队;5队战胜了3、6队,输给了1、2、4队;6队战胜了3队,输给了1、2、4、5队。(1)利用竞赛图的适当方法,给出6支球队的一个排名顺序,(2)利用pagerank算法,再次给出6支球队的排名顺序25.7.1 在区间[0,10]上等间距取1000个点Xi(i为下标,i=1,2,3,...,1000),并计算在这些点Xi处函数g(x)=((3x^2+4x+6)sinx)/(x^2+8x+6)的函数值yi(i为下标),利用观测点(Xi,Yi)(i=1,2,3,...,1000),求三次样条插值函数h(x),并求积分g(x)从0到10和h(x)从0到1026.7.3 已知当温度T=[700,720,740,760,780]时,过热蒸汽体积的变化为V=[0.0977,0.1218,0.1406,0.1551,0.1664],分别采用线性插值和三次样条插值求解T=750,770时的体积变化,并在一个图形界面中画出线性插值函数和三次样条插值函数
27.7.4 考虑矩形区域x∈[-3,3],y∈[-4,4]上的函数f(x,y)=(x^2-2x)e^(-x^2-y^2-xy),利用随机生成函数uniform随机生成该矩形内的散乱点,然后利用griddata函数进行插值处理,并作出插值结果图形28.7.7 g(x)=(10a)/(10b+(a-10b)e^(asinx)),取a=1.1,b=0.01,计算x=1,2,...,20时,g(x)对应的函数值,把这样得到的数据作为模拟观测值,记作(xi,yi)(其中i为x,y的下标),i=1,2,...,20。用curve_fit拟合函数g(x)。用leastsq拟合函数g(x)。用least_squares拟合函数g(x)29.7.10 已知一组观测数据,如表中7.17.excel(表中第一列为x的值,第二列为y的值)。试用插值方法绘制出x属于-2到4.9区间内的曲线,并比较各种插值算法的优劣。试用多项式拟合表中数据,选择一个能较好拟合数据点的多项式的阶式,给出相应多项式的系数和剩余标准差。若表中数据满足正态分布函数,试用最小二乘法非线性拟合方法求出分布参数的值,并利用所求参数值绘制拟合曲线,观察拟合效果。30.8.4 求微分方程组的数值解 x'=-x^3-y,x(0)=1,y'=x-y^3,y(0)=0.5,0<=t<=30,要求画出x(t)和y(t)的解曲线图形,再相平面上画出轨线31.8.5 求微分方程组(竖直加热板的自然对流)的数值解。(d^3f)/(dm^3)+3f(d^f)/(dm^2)-2((df)/(dm))^2+T=0,(d^2T)/(dm^2)+2.1f(dT)/(dm)=0,已知当m=0时,f=0,(df)/(dm)=0,(d^2f)/(dm^2)=0.68,T=1,(dT)/(dm)=-0.5。要求在[0,10]区间上,画出f(a)、T(a)的解曲线32.8.8 最优捕鱼策略33.8.9 某家庭考虑购买某位置住宅公寓,总价为60万元,按开发商要求至少需首付20万元,剩余款项可申请银行贷款,假设贷款期限为30年,月利率为0.36%,建立模型预测等额还款时,月换款额时多少?34.9.2 车间生产滚珠35.9.3 在7个不同实验室中测量某种扑尔敏药片的扑尔敏有效含量(以mg计),得到结果如表格(读取外部表格excel文件,第一行为实验室Lab1到Lab7,每一列下面为有效含量)。画出各实验室测量结果的箱线图,设各样本分布来自正态总体N(μi,σ^2)i为μ的下标,i=1,2,...,7,各样本相互独立,试取显著水平α=0.05检验各实验室测量的扑尔敏的有效含量的均值是否有显著差异36.9.5 某集团为研究商品销售点所在的地理位置、销售点处的广告、销售点的装横这3个因素对商品的影响度,选了3个位置,2种广告形式,2种装横档次在4个城市进行了搭配实验,如表中所示,试在显著水平0.05下,检验不同地理位置、不同广告、不同装横下的销售量是否有显著差异? import numpy as np
import matplotlib.pyplot as plt
from scipy.interpolate import interp1d, CubicSpline
T = np.array([700, 720, 740, 760, 780])
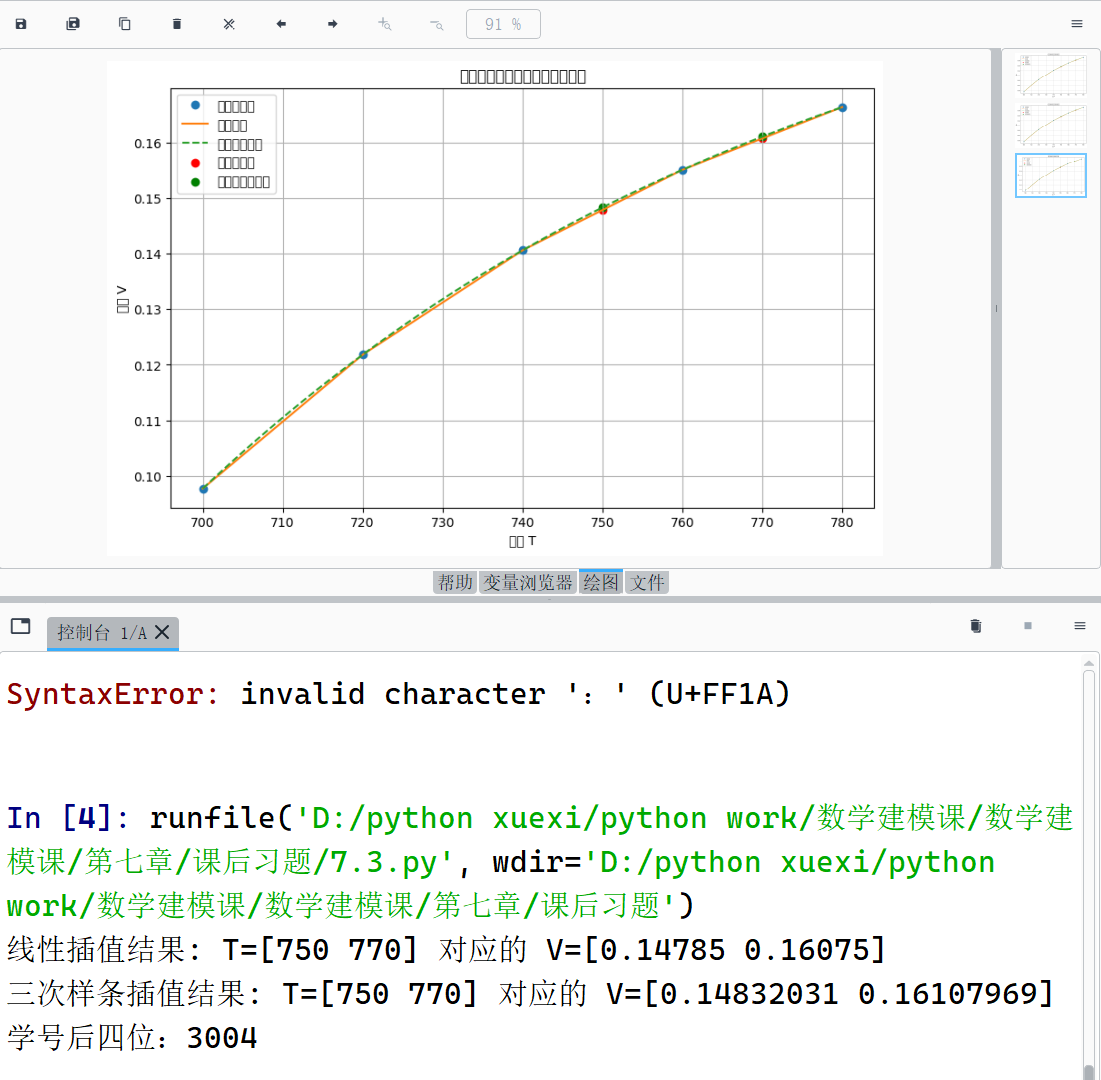
V = np.array([0.0977, 0.1218, 0.1406, 0.1551, 0.1664])
T_interp = np.array([750, 770])
f_linear = interp1d(T, V, kind='linear')
V_linear_interp = f_linear(T_interp)
cs = CubicSpline(T, V)
V_cubic_interp = cs(T_interp)
print(f"线性插值结果: T={T_interp} 对应的 V={V_linear_interp}")
print(f"三次样条插值结果: T={T_interp} 对应的 V={V_cubic_interp}")
print("学号后四位:3004")
x = np.linspace(700, 780, 400)
plt.figure(figsize=(10, 6))
plt.plot(T, V, 'o', label='原始数据点')
plt.plot(x, f_linear(x), '-', label='线性插值')
plt.plot(x, cs(x), '--', label='三次样条插值')
plt.scatter(T_interp, V_linear_interp, color='red', label='线性插值点')
plt.scatter(T_interp, V_cubic_interp, color='green', label='三次样条插值点')
plt.xlabel('温度 T')
plt.ylabel('体积 V')
plt.title('过热蒸汽体积随温度变化的插值')
plt.legend()
plt.grid(True)
plt.show()


【推荐】国内首个AI IDE,深度理解中文开发场景,立即下载体验Trae
【推荐】编程新体验,更懂你的AI,立即体验豆包MarsCode编程助手
【推荐】抖音旗下AI助手豆包,你的智能百科全书,全免费不限次数
【推荐】轻量又高性能的 SSH 工具 IShell:AI 加持,快人一步
· winform 绘制太阳,地球,月球 运作规律
· AI与.NET技术实操系列(五):向量存储与相似性搜索在 .NET 中的实现
· 超详细:普通电脑也行Windows部署deepseek R1训练数据并当服务器共享给他人
· 【硬核科普】Trae如何「偷看」你的代码?零基础破解AI编程运行原理
· 上周热点回顾(3.3-3.9)