任务管理器里的GPU指标
https://devblogs.microsoft.com/directx/gpus-in-the-task-manager/
 Explore the world from your desktop—one photo at a time. Get the Bing Wallpaper app today.Bring your desktop to life with daily backgrounds when you get Bing Wallpaper
GPUs in the task manager
Bryan
The below posting is from Steve Pronovost, our lead engineer responsible for the GPU scheduler and memory manager.
GPUs in the Task Manager
We’re excited to introduce support for GPU performance data in the Task Manager. This is one of the features you have often requested, and we listened. The GPU is finally making its debut in this venerable performance tool. To see this feature right away, you can join the Windows Insider Program. Or, you can wait for the Windows Fall Creator’s Update.
To understand all the GPU performance data, its helpful to know how Windows uses a GPUs. This blog dives into these details and explains how the Task Manager’s GPU performance data comes alive. This blog is going to be a bit long, but we hope you enjoy it nonetheless.
System Requirements
In Windows, the GPU is exposed through the Windows Display Driver Model (WDDM). At the heart of WDDM is the Graphics Kernel, which is responsible for abstracting, managing, and sharing the GPU among all running processes (each application has one or more processes). The Graphics Kernel includes a GPU scheduler (VidSch) as well as a video memory manager (VidMm). VidSch is responsible for scheduling the various engines of the GPU to processes wanting to use them and to arbitrate and prioritize access among them. VidMm is responsible for managing all memory used by the GPU, including both VRAM (the memory on your graphics card) as well as pages of main DRAM (system memory) directly accessed by the GPU. An instance of VidMm and VidSch is instantiated for each GPU in your system.
The data in the Task Manager is gathered directly from VidSch and VidMm. As such, performance data for the GPU is available no matter what API is being used, whether it be Microsoft DirectX API, OpenGL, OpenCL, Vulkan or even proprietary API such as AMD’s Mantle or Nvidia’s CUDA. Further, because VidMm and VidSch are the actual agents making decisions about using GPU resources, the data in the Task Manager will be more accurate than many other utilities, which often do their best to make intelligent guesses since they do not have access to the actual data.
The Task Manager’s GPU performance data requires a GPU driver that supports WDDM version 2.0 or above. WDDMv2 was introduced with the original release of Windows 10 and is supported by roughly 70% of the Windows 10 population. If you are unsure of the WDDM version your GPU driver is using, you may use the dxdiag utility that ships as part of windows to find out. To launch dxdiag open the start menu and simply type dxdiag.exe. Look under the Display tab, in the Drivers section for the Driver Model. Unfortunately, if you are running on an older WDDMv1.x GPU, the Task Manager will not be displaying GPU data for you.
Performance Tab
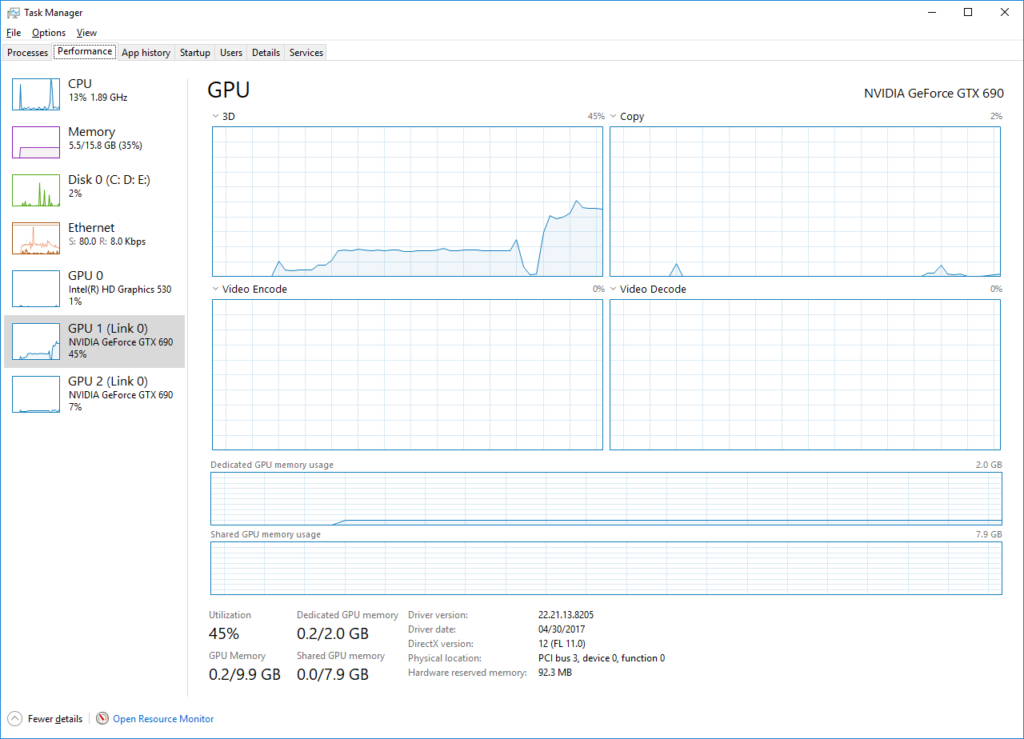
Under the Performance tab you’ll find performance data, aggregated across all processes, for all of your WDDMv2 capable GPUs.
GPUs and Links
On the left panel, you’ll see the list of GPUs in your system. The GPU # is a Task Manager concept and used in other parts of the Task Manager UI to reference specific GPU in a concise way. So instead of having to say Intel(R) HD Graphics 530 to reference the Intel GPU in the above screenshot, we can simply say GPU 0. When multiple GPUs are present, they are ordered by their physical location (PCI bus/device/function).
Windows supports linking multiple GPUs together to create a larger and more powerful logical GPU. Linked GPUs share a single instance of VidMm and VidSch, and as a result, can cooperate very closely, including reading and writing to each other’s VRAM. You’ll probably be more familiar with our partners’ commercial name for linking, namely Nvidia SLI and AMD Crossfire. When GPUs are linked together, the Task Manager will assign a Link # for each link and identify the GPUs which are part of it. Task Manager lets you inspect the state of each physical GPU in a link allowing you to observe how well your game is taking advantage of each GPU.
GPU Utilization
At the top of the right panel you’ll find utilization information about the various GPU engines.
A GPU engine represents an independent unit of silicon on the GPU that can be scheduled and can operate in parallel with one another. For example, a copy engine may be used to transfer data around while a 3D engine is used for 3D rendering. While the 3D engine can also be used to move data around, simple data transfers can be offloaded to the copy engine, allowing the 3D engine to work on more complex tasks, improving overall performance. In this case both the copy engine and the 3D engine would operate in parallel.
VidSch is responsible for arbitrating, prioritizing and scheduling each of these GPU engines across the various processes wanting to use them.
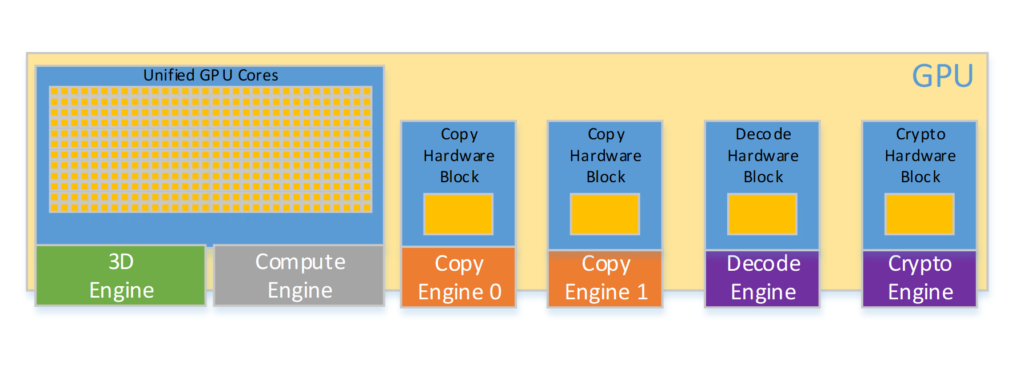
It’s important to distinguish GPU engines from GPU cores. GPU engines are made up of GPU cores. The 3D engine, for instance, might have 1000s of cores, but these cores are grouped together in an entity called an engine and are scheduled as a group. When a process gets a time slice of an engine, it gets to use all of that engine’s underlying cores.
Some GPUs support multiple engines mapping to the same underlying set of cores. While these engines can also be scheduled in parallel, they end up sharing the underlying cores. This is conceptually similar to hyper-threading on the CPU. For example, a 3D engine and a compute engine may in fact be relying on the same set of unified cores. In such a scenario, the cores are either spatially or temporally partitioned between engines when executing.
The figure below illustrates engines and cores of a hypothetical GPU.
By default, the Task Manager will pick 4 engines to be displayed. The Task Manager will pick the engines it thinks are the most interesting. However, you can decide which engine you want to observe by clicking on the engine name and choosing another one from the list of engines exposed by the GPU.
The number of engines and the use of these engines will vary between GPUs. A GPU driver may decide to decode a particular media clip using the video decode engine while another clip, using a different video format, might rely on the compute engine or even a combination of multiple engines. Using the new Task Manager, you can run a workload on the GPU then observe which engines gets to process it.
In the left pane under the GPU name and at the bottom of the right pane, you’ll notice an aggregated utilization percentage for the GPU. Here we had a few different choices on how we could aggregate utilization across engines. The average utilization across engines felt misleading since a GPU with 10 engines, for example, running a game fully saturating the 3D engine, would have aggregated to a 10% overall utilization! This is definitely not what gamers want to see. We could also have picked the 3D Engine to represent the GPU as a whole since it is typically the most prominent and used engine, but this could also have misled users. For example, playing a video under some circumstances may not use the 3D engine at all in which case the aggregated utilization on the GPU would have been reported as 0% while the video is playing! Instead we opted to pick the percentage utilization of the busiest engine as a representative of the overall GPU usage.
Video Memory
Below the engines graphs are the video memory utilization graphs and summary. Video memory is broken into two big categories: dedicated and shared.
Dedicated memory represents memory that is exclusively reserved for use by the GPU and is managed by VidMm. On discrete GPUs this is your VRAM, the memory that sits on your graphics card. Â Â On integrated GPUs, this is the amount of system memory that is reserved for graphics. Many integrated GPU avoid reserving memory for exclusive graphics use and instead opt to rely purely on memory shared with the CPU which is more efficient.
This small amount of driver reserved memory is represented by the Hardware Reserved Memory.
For integrated GPUs, it’s more complicated. Some integrated GPUs will have dedicated memory while others won’t. Some integrated GPUs reserve memory in the firmware (or during driver initialization) from main DRAM. Although this memory is allocated from DRAM shared with the CPU, it is taken away from Windows and out of the control of the Windows memory manager (Mm) and managed exclusively by VidMm. This type of reservation is typically discouraged in favor of shared memory which is more flexible, but some GPUs currently need it.
The amount of dedicated memory under the performance tab represents the number of bytes currently consumed across all processes, unlike many existing utilities which show the memory requested by a process.
Shared memory represents normal system memory that can be used by either the GPU or the CPU. This memory is flexible and can be used in either way, and can even switch back and forth as needed by the user workload. Both discrete and integrated GPUs can make use of shared memory.
Windows has a policy whereby the GPU is only allowed to use half of physical memory at any given instant. This is to ensure that the rest of the system has enough memory to continue operating properly. On a 16GB system the GPU is allowed to use up to 8GB of that DRAM at any instant. It is possible for applications to allocate much more video memory than this. Â As a matter of fact, video memory is fully virtualized on Windows and is only limited by the total system commit limit (i.e. total DRAM installed + size of the page file on disk). VidMm will ensure that the GPU doesn’t go over its half of DRAM budget by locking and releasing DRAM pages dynamically. Similarly, when surfaces aren’t in use, VidMm will release memory pages back to Mm over time, such that they may be repurposed if necessary. The amount of shared memory consumed under the performance tab essentially represents the amount of such shared system memory the GPU is currently consuming against this limit.
Processes Tab
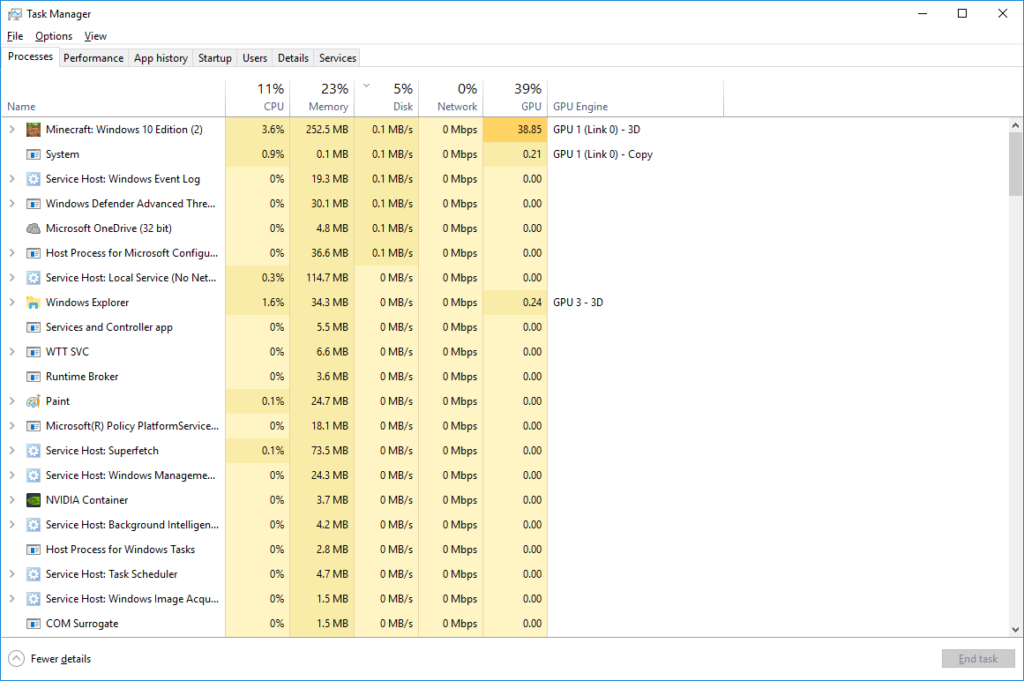
Under the process tab you’ll find an aggregated summary of GPU utilization broken down by processes.
It’s worth discussing how the aggregation works in this view. As we’ve seen previously, a PC can have multiple GPUs and each of these GPU will typically have several engines. Adding a column for each GPU and engine combinations would leads to dozens of new columns on typical PC making the view unwieldy. The performance tab is meant to give a user a quick and simple glance at how his system resources are being utilized across the various running processes so we wanted to keep it clean and simple, while still providing useful information about the GPU.
The solution we decided to go with is to display the utilization of the busiest engine, across all GPUs, for that process as representing its overall GPU utilization. But if that’s all we did, things would still have been confusing. One application might be saturating the 3D engine at 100% while another saturates the video engine at 100%. In this case, both applications would have reported an overall utilization of 100%, which would have been confusing. To address this problem, we added a second column, which indicates which GPU and Engine combination the utilization being shown corresponds to. We would like to hear what you think about this design choice.
Similarly, the utilization summary at the top of the column is the maximum of the utilization across all GPUs. The calculation here is the same as the overall GPU utilization displayed under the performance tab.
Details Tab
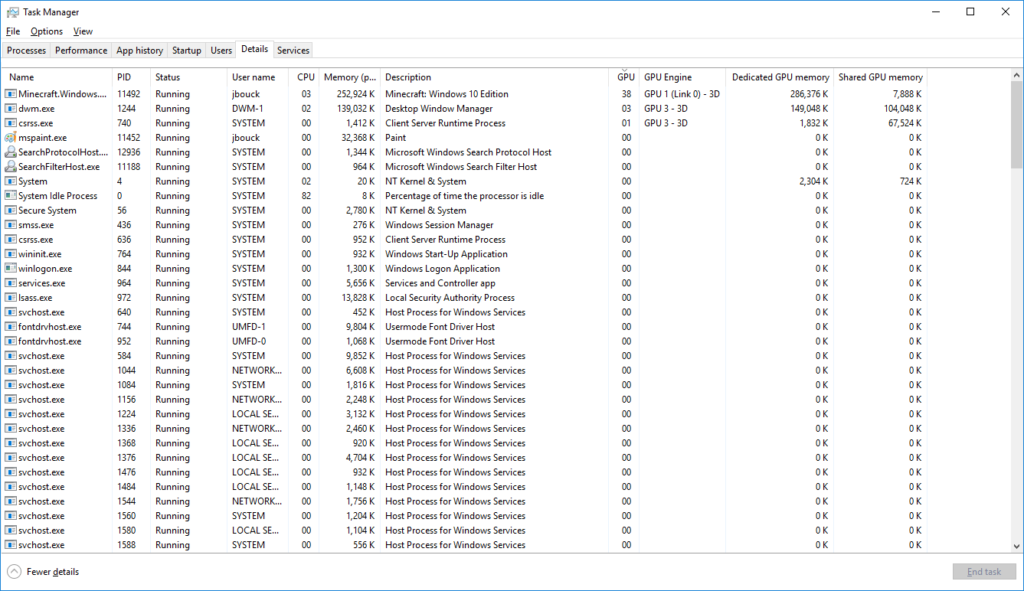
Under the details tab there is no information about the GPU by default. But you can right-click on the column header, choose “Select columns”, and add either GPU utilization counters (the same one as described above) or video memory usage counters.
There are a few things that are important to note about these video memory usage counters. The counters represent the total amount of dedicated and shared video memory currently in used by that process. This includes both private memory (i.e. memory that is used exclusively by that process) as well as cross-process shared memory (i.e. memory that is shared with other processes not to be confused with memory shared between the CPU and the GPU).
As a result of this, adding the memory utilized by each individual process will sum up to an amount of memory larger than that utilized by the GPU since memory shared across processes will be counted multiple times. The per process breakdown is useful to understand how much video memory a particular process is currently using, but to understand how much overall memory is used by a GPU, one should look under the performance tab for a summation that properly takes into account shared memory.
Another interesting consequence of this is that some system processes, in particular dwm.exe and csrss.exe, that share a lot of memory with other processes will appear much larger than they really are. For example, when an application creates a top level window, video memory will be allocated to hold the content of that window. That video memory surface is created by csrss.exe on behalf of the application, possibly mapped into the application process itself and shared with the desktop window manager (dwm.exe) such that the window can be composed onto the desktop. The video memory is allocated only once but is accessible from possibly all three processes and appears against their individual memory utilization. Similarly, application DirectX swapchain or DCOMP visual (XAML) are shared with the desktop compositor. Most of the video memory appearing against these two processes is really the result of an application creating something that is shared with them as they by themselves allocate very little. This is also why you will see these grow as your desktop gets busy, but keep in mind that they aren’t really consuming up all of your resources.
We could have decided to show a per process private memory breakdown instead and ignore shared memory. However, this would have made many applications looks much smaller than they really are since we make significant use of shared memory in Windows. In particular, with universal applications it’s typical for an application to have a complex visual tree that is entirely shared with the desktop compositor as this allows the compositor a smarter and more efficient way of rendering the application only when needed and results in overall better performance for the system. We didn’t think that hiding shared memory was the right answer. We could also have opted to show private+shared for regular processes but only private for csrss.exe and dwm.exe, but that also felt like hiding useful information to power users.
This added complexity is one of the reason we don’t display this information in the default view and reserve this for power users who will know how to find it. In the end, we decided to go with transparency and went with a breakdown that includes both private and cross-process shared memory. This is an area we’re particularly interested in feedback and are looking forward to hearing your thoughts.
Closing thought
We hope you found this information useful and that it will help you get the most out of the new Task Manager GPU performance data.
Rest assured that the team behind this work will be closely monitoring your constructive feedback and suggestions so keep them coming! The best way to provide feedback is through the Feedback Hub. To launch the Feedback Hub use our keyboard shortcut Windows key + f. Submit your feedback (and send us upvotes) under the category Desktop Environment -> Task Manager.


2 comments
Thanks for the information – very useful!
Is there a chance there is a bug in the Dedicated GPU memory column of the “Details” tab?
I have an app that is using Direct X 11 to play a video in a WPF app (using WPF DXInterop) and after running for couple minutes shows ~66 GB of Dedicated GPU Memory used (increases by 7-8MB for each frame displayed) but on the performance tab shows 0.3GB used. I believe that 0.3GB is correct as the GPU in question only has 4GB of RAM.
Details Tab
Performance Tab
Very informative THX!
How can I programmatically sample the GPU utilization from a managed (c#) or native program running on win 10 v1709 or higher?