Lab 10-3
This lab includes a driver and an executable. You can run the executable from anywhere, but in order for the program to work properly, the driver must be placed in the C:\Windows\System32 directory where it was originally found on the victim computer. The executable is Lab10-03.exe, and the driver is Lab10-03.sys.
Questions and Short Answers
-
What does this program do?
A: The user-space program loads the driver and then pops up an advertisement every 30 seconds. The driver hides the process by unlinking the Process Environment Block (PEB) from the system’s linked list.
-
Once this program is running, how do you stop it?
A: Once this program is running, there is no easy way to stop it without rebooting.
-
What does the kernel component do?
A: The kernel component responds to any
DeviceIoControlrequest by unlinking the process that made the request from the linked list of processes in order to hide the process from the user.
Detailed Analysis
We begin with some basic static analysis on the files. When we analyze the driver file, we see the following imports:

The import for IoGetCurrentProcess is the only one that provides much information. (The other imports are simply required by any driver that creates a device that is accessible from user space.) The call to IoGetCurrentProcess tells us that this driver either modifies the running process or requires information about it.
Next, we copy the driver file into C:\Windows\System32 and double-click the executable to run it. We see a pop-up ad, which is the same as the one in Lab 7-2. We now examine what it did to our system. First, we check to see if the service was successfully installed and verify that the malicious .sys file is used as part of the service. Simultaneously, we notice that after about 30 seconds, the program pops up the advertisement again and does so about once every 30 seconds. Opening Task Manager in an effort to terminate the program, we see that the program isn’t listed. And it’s not listed in Process Explorer either.
The program continues to open advertisements, and there’s no easy way to stop it. It’s not in a process listing, so we can’t stop it by killing the process. Nor can we attach a debugger to the process because the program doesn’t show up in the process listing for WinDbg or OllyDbg. At this point, our only choice is to revert to our most recent snapshot or reboot and hope that the program isn’t persistent. It’s not, so a reboot stops it.
Analyzing the Executable in IDA Pro
Now to IDA Pro. Navigating to WinMain and examining the functions it calls, we see the following:
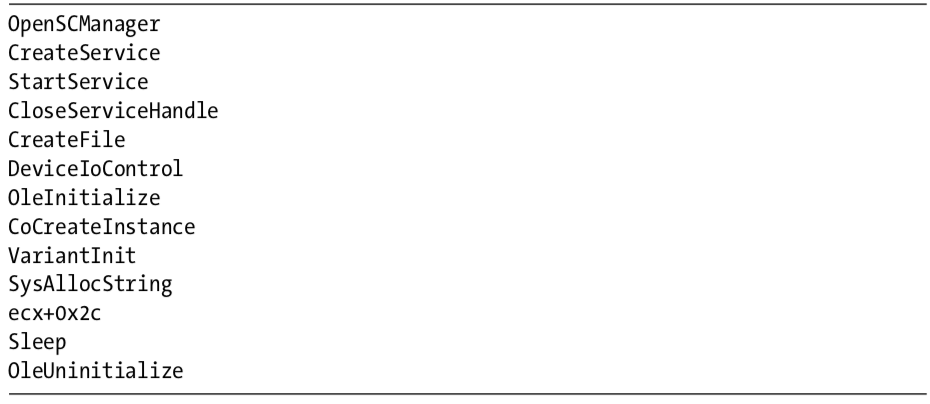
WinMain can be logically broken into two sections. The first section, consisting of OpenSCManager through DeviceIoControl, includes the functions to load and send a request to the kernel driver. The second section consists of the remaining functions, which show the usage of a COM object. At this point, we don’t know the target of the call to ecx+0x2c, but we’ll come back to that later.
Looking at the calls in detail, we see that the program creates a service called Process Helper, which loads the kernel driver C:\Windows\System32\ Lab10-03.sys. It then starts the Process Helper service, which loads Lab10-03.sys into the kernel and opens a handle to \\.\ProcHelper, which opens a handle to the kernel device created by the ProcHelper driver.
We need to look carefully at the call to DeviceIoControl, shown in Listing 10-14L, because the input and output parameters passed as arguments to it will be sent to the kernel code, which we will need to analyze separately.
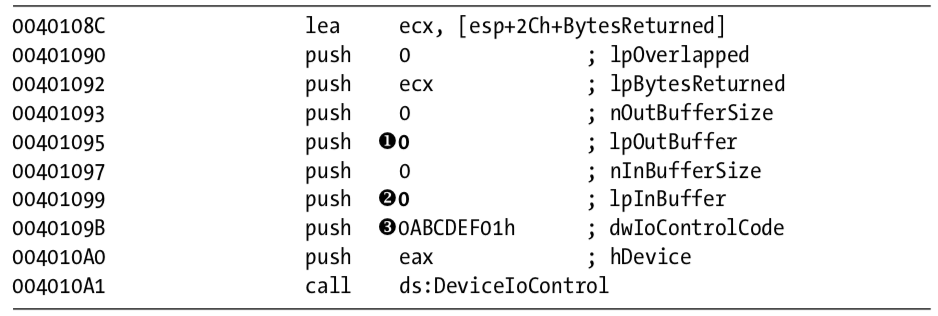
Notice that the call to DeviceIoControl has lpOutBuffer at \({\color{red}1}\) and lpInBuffer at \({\color{red}2}\) set to NULL. This is unusual, and it means that this request sends no information to the kernel driver and that the kernel driver sends no information back. Also notice that the dwIoControlCode of 0xABCDEF01 at \({\color{red}3}\) is passed to the kernel driver. We’ll revisit this when we look at the kernel driver.
The remainder of this file is nearly identical to the COM example in Lab 7-2, except that the call to the navigate function is inside a loop that runs continuously and sleeps for 30 seconds between each call.
Analyzing the Driver
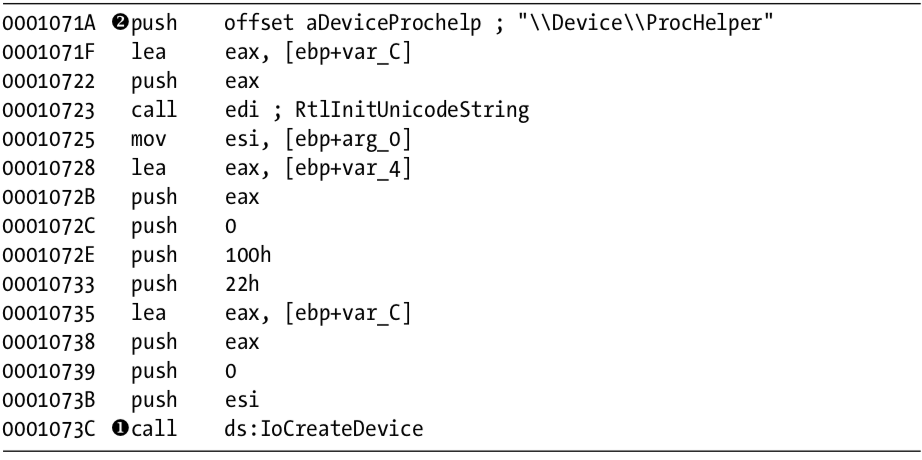
Next, we open the kernel file with IDA Pro. As shown in Listing 10-15L, we see that it calls IoCreateDevice at \({\color{red}1}\) to create a device named \Device\ProcHelper at \({\color{red}2}\) .
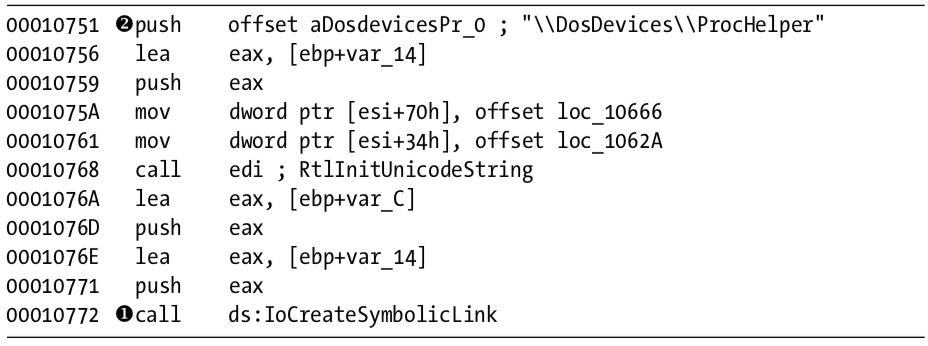
As shown in Listing 10-16L, the function then calls IoCreateSymbolicLink at \({\color{red}1}\) to create a symbolic link named \DosDevices\ProcHelper at \({\color{red}2}\) for the user-space program to access.
Finding the Driver in Memory with WinDbg
We can either run the malware or just start the service to load our kernel driver into memory. We know that the device object is at \Device\ProcHelper, so we start with it. In order to find the function in ProcHelper that is executed, we must find the driver object, which can be done with the !devobj command, as shown in Listing 10-17L. The output of !devobj tells us where the DriverObject at \({\color{red}1}\) is stored.

The DriverObject contains pointers to all of the functions that will be called when a user-space program accesses the device object. The DriverObject is stored in a data structure called DRIVER_OBJECT. We can use the dt command to view the driver object with labels, as shown in Listing 10-18L.

This code contains several function pointers of note. These include DriverInit, the DriverEntry routine we analyzed in IDA Pro, and DriverUnload, which is called when this driver is unloaded. When we look at DriverUnload in IDA Pro, we see that it deletes the symbolic link and the device created by the DriverEntry program.
Analyzing the Functions of the Major Function Table
Next, we examine the major function table, which is often where the most interesting driver code is implemented. Windows XP allows 0x1C possible major function codes, so we view the entries in the major function table using the dd command:

Each entry in the table represents a different type of request that the driver can handle, but as you can see, most of the entries in the table are for the same function at 0X804F354A. All of the entries in the table with the value 0X804F354A represent a request type that the driver does not handle. To verify this, we need to find out what that function does. We could view its disassembly, but because it’s a Windows function, its name should tell us what it does, as shown here:

The function at 0X804F354A is named IopInvalidDeviceRequest, which means that it handles invalid requests that this driver doesn’t handle. The remaining functions from the major function table at offsets 0, 2, and 0xe contain the functionality that we are interested in. Examining wdm.h, we find that offsets of 0, 2, and 0xe store the functions for the Create, Close, and DeviceIoControl functions.
First, we look at the Create and Close functions at offsets 0 and 2 in the major function table. We notice that both entries in the major function table point to the same function (0xF7C26606). Looking at that function, we see that it simply calls IofCompleteRequest and then returns. This tells the OS that the request was successful, but does nothing else. The only remaining function in the major function table is the one that handles DeviceIoControl requests, which is the most interesting.
Looking at the DeviceIoControl function, we see that it manipulates the PEB of the current process. Listing 10-19L shows the code that handles DeviceIoControl.
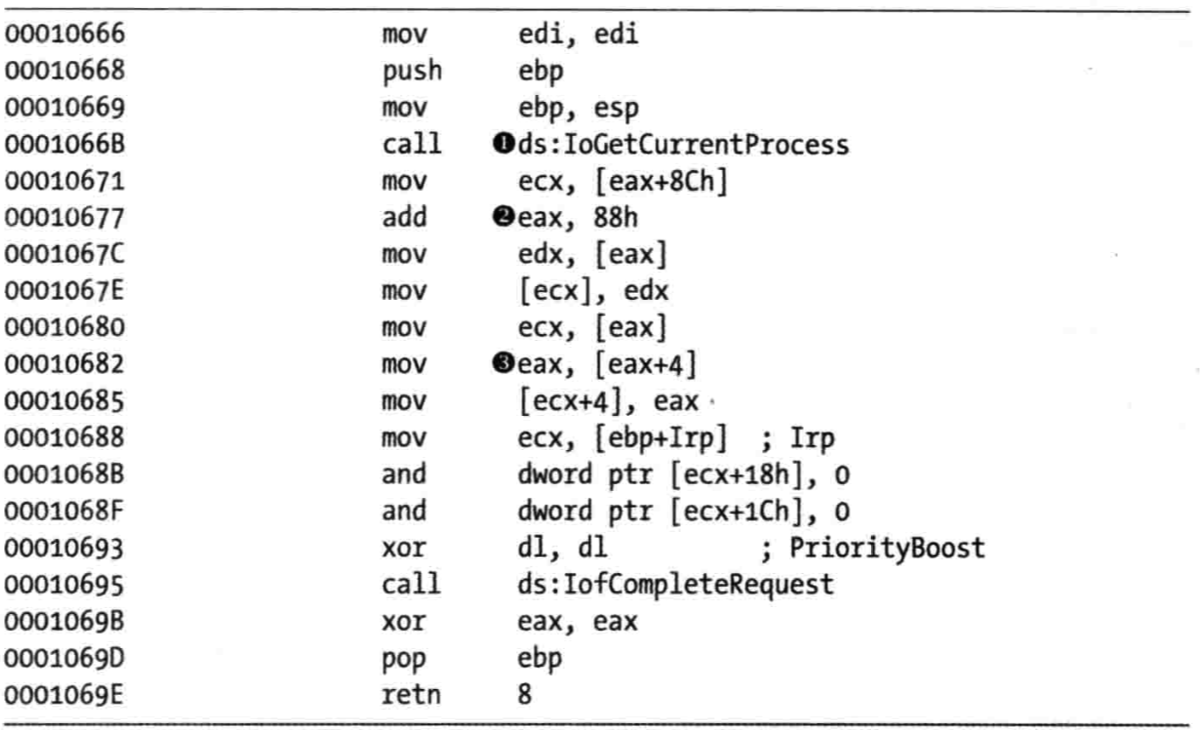
The first thing the DeviceIoControl function does is call IoGetCurrentProcess at \({\color{red}1}\), which returns the EPROCESS structure of the process that issued the call to DeviceIoControl. The function then accesses the data at an offset of 0x88 at \({\color{red}2}\), and then accesses the next DWORD at offset 0x8C at \({\color{red}3}\).
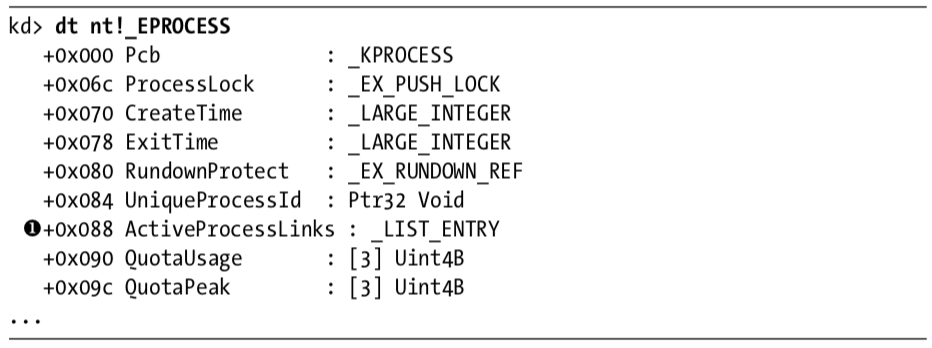
We use the dt command to discover that LIST_ENTRY is stored at offsets 0x88 and 0x8C in the PEB structure, as shown in Listing 10-20L at \({\color{red}1}\).
Now that we know that function is accessing the LIST_ENTRY structure, we look closely at how LIST_ENTRY is being accessed. The LIST_ENTRY structure is a double-linked list with two values: the first is BLINK, which points to the previous entry in the list, and the second is FLINK, which points to the next entry in the list. We see that it is not only reading the LIST_ENTRY structure, but also changing structures, as shown in Listing 10-21L.

The instruction at \({\color{red}1}\) obtains a pointer to the next entry in the list. The instruction at \({\color{red}2}\) obtains a pointer to the previous entry in the list. The instruction at \({\color{red}3}\) overwrites the BLINK pointer of the next entry so that it points to the previous entry. Prior to \({\color{red}3}\), the BLINK pointer of the next entry pointed to the current entry. The instruction at \({\color{red}3}\) overwrites the BLINK pointer so that it skips over the current process. The instructions at \({\color{red}4}\), \({\color{red}5}\), and \({\color{red}6}\) perform the same steps, except to overwrite the FLINK pointer of the previous entry in the list to skip the current entry.
Rather than change the EPROCESS structure of the current process, the code in Listing 10-21L changes the EPROCESS structure of the process in front of it and behind it in the linked list of processes. These six instructions hide the current process by unlinking it from the linked list of loaded processes, as shown in Figure 10-3L.

When the OS is running normally, each process has a pointer to the process before and after it. However, in Figure 10-3L, Process 2 has been hidden by this rootkit. When the OS iterates over the linked list of processes, the hidden process is always skipped.
You might wonder how this process continues to run without any problems, even though it’s not in the OS’s list of processes. To answer this, remember that a process is simply a container for various threads to run inside. The threads are scheduled to execute on the CPU. As long as the threads are still properly accounted for by the OS, they will be scheduled, and the process will continue to run as normal.
Preference
PRACTICAL MALWARE ANALYSIS: KERNEL DEBUGGING WITH WINDBG (LAB 10-03)


 浙公网安备 33010602011771号