

echarts 仪表盘设置不同的颜色
效果
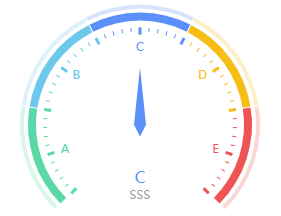
代码:
setGaugeChart() {
    this.agugeChart && this.agugeChart?.dispose && this.agugeChart?.dispose()
    this.agugeChart = echarts.init(this.$refs.agugeChartRef)
    const grades = ['A', 'B', 'C', 'D', 'E']
    const option = {
        series: [
            {
                type: 'gauge',
                z: 2,
                center: ['50%', '60%'],
                radius: 120,
                max: grades.length,
                splitNumber: grades.length,
                pointer: {
                    show: false
                },
                axisTick: {
                    show: false
                },
                axisLine: {
                    lineStyle: {
                        width: 4,
                        color: [
                            [0.2, 'rgba(90, 216, 166, 0.24)'],
                            [0.4, 'rgba(109, 200, 236, 0.24)'],
                            [0.6, 'rgba(91, 143, 249, 0.24)'],
                            [0.8, 'rgba(246, 189, 22, 0.24)'],
                            [1, 'rgba(239, 84, 84, 0.24)']
                        ]
                    }
                },
                axisLabel: {
                    show: false
                },
                splitLine: {
                    distance: -4,
                    length: 4,
                    lineStyle: {
                        color: '#fff',
                        width: 1
                    }
                }
            },
            {
                type: 'gauge',
                z: 3,
                center: ['50%', '60%'],
                radius: 112,
                max: grades.length,
                splitNumber: grades.length,
                pointer: {
                    show: false
                },
                axisTick: {
                    show: false
                },
                axisLine: {
                    lineStyle: {
                        width: 8,
                        color: [
                            [0.2, '#5AD8A6'],
                            [0.4, '#6DC8EC'],
                            [0.6, '#5B8FF9'],
                            [0.8, '#F6BD16'],
                            [1, '#EF5454']
                        ]
                    }
                },
                axisLabel: {
                    show: false
                },
                splitLine: {
                    distance: -8,
                    length: 8,
                    lineStyle: {
                        color: '#fff',
                        width: 1
                    }
                }
            },
            {
                type: 'gauge',
                z: 4,
                center: ['50%', '60%'],
                radius: 104,
                max: grades.length,
                axisLine: {
                    lineStyle: {
                        width: 0,
                        color: [
                            [0.2, '#5AD8A6'],
                            [0.4, '#6DC8EC'],
                            [0.6, '#5B8FF9'],
                            [0.8, '#F6BD16'],
                            [1, '#EF5454']
                        ]
                    }
                },
                axisLabel: {
                    color: 'inherit',
                    distance: 7,
                    formatter: value => {
                        return grades[value - 0.5] || ''
                    }
                },
                axisTick: {
                    length: 4,
                    distance: 7,
                    lineStyle: {
                        color: 'auto'
                    }
                },
                splitLine: {
                    length: 7,
                    distance: 7,
                    lineStyle: {
                        color: 'auto'
                    }
                },
                pointer: {
                    length: '55%',
                    itemStyle: {
                        color: 'auto'
                    }
                },
                data: [
                    {
                        value: 2.5,
                        detail: {
                            offsetCenter: [0, '60%'],
                            formatter: value => {
                                return [`{a|${grades[value - 0.5]}}`, `{b|SSS}`].join('\n')
                            },
                            rich: {
                                a: {
                                    fontSize: 16,
                                    lineHeight: 18
                                },
                                b: {
                                    fontSize: 12,
                                    color: '#999999',
                                    lineHeight: 16
                                }
                            }
                        }
                    }
                ]
            }
        ]
    }
    this.agugeChart.setOption(option)
}
本文来自博客园,作者:hong_li,转载请注明原文链接:https://www.cnblogs.com/hong1/p/18574730


【推荐】国内首个AI IDE,深度理解中文开发场景,立即下载体验Trae
【推荐】编程新体验,更懂你的AI,立即体验豆包MarsCode编程助手
【推荐】抖音旗下AI助手豆包,你的智能百科全书,全免费不限次数
【推荐】轻量又高性能的 SSH 工具 IShell:AI 加持,快人一步
· 无需6万激活码!GitHub神秘组织3小时极速复刻Manus,手把手教你使用OpenManus搭建本
· Manus爆火,是硬核还是营销?
· 终于写完轮子一部分:tcp代理 了,记录一下
· 别再用vector<bool>了!Google高级工程师:这可能是STL最大的设计失误
· 单元测试从入门到精通