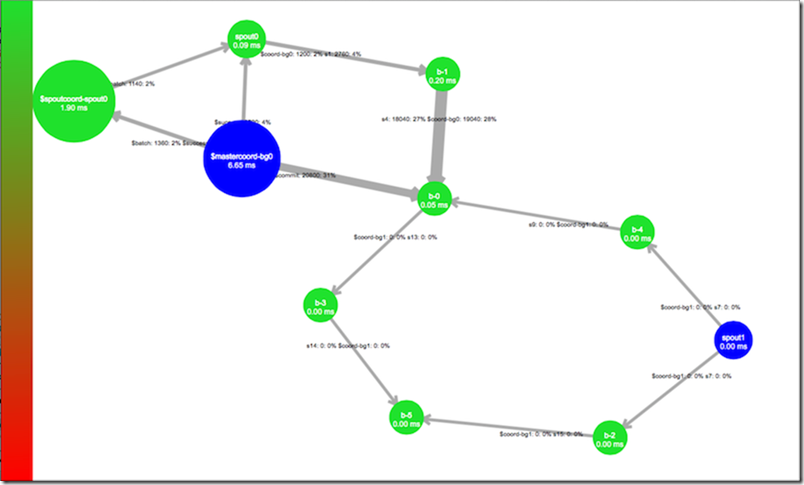
strom ui Topology 可视化视图各个指标含义说明
In the visualization, spout components are represented as blue, while bolts are colored between green and red depending on their associated capacity metric. The width of the lines between the components represent the flow of tuples relative to the other visible streams.
storm ui 中的topology可视化的中的指标说明:
spout: 用蓝色的球表示
bolt: 用绿色到红色的球表示,绿色到红色代表了该bolt并行度(capacity metric )相关的指标。
组件之间的线的宽度:数据流的大小(组件之间的线的宽度代表元组数据流相对于其他可见的流)。
组件球的半径大小:
组件上线上的数字:相关联两个组件上传输的数据量trans,百分比为 (trans /totaltrans)*100%, totaltrans是所有组件间传输的数据量的总和。
作者:
丹江湖畔养蜂子的赵大爹
出处:http://www.cnblogs.com/honeybee/
关于作者:丹江湖畔养蜂子的赵大爹
本文版权归作者和博客园共有,欢迎转载,但未经作者同意必须保留此段声明,且在文章页面明显位置给出原文链接
分类:
strom


【推荐】国内首个AI IDE,深度理解中文开发场景,立即下载体验Trae
【推荐】编程新体验,更懂你的AI,立即体验豆包MarsCode编程助手
【推荐】抖音旗下AI助手豆包,你的智能百科全书,全免费不限次数
【推荐】轻量又高性能的 SSH 工具 IShell:AI 加持,快人一步
· go语言实现终端里的倒计时
· 如何编写易于单元测试的代码
· 10年+ .NET Coder 心语,封装的思维:从隐藏、稳定开始理解其本质意义
· .NET Core 中如何实现缓存的预热?
· 从 HTTP 原因短语缺失研究 HTTP/2 和 HTTP/3 的设计差异
· 周边上新:园子的第一款马克杯温暖上架
· 分享 3 个 .NET 开源的文件压缩处理库,助力快速实现文件压缩解压功能!
· Ollama——大语言模型本地部署的极速利器
· 使用C#创建一个MCP客户端
· 分享一个免费、快速、无限量使用的满血 DeepSeek R1 模型,支持深度思考和联网搜索!