1.明确数据分析的目的:了解FIFA2018球员整体情况
2.获得数据(一般来源于公司或网络等)
3.数据清洗(选用不同的工具,可使用excel,python,R,mysql等,本次分析使用python语言进行清洗和分析,使用的工具为jupyter notebook)
4.选择不同的维度对数据进行分析
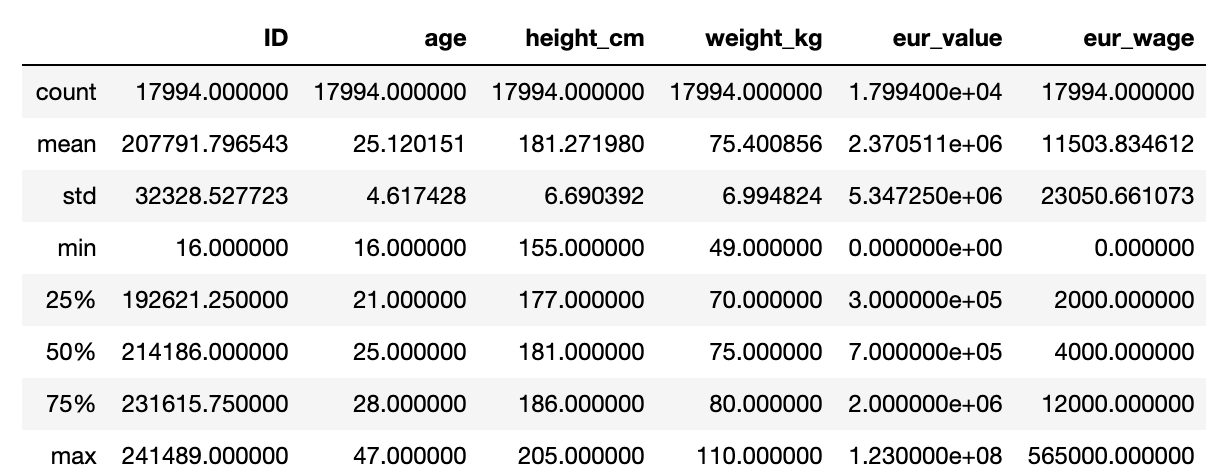
import numpy as np
import pandas as pd
import matplotlib.pyplot as plt
df=pd.read_csv('./FIFA_2018_player.csv')
#数据的总体描述
df.describe()
#计算每列的行数,可以看出有没有null值
df.count()
ID             17994
name           17994
full_name      17994
nationality    17994
league         17741
club           17741
age            17994
birth_date     17994
height_cm      17994
weight_kg      17994
eur_value      17994
eur_wage       17994
dtype: int64
#获取league为null的数据
df[df['league'].isnull()]
#删除league为null的数据
df.drop(df[df.league.isnull()].index,inplace=True)
#使用平均值填充
df['eur_value'].replace(0,df['eur_value'].mean(),inplace=True)
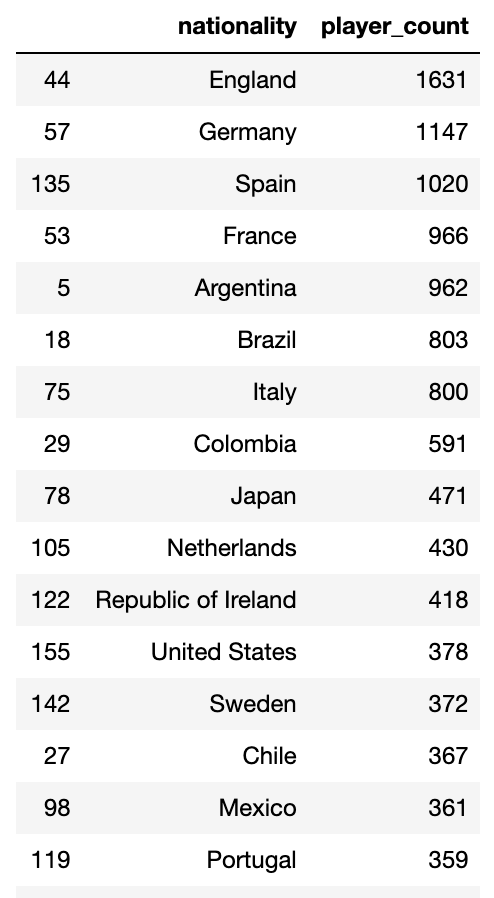
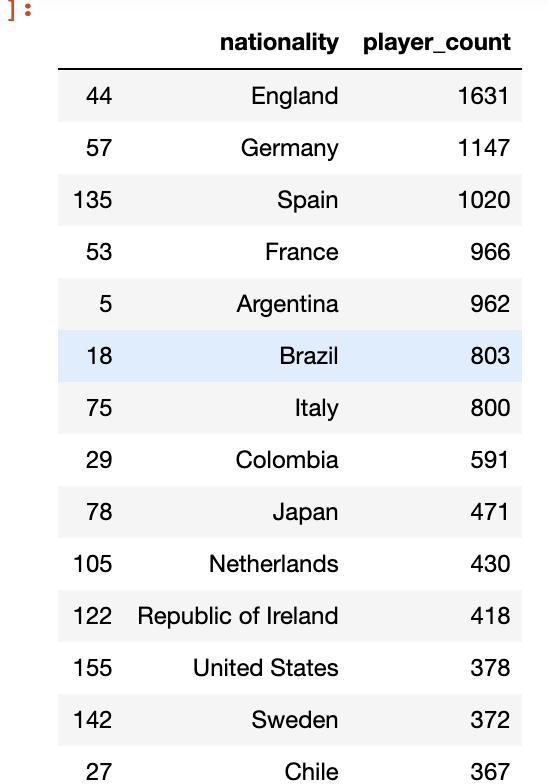
#分析的维度和指标(平均数,最大数,最小数......)
#维度:从数据选出一列或多列作为一个维度,例如国家,国家 俱乐部  离散型 和 连续型的
#离散型的维度 按照groupby 进行计算指标
nationality_data=df.groupby('nationality',as_index=False).count()[['nationality','name']]
nationality_data.rename(columns={'name':'player_count'},inplace=True)
#按照运动员数量排名
nationality_sorted_data=nationality_data.sort_values('player_count',ascending=False)
#运动员数量大于100的国家列表
nationality_sorted_data[nationality_sorted_data['player_count']>100]
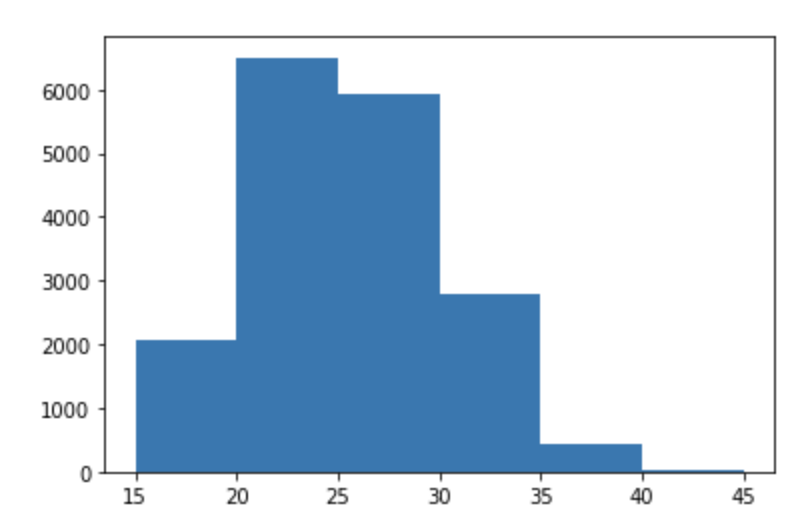
#连续型的维度统计指标 年龄
bins=np.arange(15,50,5)
#使用cut将age归为具体的组
bins_data=pd.cut(df['age'],bins)
#然后按照归好的组将数据进行分组,统计每组的数据
bins_count=df['age'].groupby(bins_data).count()
bins_count
#画直方图
#plt.hist(df['age'],bins)
#各大联赛运动员数量
league_data=df.groupby('league',as_index=False).count()[['league','ID']].sort_values('ID',ascending=False)
league_data.rename(columns={'ID':'player_count'},inplace=True)
league_data

 浙公网安备 33010602011771号