datagrid+toolbar 不分页 显示
1 新建DataGrid.js文件
/***
 *
 *
 *el: table id
 *
 ***/
function showDataGrid(el) {
    $(el).datagrid({
        title: '不分页的gridview',
        url: '/Home/GetUserInfo',   //一个用以从远程站点请求数据的超链接地址。
        method: 'get', //请求远程数据的方法类型  默认 post
        loadMsg: '数据正在加载,请稍等...',//当从远程站点载入数据时,显示的一条快捷信息。
        autoRowHeight: true,  //定义设置行的高度,根据该行的内容。设置为false可以提高负载性能。
        height: 1000,   // 设置高度
        width: 'auto',   //设置宽度
        striped: true,//设置为true将交替显示行背景。
        nowrap: true,//设置为true,当数据长度超出列宽时将会自动截取。
        rownumbers: true,//设置为true将显示行数。
        singleSelect: true,//设置为true将只允许选择一行。
        sortName: 'Age', //当数据表格初始化时以哪一列来排序。
        sortOrder: 'asc',//定义排序顺序,可以是'asc'或者'desc'(正序或者倒序)。
        showFooter: false,//定义是否显示行底(如果是做统计表格,这里可以显示总计等)
        cache: true,
        iconCls: 'icon-save',  //  设置表头的图标
        collapsible: true,        //右上角可以折叠
        toolbar: toolbar,
        columns: [[
            {
                field: '',
                title: '',
                checkbox: true
            },
            {
                field: 'Name',
                title: '姓名',
                width: 100,
                sortable: true,        //设置为true允许对该列排序。
                rowspan: 1,            //表明一个单元格跨几行。
                colspan: 1,          // 表明一个单元格跨几列。
                hidden: false,//设置为true将隐藏列。

                //格式化单元格函数,有3个参数:
                //value:字段的值。
               // rowData:行数据。
               // rowIndex:行索引。
                formatter: function (value, row, index) {
                    if (index == 1) {
                        return 'sasasas';
                    }
                    else
                        return value;
                },
                //单元格样式函数,返回样式字符串装饰表格如'background:red',function有3个参数:
                //value:字段值。
               // rowData:行数据。
               // rowIndex:行索引。
                styler: function (value, row, index) {
                    if (index < 9)
                        return 'background-color:yellow;color:red;';

                },
                editor: 'text'
            },
            { field: 'Age', title: '年龄', width: 100 },
            { field: 'Work', title: '工作', width: 100 },
        ]],
        fitColumns: true,
        rowStyler: function (index, row) {                   //返回样式,如:'background:red',function有2个参数:
            if (index == 10)                                 // index:行索引,从0开始.
                return 'background-color:red;color:#fff;'     // row:对应于该行记录的对象。
        },
        // 以下三个属性 分组
        //groupField: 'Name',
        //view:groupview,  // 这个  function   要自己写
        //groupFormatter: function (value, rows) {                       // 值
        //    return '分组' - value + ' - ' + rows.length + ' Item(s)';   //rows   总的个数
        //}

    });
}
// 定义toolbar
var toolbar = [{
    text: 'Add',
    iconCls: 'icon-add',
    handler: function () { alert('add') }
}, {
    text: 'Cut',
    iconCls: 'icon-cut',
        handler: function () { $.messager.alert('info','cut') }
}, '-', {
    text: 'Save',
    iconCls: 'icon-save',
    handler: function () { alert('save') }
}];
2 前端使用:
<script src="~/jquery-easyui-1.5.5.2/jquery.min.js"></script>
<script src="~/jquery-easyui-1.5.5.2/jquery.easyui.min.js"></script>
<script src="~/jquery-easyui-1.5.5.2/locale/easyui-lang-zh_CN.js"></script>
<link href="~/jquery-easyui-1.5.5.2/themes/default/easyui.css" rel="stylesheet" />
<link href="~/jquery-easyui-1.5.5.2/themes/icon.css" rel="stylesheet" />

 <div style="margin:20px;width:1100px">
        <table id="dgv"></table>
    </div>

<script src="~/Scripts/EasyUI/DataGrid.js"></script>

<script>
    $(document).ready((function () {

        // 这个地方必须要放在这个里面,否则会导致有边框不显示
        showDataGrid("#dgv");

    }));


</script>
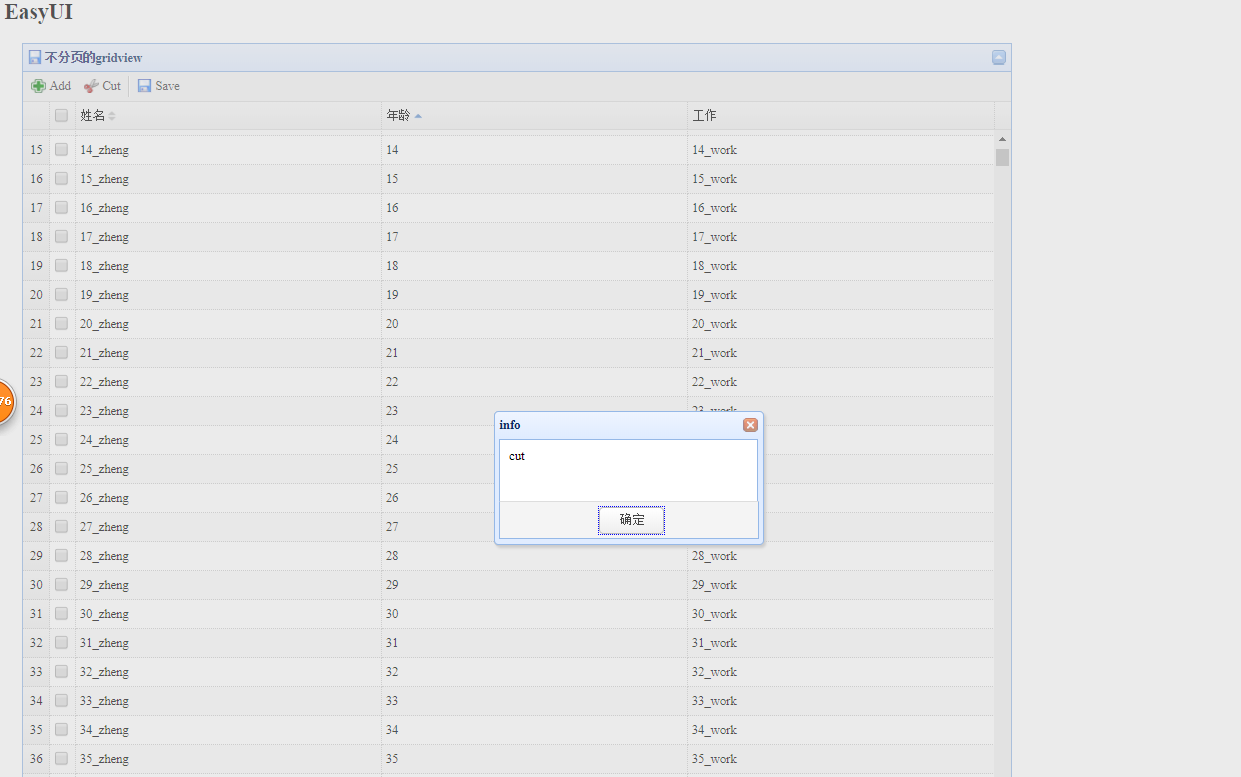
展示:

 浙公网安备 33010602011771号