
内存泄露检测工具
一 VisualC++ debugger 和 CRT 库
- 第一步: 包含以下头文件
#define _CRTDBG_MAP_ALLOC
#include <stdlib.h>
#include <crtdbg.h>
- 第二步: 接管 new 操作符
#ifdef _DEBUG
#ifndef DBG_NEW
#define DBG_NEW new ( _NORMAL_BLOCK , __FILE__ ,__LINE__)
#define new DBG_NEW
#endif
#endif
- 第三步: 在代码结束出输出内存泄漏信息
_CrtDumpMemoryLeaks();
示例:
#define _CRTDBG_MAP_ALLOC
#include <stdlib.h>
#include <crtdbg.h>

#ifdef _DEBUG
#ifndef DBG_NEW
#define DBG_NEW new ( _NORMAL_BLOCK , __FILE__ ,__LINE__)
#define new DBG_NEW
#endif
#endif

int main()
{

    int* p = new int[100];
    p[0] = 0;
    int* p1 = new int[100];
    p1[0] = 0;

    _CrtDumpMemoryLeaks();
    return 0;
}
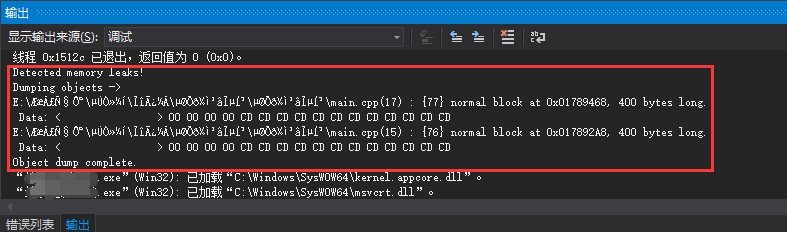
调试的时候就可以看到有内存泄露
二 内存泄露工具
Windows : Purify,BoundsCheaker、Deleaker、VisualLeak Detector(VLD)
Linux 平台: Valgrind memcheck


【推荐】国内首个AI IDE,深度理解中文开发场景,立即下载体验Trae
【推荐】编程新体验,更懂你的AI,立即体验豆包MarsCode编程助手
【推荐】抖音旗下AI助手豆包,你的智能百科全书,全免费不限次数
【推荐】轻量又高性能的 SSH 工具 IShell:AI 加持,快人一步
· 震惊!C++程序真的从main开始吗?99%的程序员都答错了
· 别再用vector<bool>了!Google高级工程师:这可能是STL最大的设计失误
· 单元测试从入门到精通
· 【硬核科普】Trae如何「偷看」你的代码?零基础破解AI编程运行原理
· 上周热点回顾(3.3-3.9)