# -*- coding: utf-8 -*-
"""
Created on Tue Nov 04 15:46:32 2014
@author: dell
"""
import numpy as np
import matplotlib.pyplot as plt
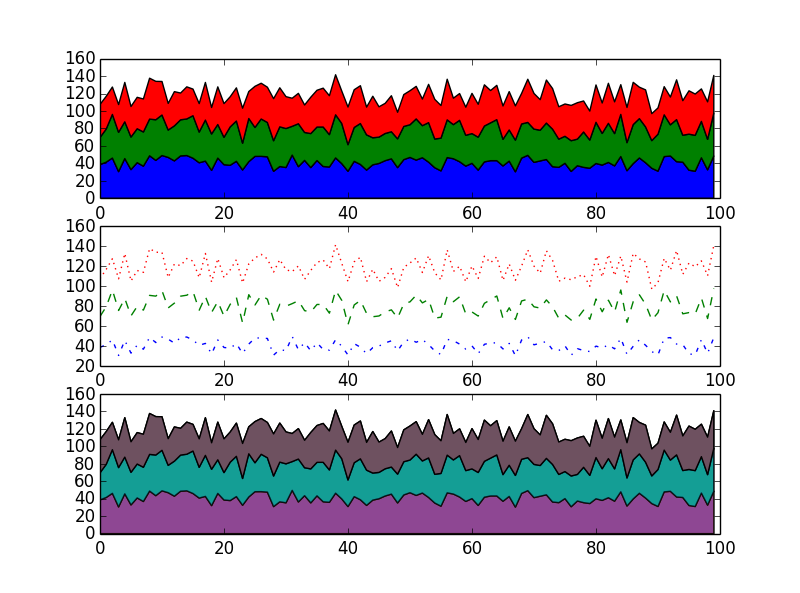
if __name__ == '__main__':
mylist = [np.random.uniform(30, 50, 100) for i in range(3)]
#mylist = [np.random.randint(30, 50, 100) for i in range(3)]
y = np.row_stack(mylist)
x = range(0, 100)
fig = plt.figure()
ax1 = fig.add_subplot(311)
ax1.stackplot(x, y)
#plt.show()
ax2 = fig.add_subplot(312)
ax2.plot(x,mylist[0], '-.')
ax2.plot(x,sum(mylist[0:2]), '--')
ax2.plot(x,sum(mylist[0:3]), ':')
ax3 = fig.add_subplot(313)
ax3.stackplot(x, y)
y_stack = np.cumsum(y, axis=0)
ax3.fill_between(x, 0, y_stack[0,:], facecolor="#CC6666", alpha=.7)
ax3.fill_between(x, y_stack[0,:], y_stack[1,:], facecolor="#1DACD6", alpha=.7)
ax3.fill_between(x, y_stack[1,:], y_stack[2,:], facecolor="#6E5160")
plt.show()
![]()

 浙公网安备 33010602011771号