

kibana-timelion-QPS案例 - 容器日志收集方案
1.timelion
.es(q='status:200',index=filebeat-testindex*,timefield=@timestamp,metric=count).label('200'),.es(q='status:502',index=filebeat-testindex*,timefield=@timestamp,metric=count).label('502')
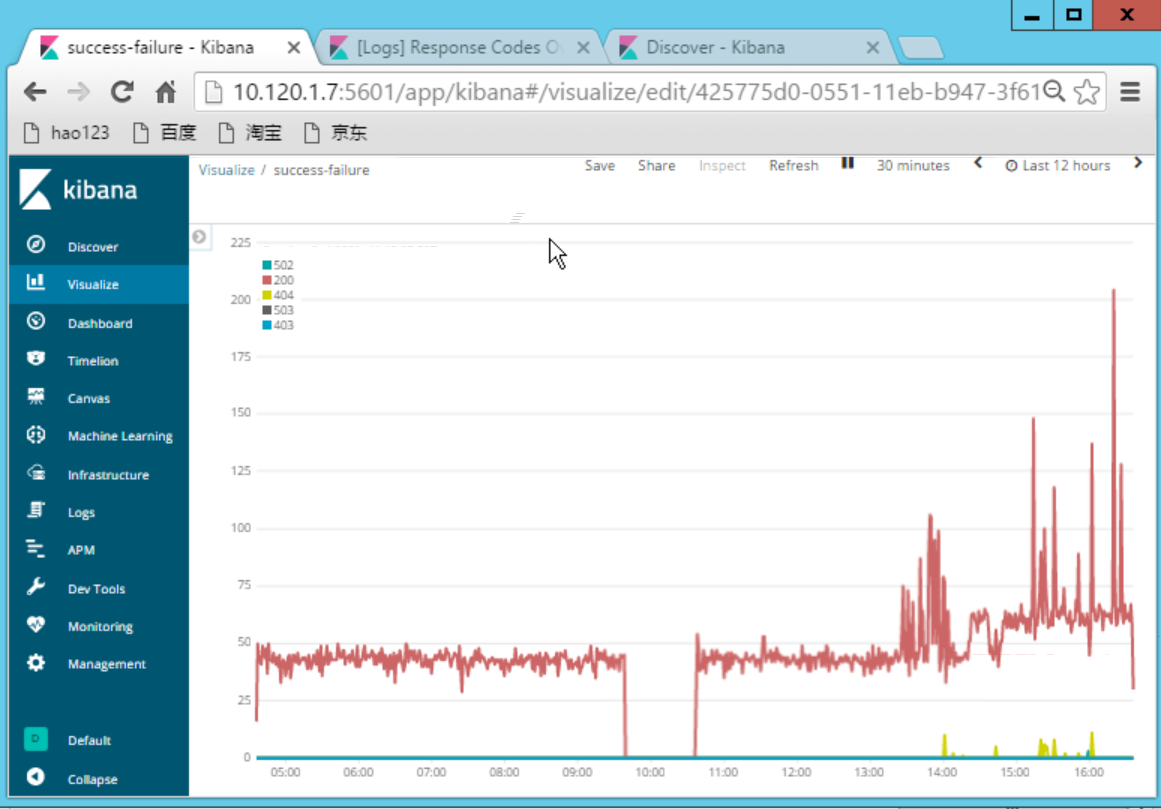
2.qps
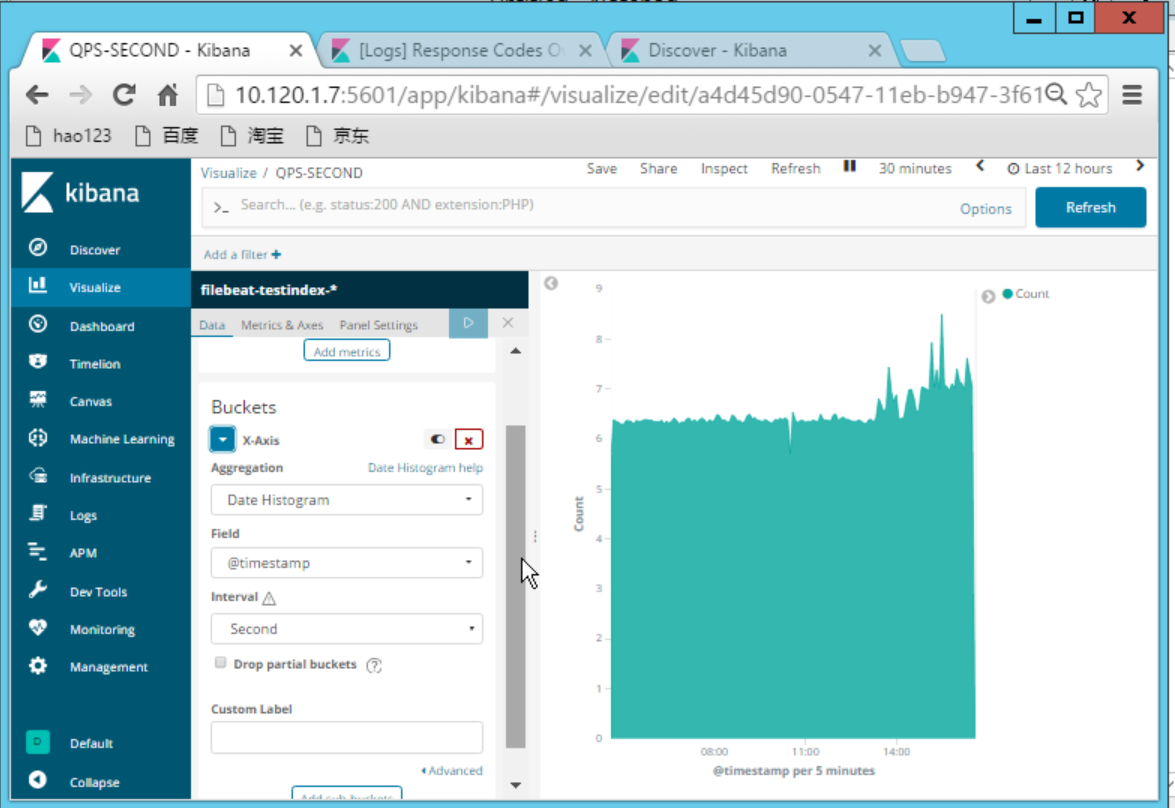
3.nginx的配置

http {
    include       mime.types;
    default_type  application/octet-stream;
    server_tokens off;

   log_format json  '{"@timestamp":"$time_iso8601",'

                '"@version":"1",'

                '"server_addr":"$server_addr",'

                '"remote_addr":"$remote_addr",'

                '"host":"$host",'

                '"uri":"$uri",'

                '"body_bytes_sent":$body_bytes_sent,'

                '"bytes_sent":$body_bytes_sent,'

                '"upstream_response_time":$upstream_response_time,'

                '"request":"$request",'

                '"request_length":$request_length,'

                '"request_time":$request_time,'

                '"status":"$status",'

                '"http_referer":"$http_referer",'

                '"http_x_forwarded_for":"$http_x_forwarded_for",'

                '"http_user_agent":"$http_user_agent"'

                '}';
4. 容器日志收集方案: http://www.xuyasong.com/?p=1921#i-8
容器日志与事件
本文主要是 Prometheus 监控内容, 这里只简单介绍下 K8S 中的日志、事件处理方案,以及和 Prometheus 的搭配。

日志处理:

日志采集与推送:一般是Fluentd/Fluent-Bit/Filebeat等采集推送到 ES、对象存储、kafaka,日志就该交给专业的 EFK 来做,分为容器标准输出、容器内日志。
日志解析转 metric:可以提取一些日志转为 Prometheus 格式的指标,如解析特定字符串出现次数,解析 Nginx 日志得到 QPS 、请求延迟等。常用方案是 mtail 或者 grok
日志采集方案:

sidecar 方式:和业务容器共享日志目录,由 sidecar 完成日志推送,一般用于多租户场景。
daemonset 方式:机器上运行采集进程,统一推送出去。
用一个例子来演示会更加清晰


【推荐】国内首个AI IDE,深度理解中文开发场景,立即下载体验Trae
【推荐】编程新体验,更懂你的AI,立即体验豆包MarsCode编程助手
【推荐】抖音旗下AI助手豆包,你的智能百科全书,全免费不限次数
【推荐】轻量又高性能的 SSH 工具 IShell:AI 加持,快人一步
· .NET Core 中如何实现缓存的预热?
· 从 HTTP 原因短语缺失研究 HTTP/2 和 HTTP/3 的设计差异
· AI与.NET技术实操系列:向量存储与相似性搜索在 .NET 中的实现
· 基于Microsoft.Extensions.AI核心库实现RAG应用
· Linux系列:如何用heaptrack跟踪.NET程序的非托管内存泄露
· TypeScript + Deepseek 打造卜卦网站:技术与玄学的结合
· 阿里巴巴 QwQ-32B真的超越了 DeepSeek R-1吗?
· 如何调用 DeepSeek 的自然语言处理 API 接口并集成到在线客服系统
· 【译】Visual Studio 中新的强大生产力特性
· 2025年我用 Compose 写了一个 Todo App