
phpstudy(phpfpm)+php8+debug3+vscode && php-cli的debug打断点调试安装
一:安装phpstudy+php8+Xdebug
1.安装phpstudy 官网 https://www.xp.cn/
2.安装php8版本
1)软件管理里下载
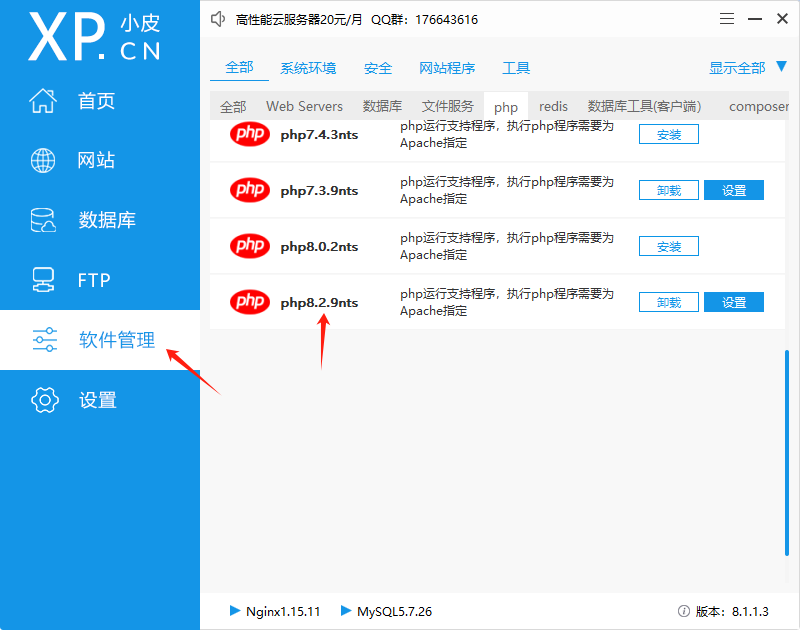
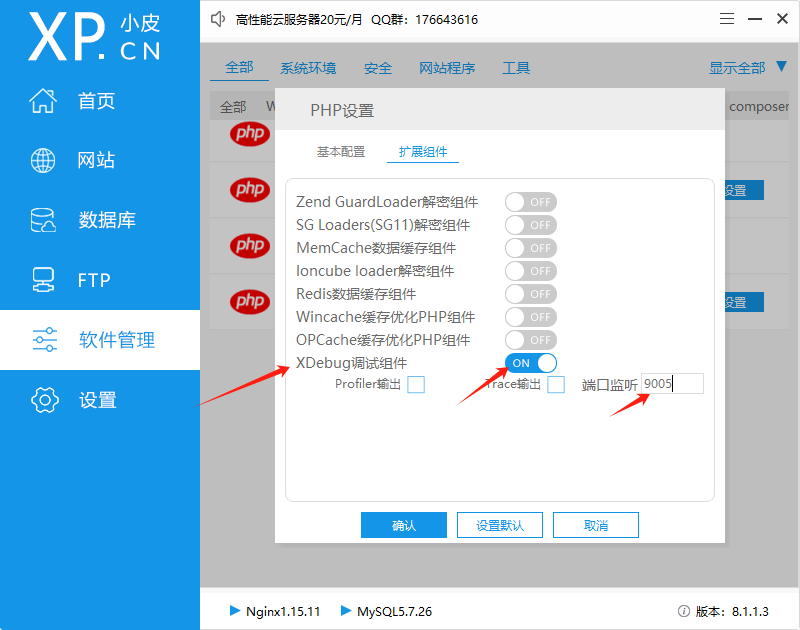
php8.2.9nts设置
2)官网下载:
①如果要8.1版本,请自己到官网下载(https://windows.php.net/download/),安装。https://www.php.cn/faq/498611.html
此时php软件就无法设置XDebug调试组件,直接php.ini里设置即可
②下载Xdebug插件 :
Xdebug官方网站: 下载地址
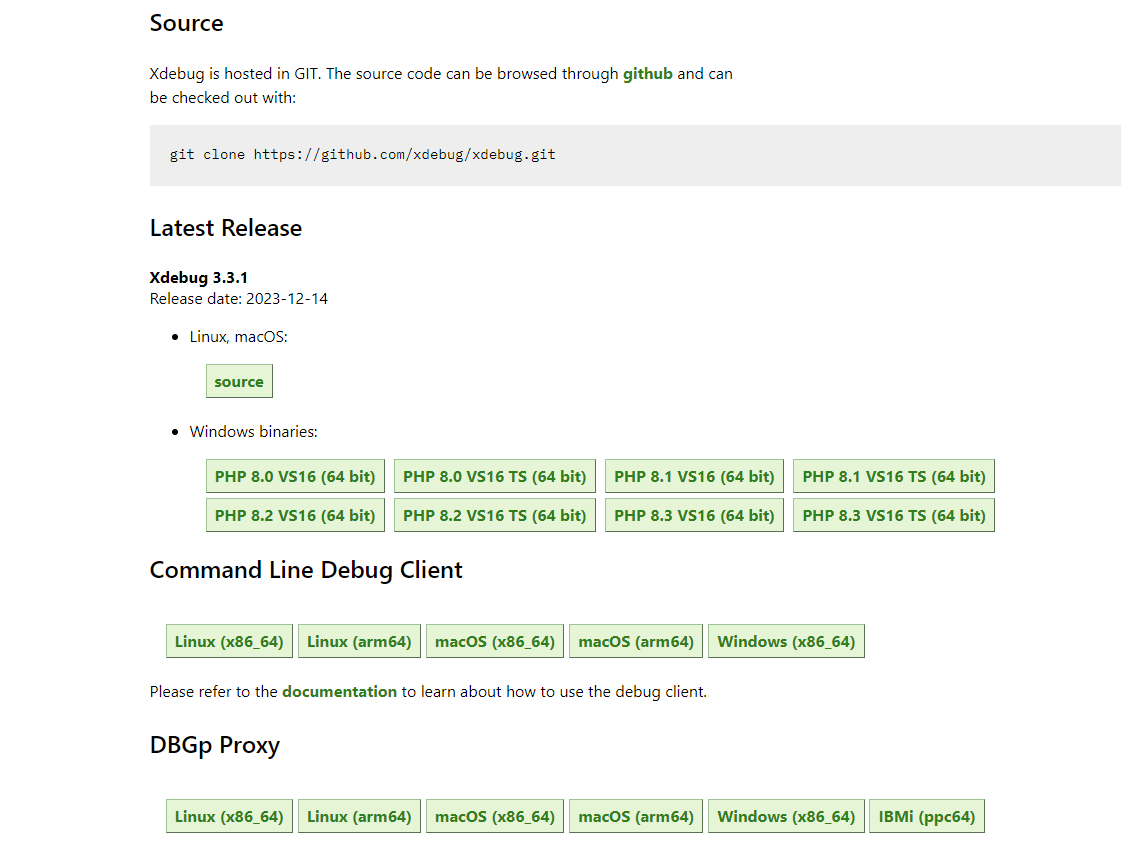
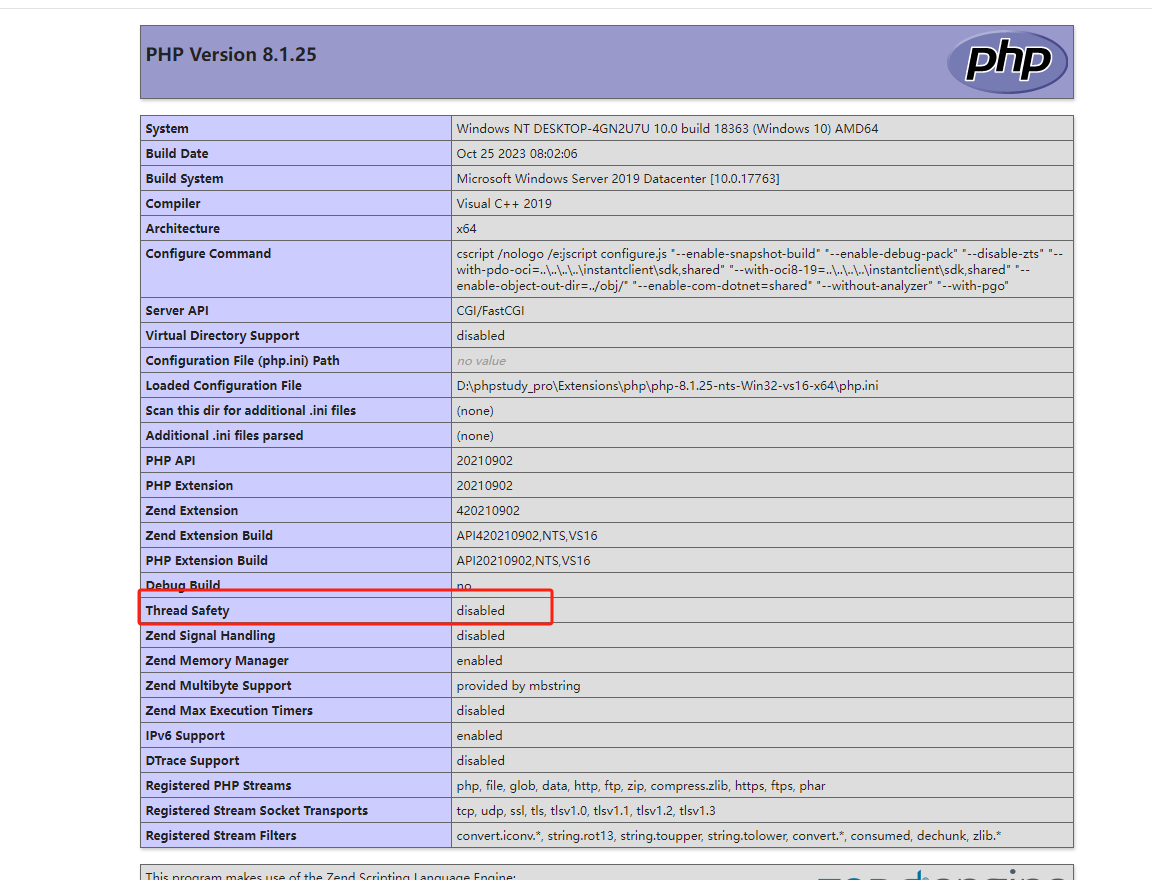
根据自己的PHP版本下载对应的版本,注意有nts的和没有nts结尾文件要和php版本对应。或者查看phpinfo的thread safe: enable->ts ,disable->nts
配置php.ini
[XDebug]
;选用vscode
xdebug.indekey=Vscode
zend_extension="D:/phpstudy_pro/Extensions/php/php-8.1.25-nts-Win32-vs16-x64/ext/php_xdebug.dll"
xdebug.mode = "debug,develop,trace"
xdebug.client_host=127.0.0.1
xdebug.client_port=9005
xdebug.idekey="PHPSTORM"
xdebug.collect_return=On;收集返回值
xdebug.log="D:/phpstudy_pro/Extensions/tmp/php-8.1.25-nts-Win32-vs16-x64/xdebug.log"
xdebug.discover_client_host = true  ;这个很重要,必须有,不然断点debug不出来,原理不做深究
xdebug.collect_params=1
xdebug.remote_handler=dbgp
xdebug.start_with_request=yes
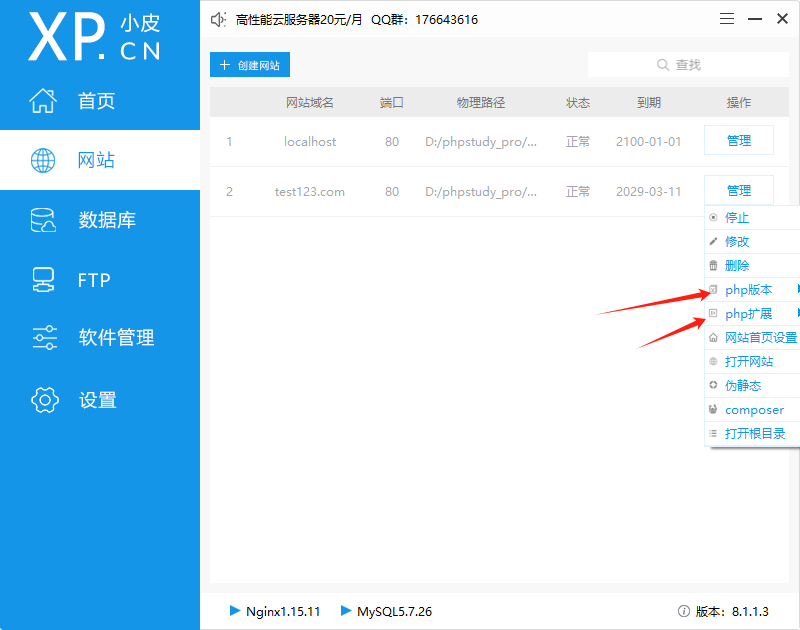
3.创建网站,选择php版本,php扩展勾选xdebug( 如果php扩展里没有XDebug,请执行上一步的 2->2)->②)
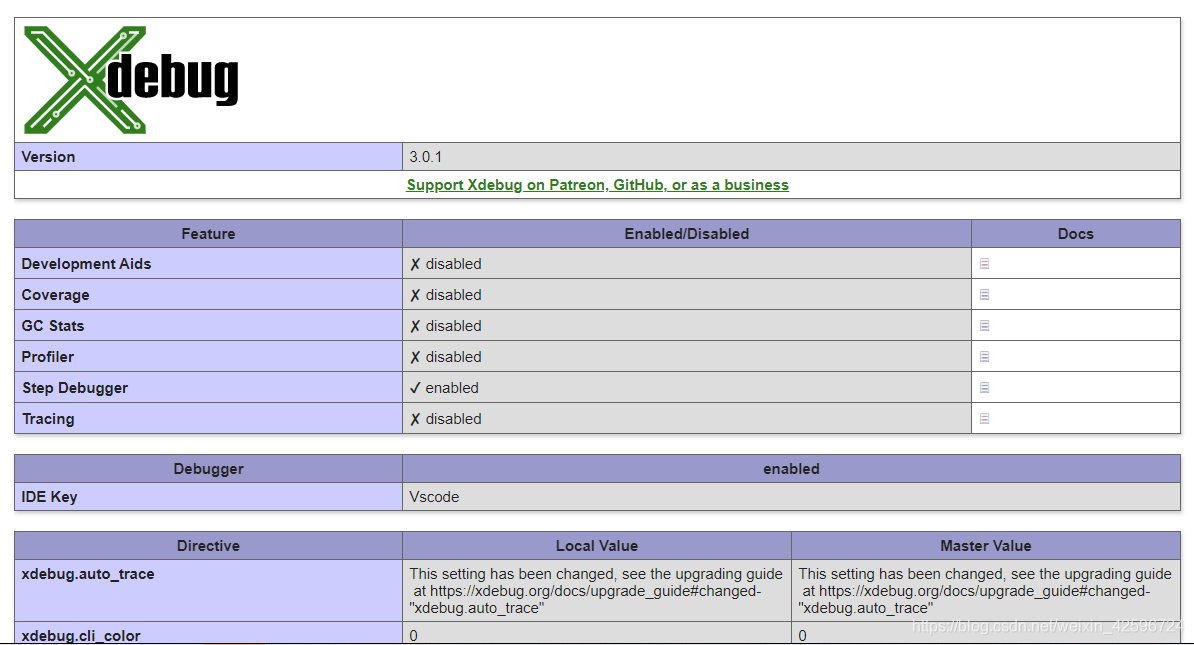
4.查看phpinfo
可以看到Step Debugger为enabled,即调试功能被启用了
二、Visual Studio Code
1.安装Visual Studio Code
官方网站: 地址
进入下载页面,下载适合自己的版本,让后傻瓜式安装
https://code.visualstudio.com/Download
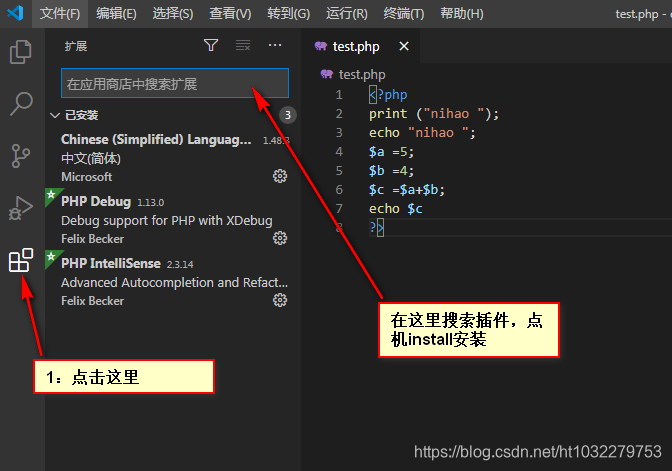
2.安装插件
安装 PHP Debug,PHP IntelliSense 插件
图中第一为中文插件,安装后重启编辑器会变为中文,这个选择安装
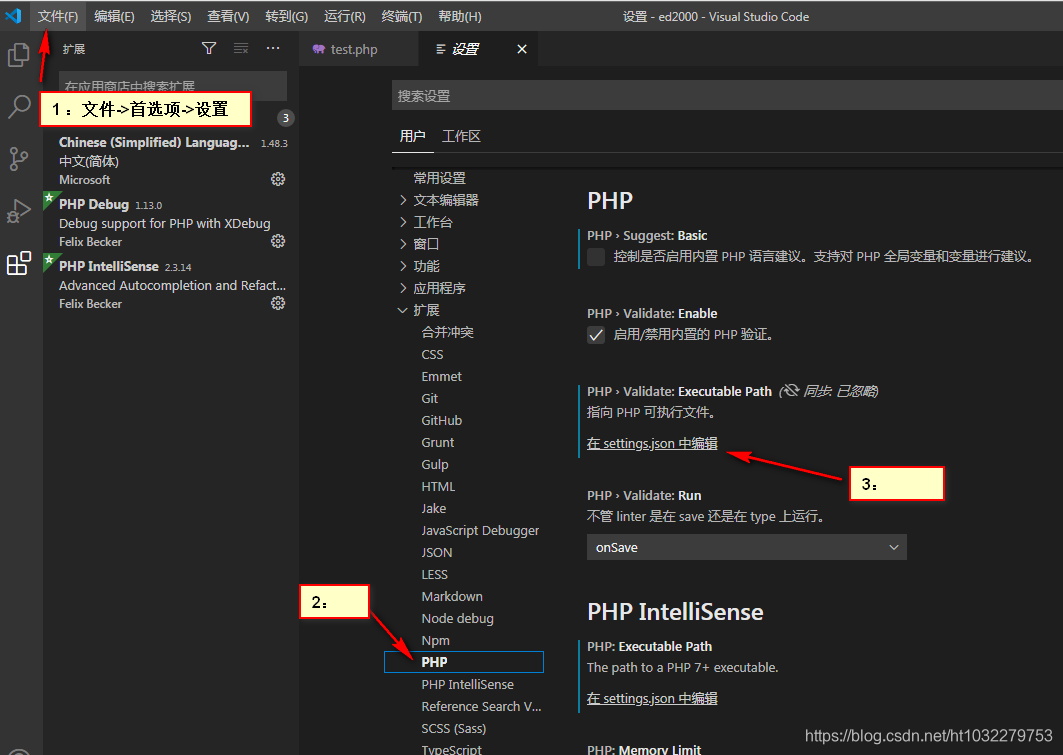
3.开启Visual Studio Code断点调试功能
配置关联php环境,
"php.validate.executablePath": "D:/phpstudy_pro/Extensions/php/php-8.1.25-nts-Win32-vs16-x64/php.exe",

4.配置项目配置文件
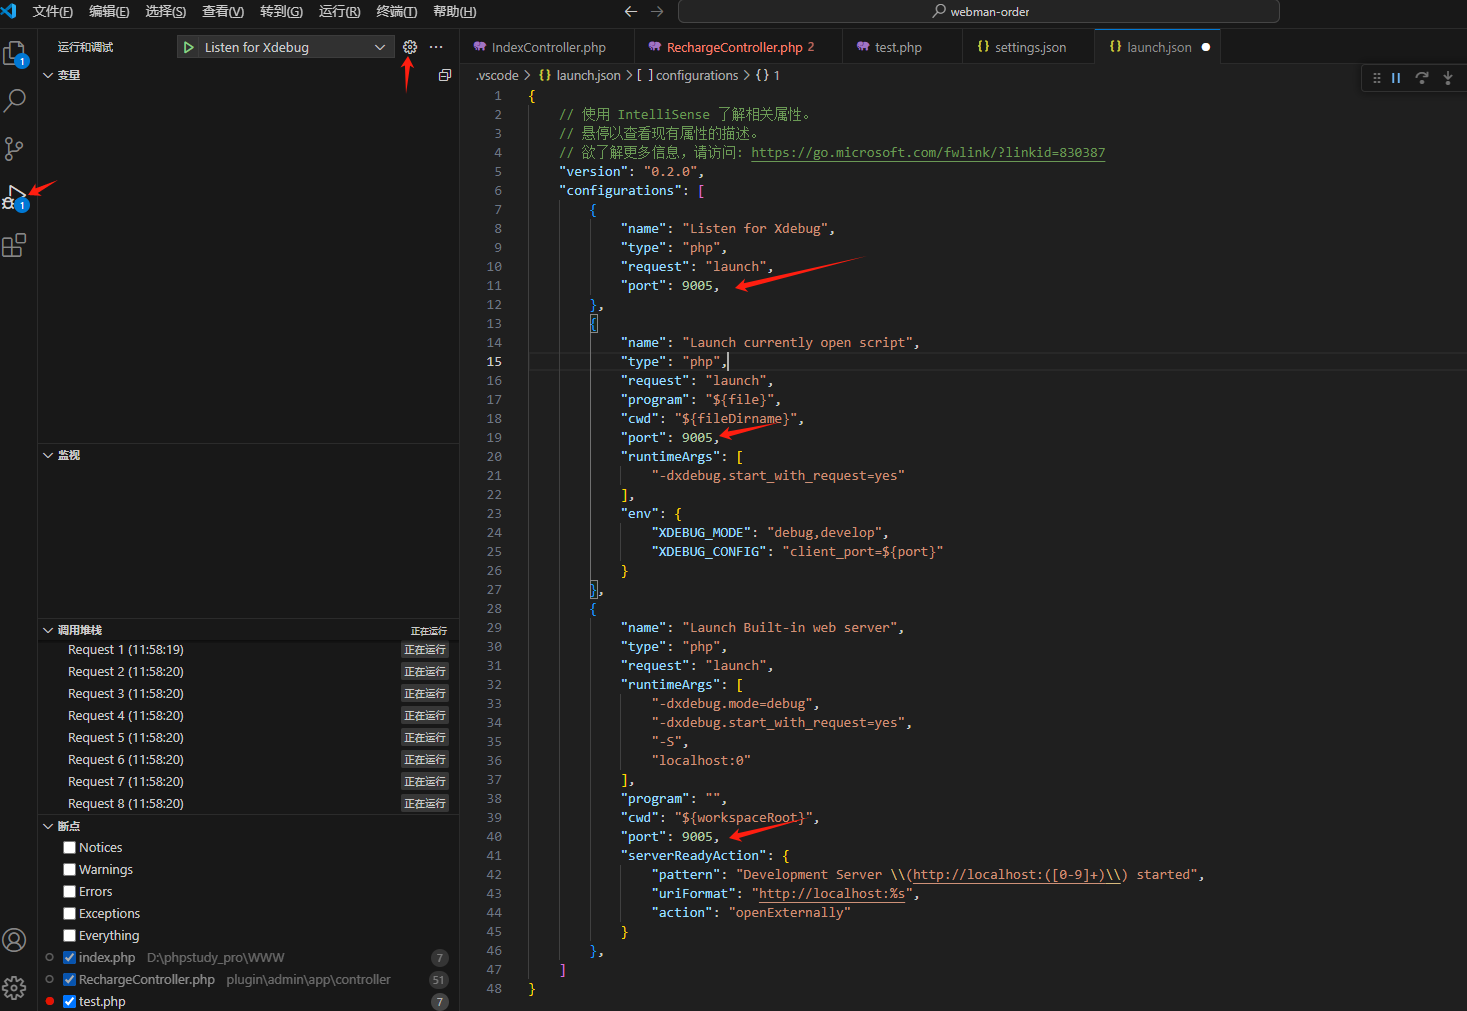
{
    // 使用 IntelliSense 了解相关属性。
    // 悬停以查看现有属性的描述。
    // 欲了解更多信息,请访问: https://go.microsoft.com/fwlink/?linkid=830387
    "version": "0.2.0",
    "configurations": [
        {
            "name": "Listen for Xdebug",
            "type": "php",
            "request": "launch",
            "port": 9005,
        },
        {
            "name": "Launch currently open script",
            "type": "php",
            "request": "launch",
            "program": "${file}",
            "cwd": "${fileDirname}",
            "port": 9005,
            "runtimeArgs": [
                "-dxdebug.start_with_request=yes"
            ],
            "env": {
                "XDEBUG_MODE": "debug,develop",
                "XDEBUG_CONFIG": "client_port=${port}"
            }
        },
        {
            "name": "Launch Built-in web server",
            "type": "php",
            "request": "launch",
            "runtimeArgs": [
                "-dxdebug.mode=debug",
                "-dxdebug.start_with_request=yes",
                "-S",
                "localhost:0"
            ],
            "program": "",
            "cwd": "${workspaceRoot}",
            "port": 9005,
            "serverReadyAction": {
                "pattern": "Development Server \\(http://localhost:([0-9]+)\\) started",
                "uriFormat": "http://localhost:%s",
                "action": "openExternally"
            }
        },
    ]
}
三、调试
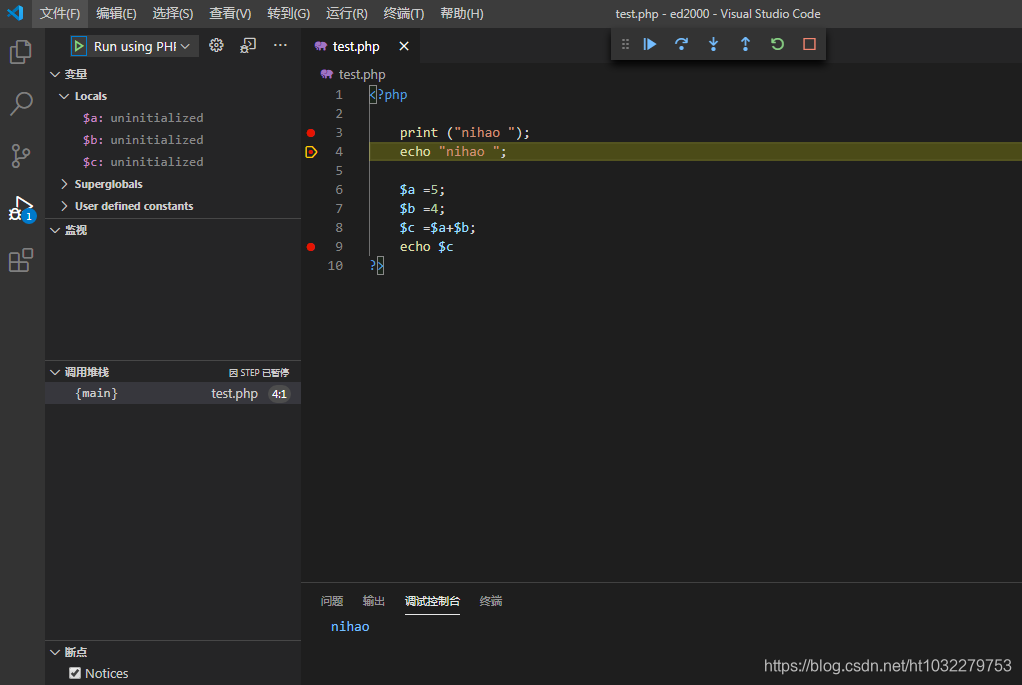
按F5打开调试
鼠标左键点机代码左侧添加断点
按F11单步执行
查看控制台输出情况,和虫子右侧的一些信息
注:php-cli(或者说swoole)的断点调试,要先打开xdebug,然后在开启php-cli,然后才可以打出断点

 浙公网安备 33010602011771号