
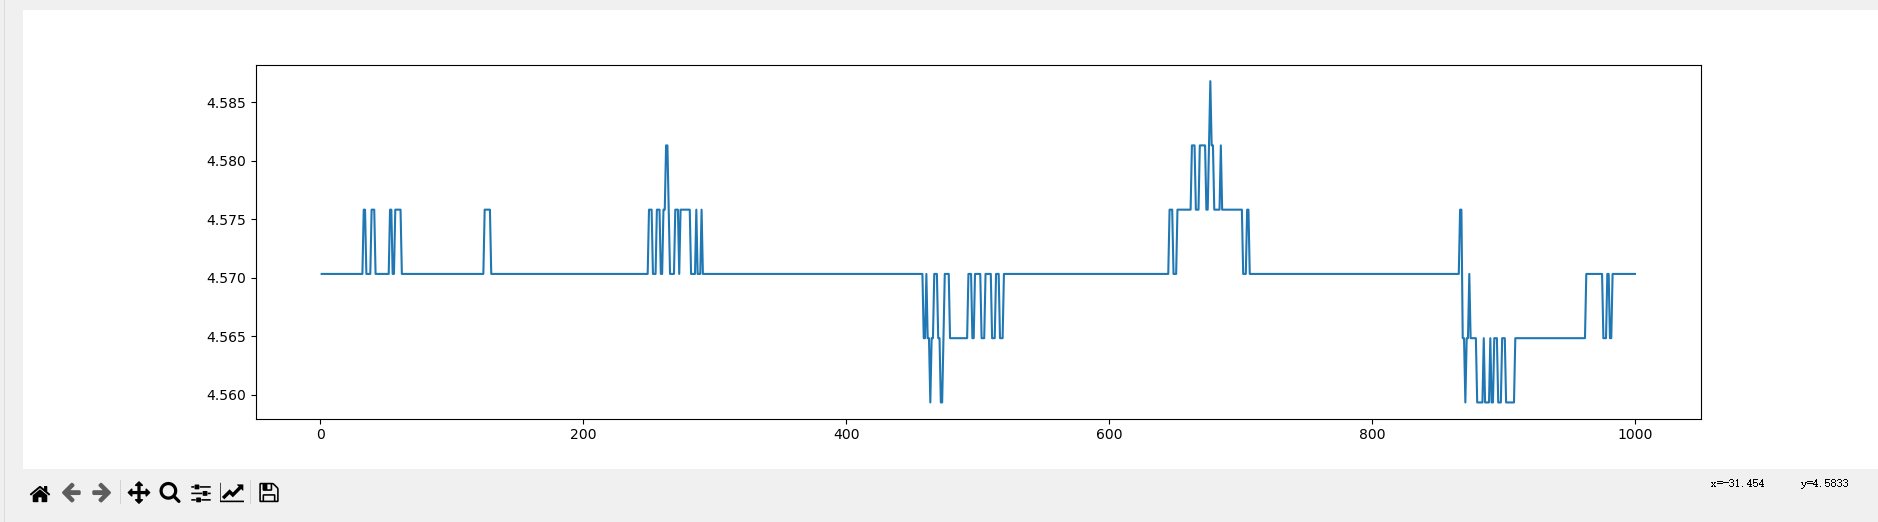
pyqt 绘制折线图
import sys
from PyQt5.QtWidgets import QApplication, QMainWindow, QVBoxLayout, QWidget
from matplotlib.figure import Figure
from matplotlib.backends.backend_qt5agg import FigureCanvasQTAgg as FigureCanvas
from matplotlib.backends.backend_qt5 import NavigationToolbar2QT as NavigationToolbar
import matplotlib.pyplot as plt


class MainWindow(QMainWindow):
    def __init__(self):
        super().__init__()

        # 创建主窗口
        self.setWindowTitle("PyQt Line Plot Example")
        self.setGeometry(100, 100, 800, 600)

        # 创建绘图区域
        self.figure = Figure()
        # 创建与画布关联的图形对象
        self.canvas = FigureCanvas(self.figure)
        # 创建工具栏对象
        self.toolbar = NavigationToolbar(self.canvas, self)

        # 创建绘图区域布局
        layout = QVBoxLayout()
        layout.addWidget(self.canvas)
        layout.addWidget(self.toolbar)

        # 创建自定义窗口部件
        widget = QWidget()
        widget.setLayout(layout)
        self.setCentralWidget(widget)

        # 绘制折线图
        x = [1, 2, 3, 4, 5, 6, 7, 8, 9, 10, 11, 12, 13, 14, 15, 16, 17, 18, 19, 20, 21, 22, 23, 24, 25, 26, 27, 28, 29, 30, 31, 32, 33, 34, 35, 36, 37, 38, 39, 40, 41, 42, 43, 44, 45, 46, 47, 48, 49, 50, 51, 52, 53, 54, 55, 56, 57, 58, 59, 60, 61, 62, 63, 64, 65, 66, 67, 68, 69, 70, 71, 72, 73, 74, 75, 76, 77, 78, 79, 80, 81, 82, 83, 84, 85, 86, 87, 88, 89, 90, 91, 92, 93, 94, 95, 96, 97, 98, 99, 100]
        y = [-2.9718017578125, -2.9718017578125, -2.9718017578125, -2.9718017578125, -2.9718017578125, -2.9718017578125, -2.9718017578125, -2.9718017578125, -2.9718017578125, -2.9718017578125, -2.9718017578125, -2.9718017578125, -2.9718017578125, -2.9718017578125, -2.9718017578125, -2.9718017578125, -2.9718017578125, -2.9718017578125, -2.9718017578125, -2.9718017578125, -2.9718017578125, -2.96630859375, -2.96630859375, -2.96630859375, -2.96630859375, -2.96630859375, -2.96630859375, -2.96630859375, -2.96630859375, -2.96630859375, -2.96630859375, -2.96630859375, -2.96630859375, -2.96630859375, -2.96630859375, -2.96630859375, -2.96630859375, -2.96630859375, -2.96630859375, -2.96630859375, -2.96630859375, -2.96630859375, -2.96630859375, -2.96630859375, -2.96630859375, -2.96630859375, -2.96630859375, -2.96630859375, -2.96630859375, -2.96630859375, -2.96630859375, -2.9718017578125, -2.9718017578125, -2.9718017578125, -2.9718017578125, -2.9718017578125, -2.9718017578125, -2.9718017578125, -2.9718017578125, -2.9718017578125, -2.9718017578125, -2.9718017578125, -2.9718017578125, -2.9718017578125, -2.9718017578125, -2.9718017578125, -2.9718017578125, -2.9718017578125, -2.9718017578125, -2.9718017578125, -2.9718017578125, -2.9718017578125, -2.9718017578125, -2.9718017578125, -2.9718017578125, -2.9718017578125, -2.9718017578125, -2.9718017578125, -2.9718017578125, -2.9718017578125, -2.9718017578125, -2.9718017578125, -2.9718017578125, -2.9718017578125, -2.9718017578125, -2.9718017578125, -2.9718017578125, -2.9718017578125, -2.9718017578125, -2.9718017578125, -2.9718017578125, -2.9718017578125, -2.9718017578125, -2.9718017578125, -2.9718017578125, -2.9718017578125, -2.9718017578125, -2.9718017578125, -2.9718017578125, -2.9718017578125]
        self.figure.add_subplot(111).plot(x, y)
        self.canvas.draw()


if __name__ == "__main__":
    app = QApplication(sys.argv)
    window = MainWindow()
    window.show()
    sys.exit(app.exec_())
########################
QQ 3087438119

 浙公网安备 33010602011771号