
matplotlib动态图
matplotlib动态图
matplotlib FuncAnimation
import matplotlib.pyplot as plt
from matplotlib.animation import FuncAnimation
plt.style.use('fivethirtyeight')
#plt.figure(figsize=(12,6))
plt.plot([], [], linewidth=1.0,label='Channel 1')
plt.plot([], [], linewidth=1.0,label='Channel 2')
plt.rcParams['figure.figsize']=(12.0,6.0)
#绘制图表
def updateXY2(self,k):
    print("---1----")
    if len(self.x_arr_data)>self.arr_size:
        #del self.x_arr_data[0]
        #del self.y_arr_data[0]
        self.x_arr_data.pop(0)
        self.y_arr_data.pop(0)
        #print("")
    else:
        print("---2----")
        #for i in len(self.x_arr_data)+1:
        #    self.x_label.append(i)
        self.x_label.append(len(self.x_arr_data))
    print("---3----")
    self.x_arr_data.append(self.index_x_value)
    self.y_arr_data.append(self.index_y_value)

    print("---4----")
    #x1 = []#循环求平均值

    #print(self.x_label)
    #print(self.x_arr_data)
    #print(self.y_arr_data)

    print(len(self.x_label))
    print(len(self.x_arr_data))
    print(len(self.y_arr_data))

    print("---5----")
    #plt.plot(self.x_label, self.x_arr_data, linewidth=1, color="red",label="X")
    #plt.plot(self.x_label, self.y_arr_data, linewidth=1, color="blue",label="Y")
    #plt.show()

    #ln1.set_data(self.x_label, self.x_arr_data)
    # plt对象的get current axex方法, 返回当前绘制对象的axes轴(也相当于一个plt,它有plt对象几乎所有方法,可以直接像plt对象一样使用它)
    ax = plt.gca()
    print(ax.lines)
    # 获得当前绘制的两条曲线对象
    line1, line2,line3,line4 = ax.lines
    # 分别给两条曲线设置其对应的数据(动态刷新)
    line1.set_data(self.x_label, self.x_arr_data)
    line2.set_data(self.x_label, self.y_arr_data)

    np_x_label = np.array(self.x_label)
    np_x_arr = np.array(self.x_arr_data)
    np_y_arr = np.array(self.y_arr_data)

    # 分别求出两条曲线在x,y方向上的最小值和最大值
    xlim_low, xlim_high = ax.get_xlim()
    ylim_low, ylim_high = ax.get_ylim()
    # 重新设置当前最小的x和最大的x(沿着横轴最左端和最右端的数据)--> 横轴最左端(起点)不动,而将横轴最右端的数据增加5也就是实现动态向后移动
    ax.set_xlim(xlim_low, (np_x_label.max() + 5))
    # 获得动态生成数据集数据的当前最大值
    y1max = np_x_arr.max()
    y2max = np_y_arr.max()
    # 用一个临时变量保存动态生成数据集两列下所有数据的最大值
    current_ymax = y1max if (y1max > y2max) else y2max
    # 获得动态生成数据集数据的当前最小值
    y1min = np_x_arr.min()
    y2min = np_y_arr.min()
    # 用一个临时变量保存动态生成数据集两列下所有数据的最小值
    current_ymin = y1min if (y1min < y2min) else y2min
    # 重新设置当前最小的y和最大的y(沿着竖轴最下端和最上端的数据)--> 分别将竖轴最下端的数据和最上端的数据设置成动态数据集中当前最大的数据+5和最小的数据-5(有点难理解....)
    ax.set_ylim((current_ymin - 1), (current_ymax + 1))
    #return ln1
aniX = FuncAnimation(plt.gcf(), self.updateXY2,200, interval=20)
#plt.show()

plt.legend()
plt.tight_layout()
plt.show()
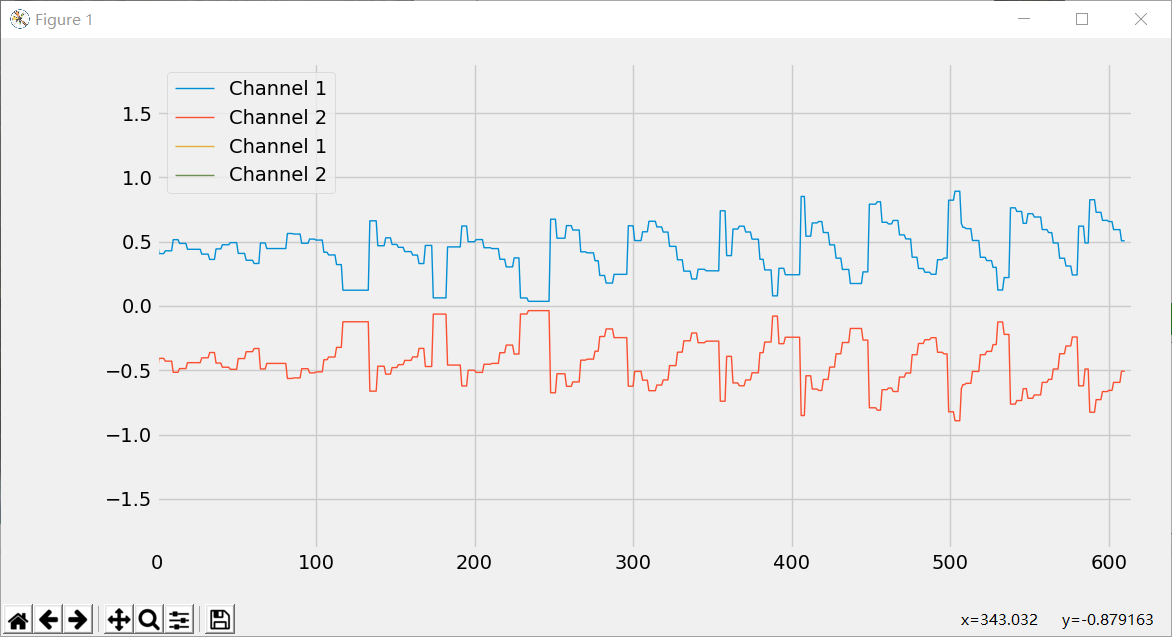
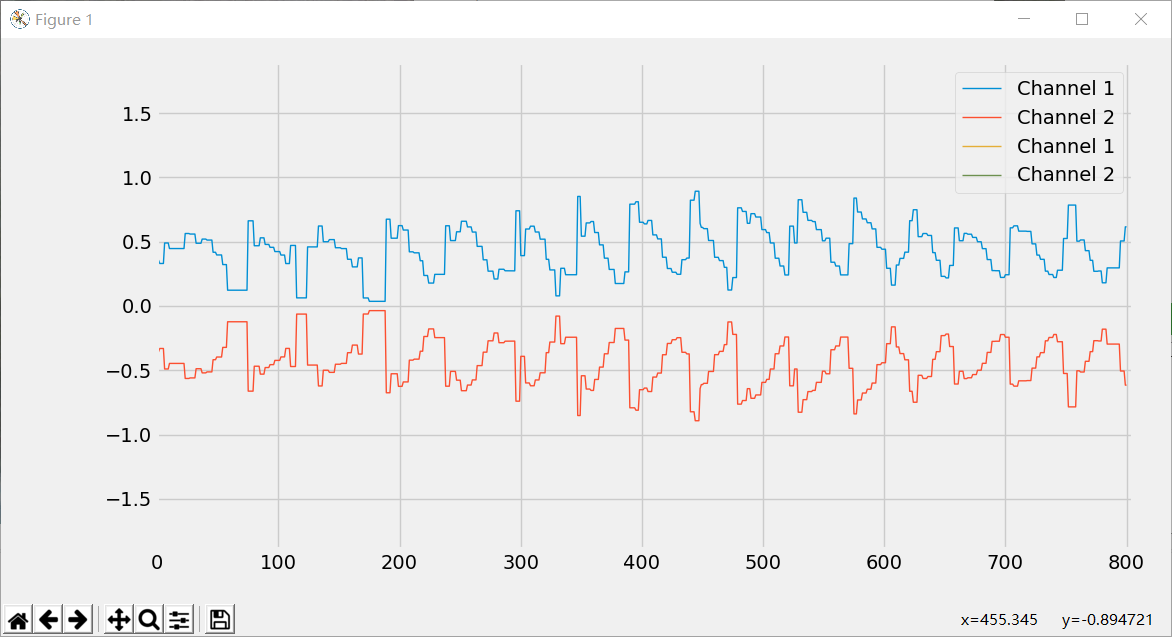
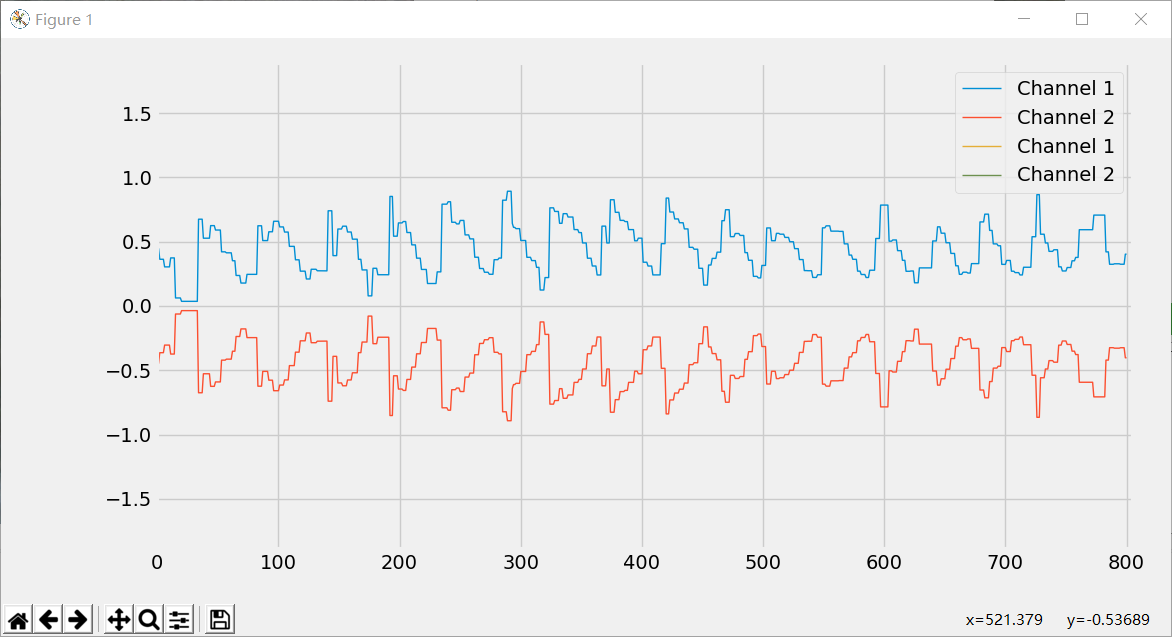
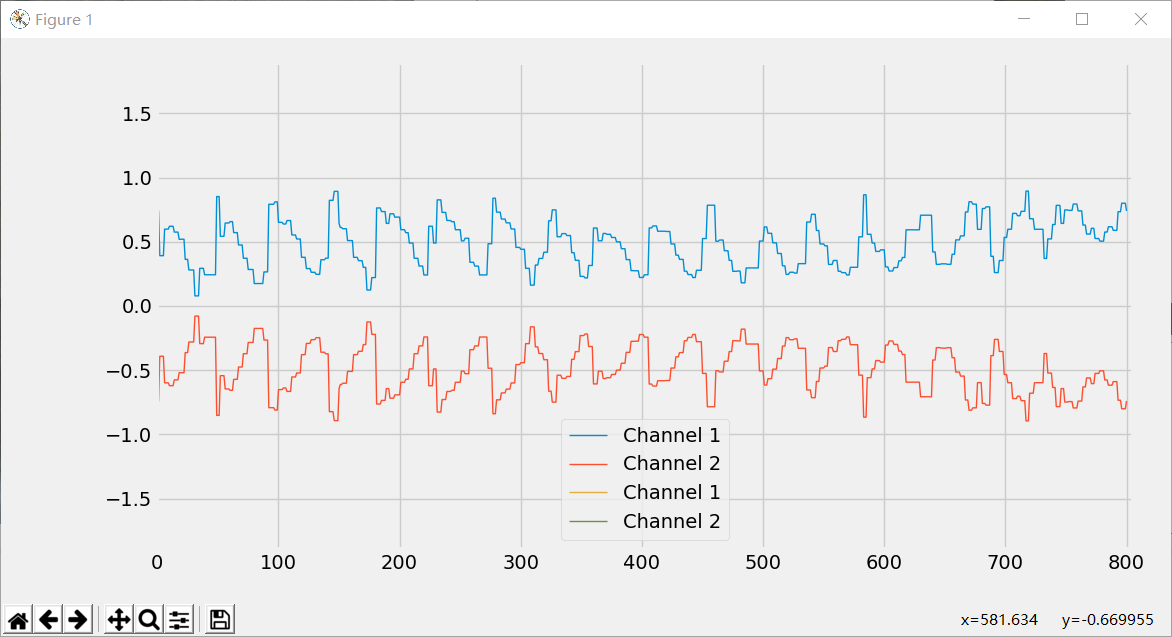
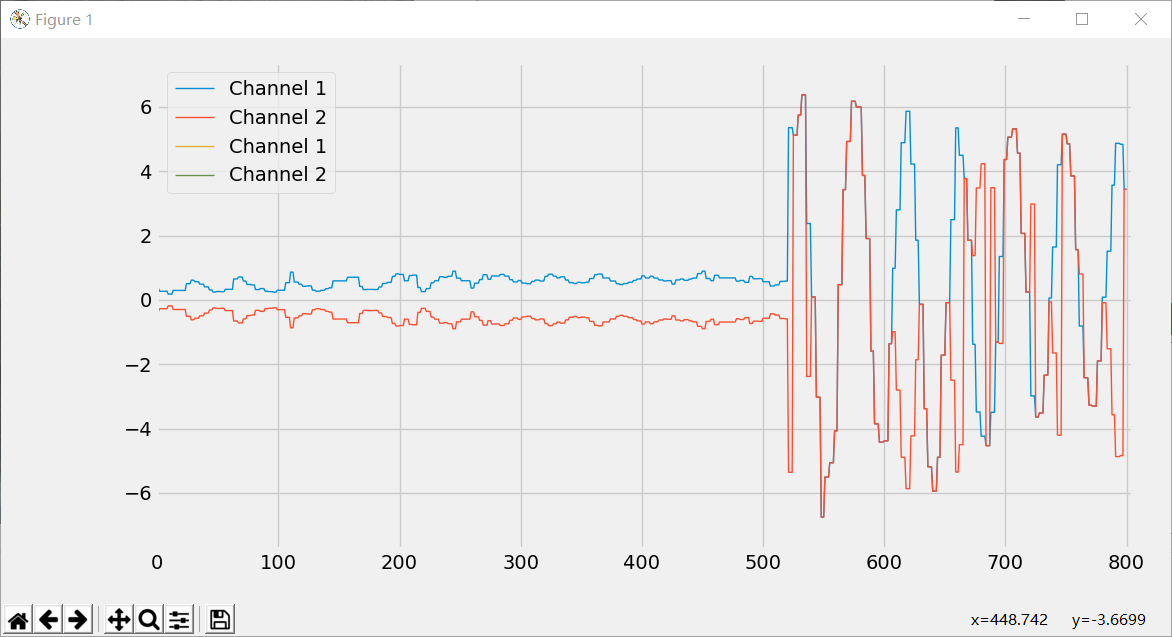
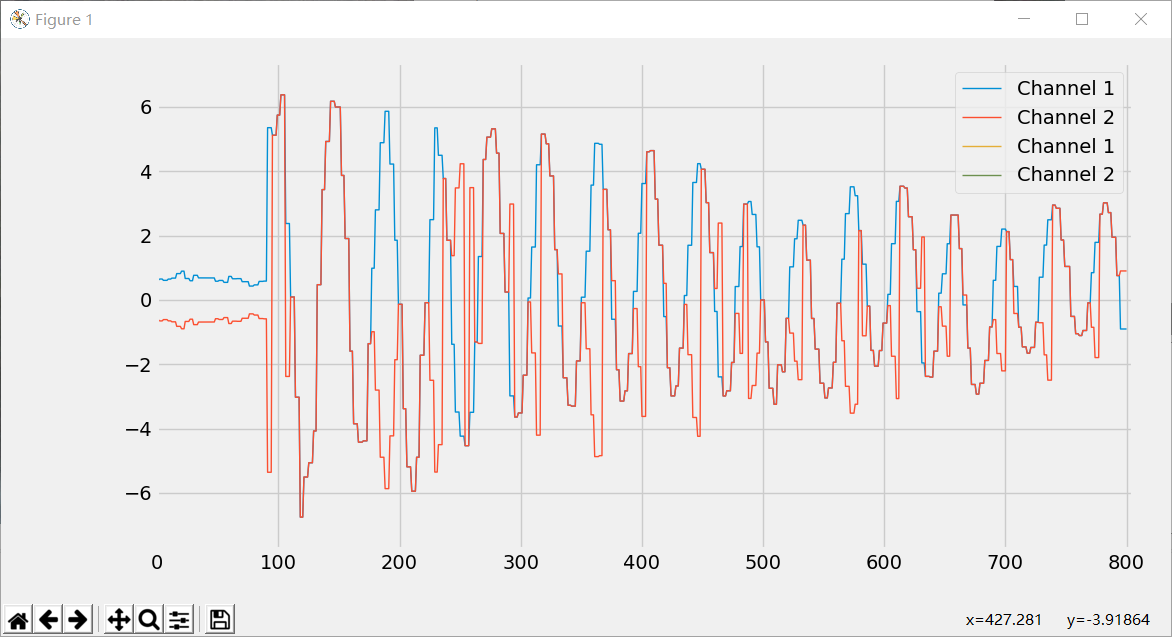
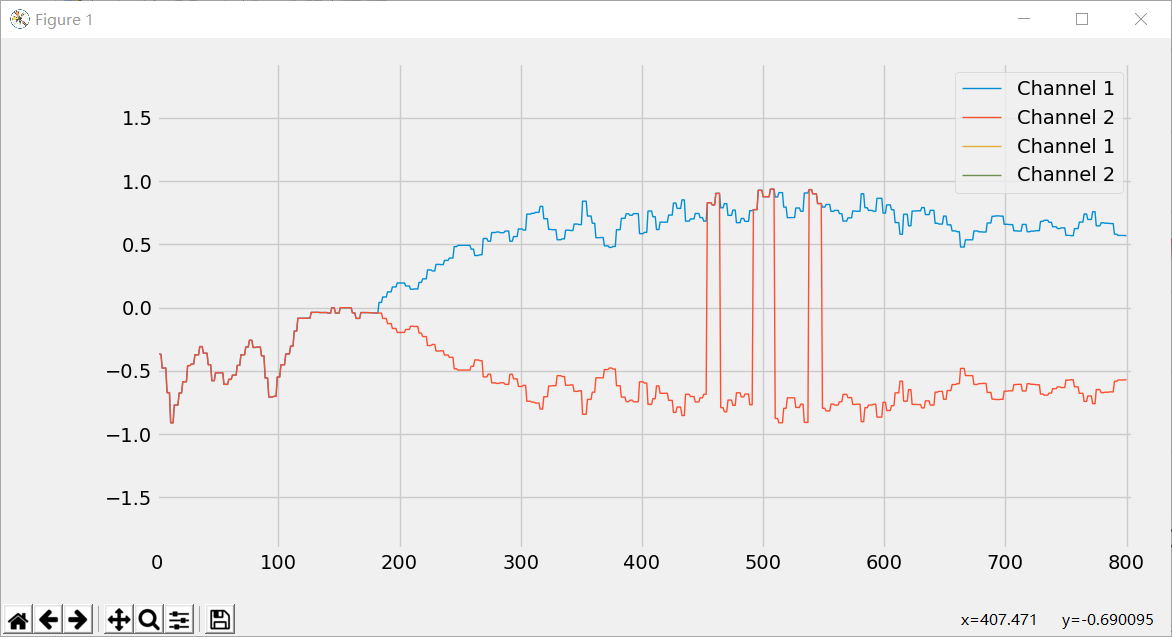
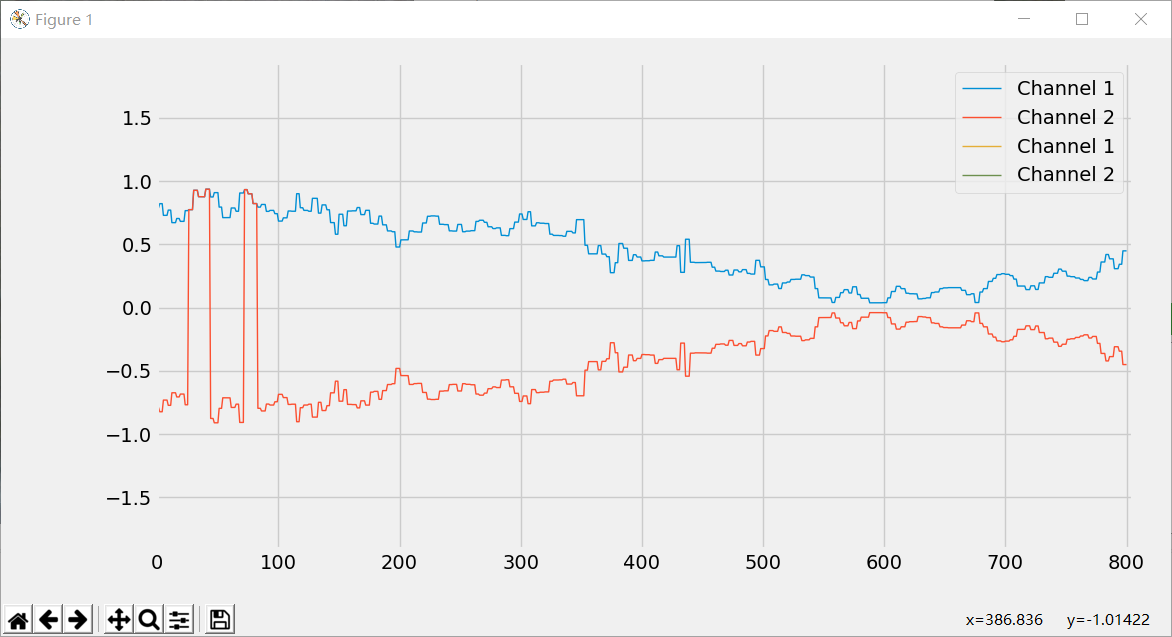
运行效果
参考:https://www.jianshu.com/p/88238e34c689
###################
QQ 3087438119

 浙公网安备 33010602011771号