matlab polarplot 在极坐标中绘制螺线
matlab polarplot 在极坐标中绘制螺线
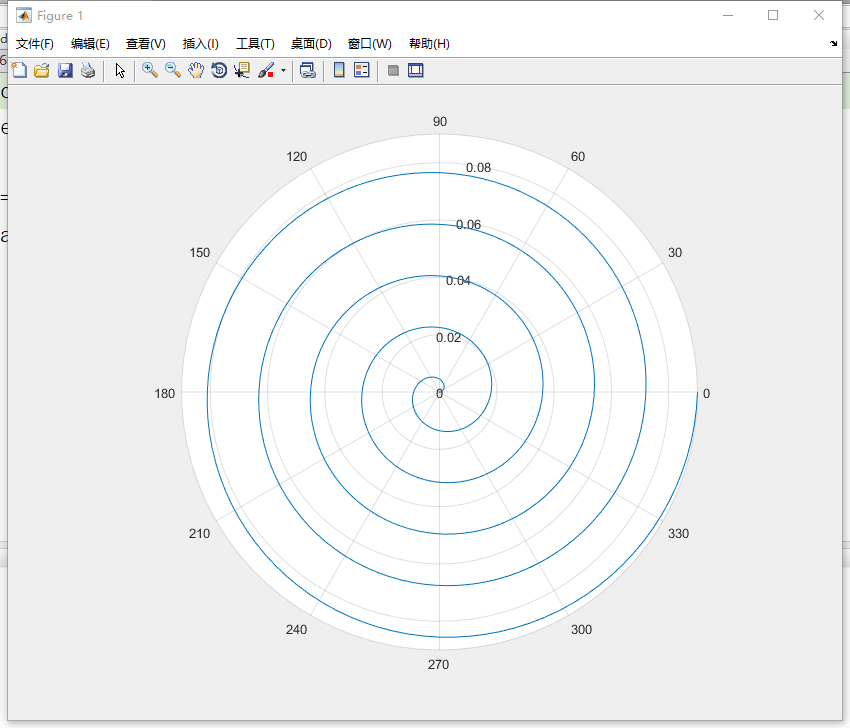
theta = linspace(0,1800,500);
rho = 0.005*theta/100;

theta_radians = deg2rad(theta);
polarplot(theta_radians,rho)
参考:https://ww2.mathworks.cn/help/matlab/ref/polarplot.html
###################################
QQ 3087438119

 浙公网安备 33010602011771号