matlab polarplot 在极坐标中绘制线条
matlab polarplot 在极坐标中绘制线条
函数:
function h = polarplot(varargin)
%POLARPLOT   Polar plot.
%   POLARPLOT(TH,R) plots vector TH vs R. The values in TH
%   are in radians. If TH or R is a matrix, then the vector
%   is plotted versus the rows or columns of the matrix,
%   whichever line up.
%
%   POLARPLOT(R) plots radial values R spread equally around
%   the circle from 0 to 2pi.
%
%   POLARPLOT(Z) if Z is complex plots TH=angle(Z) and R=abs(Z).
%
%   POLARPLOT(TH,R,S) plots with line specification S.
%
%   POLARPLOT(TH1,R1,S1,TH2,R2,S2,...) combines the plots defined
%   by the (TH,R,S) triples.
%
%   POLARPLOT(AX,...) plots into the axes with handle AX.
%
%   POLARPLOT returns a column vector of handles to lineseries objects, one
%   handle per plotted line.
%
%   The TH,R pairs, or TH,R,S triples, can be followed by
%   parameter/value pairs to specify additional properties
%   of the lines. For example, POLARPLOT(TH,R,'LineWidth',2,'Color',[.6 0 0])
%   will create a plot with a dark red line width of 2 points.
%
%   Example
%      t = 0 : .01 : 2*pi;
%      polarplot(t, sin(2*t).*cos(2*t), '--r');
%
%   See also: RLIM, POLARAXES, PLOT

%   Copyright 2015 The MathWorks, Inc.

[cax, args] = axescheck(varargin{:});
if ~isempty(cax) && ~isa(cax, 'matlab.graphics.axis.PolarAxes')
    error(message('MATLAB:polarplot:AxesInput'));
end
try
    cax = matlab.graphics.internal.prepareCoordinateSystem('polar', cax);

    % check for polarplot(R,...) or polarplot(Z,...)
    nargs = length(args);
    if nargs > 0
        if nargs == 1 || ischar(args{2})
            R = args{1};
            if isvector(R)
                m = length(R);
            else
                m = size(R,1);
            end
            if isreal(R)
                TH = linspace(0,2*pi,m);
            else
                Z = double(R);
                TH = angle(Z);
                R = abs(Z);
            end
            args = {TH,R,args{2:end}};
        end
    end

    obj = plot(cax, args{:});
catch e
    throwAsCaller(e);
end

if nargout > 0
    h = obj;
end
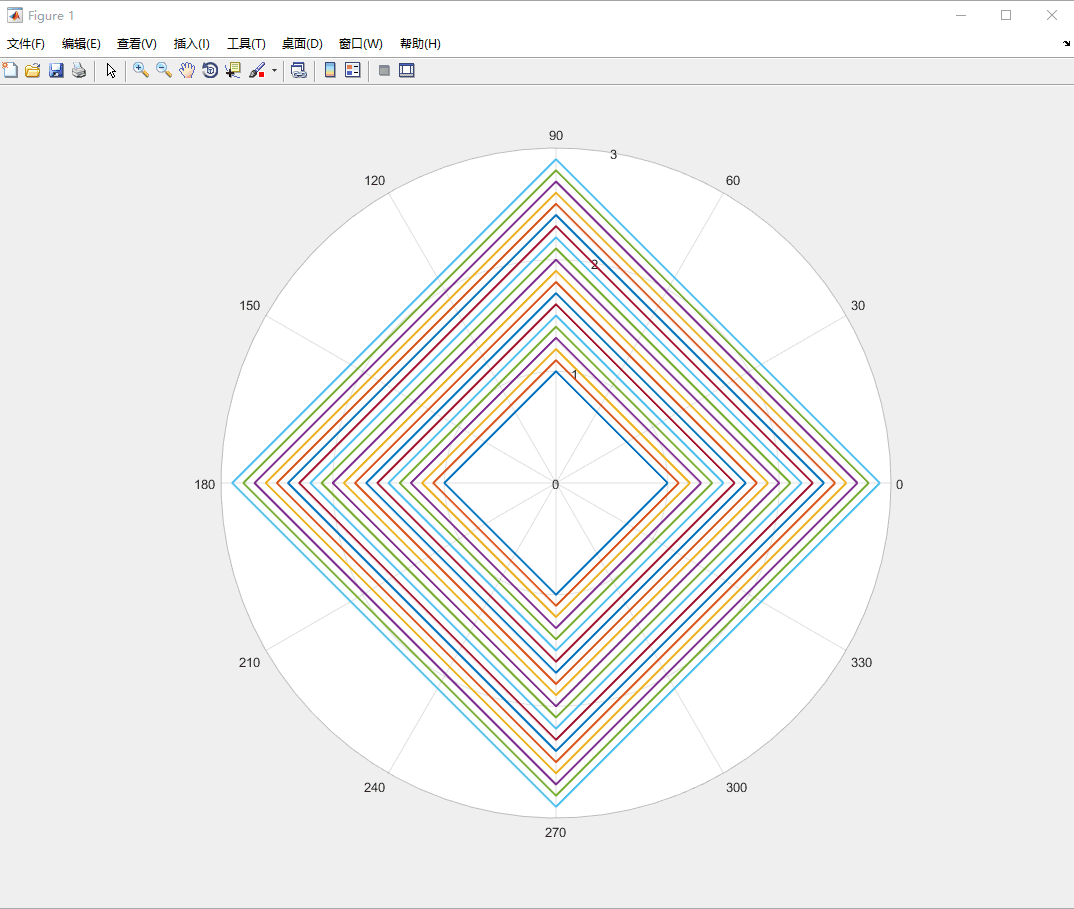
案例:
theta = linspace(0,2*pi,5);
rho = 1+0.3*sin(20*theta)+0.1*sin(30*theta)+0.1*sin(40*theta);
polarplot(theta,rho,theta,1.1*rho,theta,1.2*rho,theta,1.3*rho,theta,1.4*rho,theta,1.5*rho,theta,1.6*rho,theta,1.7*rho,theta,1.8*rho,theta,1.9*rho,...
    theta,2.0*rho,theta,2.1*rho,theta,2.2*rho,theta,2.3*rho,theta,2.4*rho,theta,2.5*rho,theta,2.6*rho,theta,2.7*rho,theta,2.8*rho,theta,2.9*rho,'linewidth',1.5);
参考:https://ww2.mathworks.cn/help/matlab/ref/polarplot.html
###################################
QQ 3087438119

 浙公网安备 33010602011771号