Plotly图形绘制:基础篇
想上手一款Python数据可视化库来给你的数据分析结果绘制一系列赏心悦目的图表?是时候了解一下交互式可视化库Plotly了。
Plotly介绍

Plotly包是一个基于plotly.js (而plotly.js又基于d3.js)的开源交互式图形绘制Python包,可以生成离线html格式(能在浏览器中显示)的交互式图表,或者保存结果在云端服务器(https://plotly.com/)以便在线查看,共享。
Plotly本身也是一家主要提供机器学习和数据科学模型前端图形显示产品的公司。Plotly包提供了数十种高质量,交互式图表类型,详见https://plotly.com/python/。
下面举例说明几种个人比较常用的图表:
1. 散点图
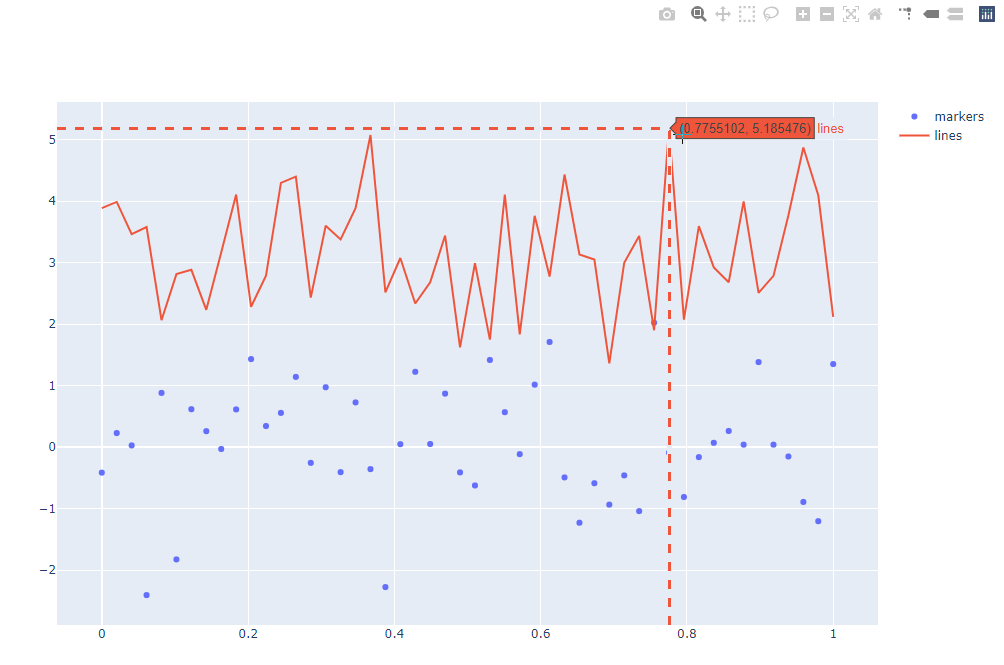
生成两组正态分布随机数作散点图和折线图
import pandas as pd
import numpy as np
from plotly.offline import plot as plot_ly
import plotly.graph_objs as go
N = 50
random_x = np.linspace(0, 1, N)
random_y0 = np.random.randn(N)
random_y1 = np.random.randn(N) +3
trace0 = go.Scatter( x = random_x, y = random_y0, mode = 'markers', name = 'markers')
trace1 = go.Scatter( x = random_x, y = random_y1, mode = 'lines', name = 'lines')
#mode还可以是markers+lines
data = [trace0, trace1]
plot_ly(data, filename='./Scatter.html') #生成结果为Scatter.html
2.双轴图
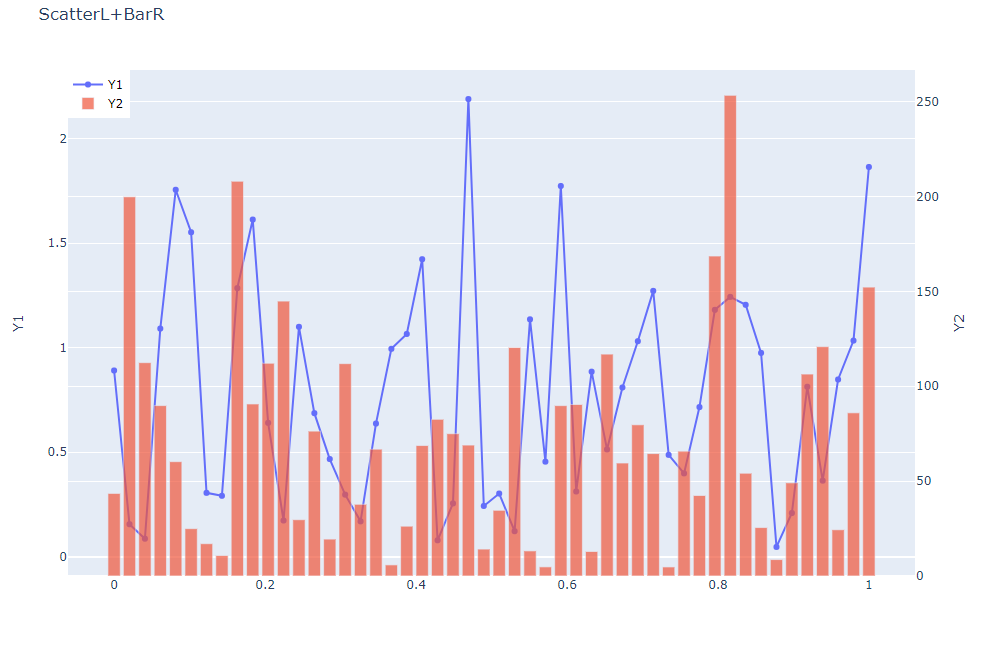
类似于上例的数据,我们稍作修改以生成另一个类型的图标
random_y0 = abs(np.random.randn(N))
random_y1 = abs(np.random.randn(N)) * 100
trace0 = go.Scatter(x=random_x, y=random_y0, mode='lines+markers', name='Y1')
trace1 = go.Bar(x=random_x, y=random_y1, name='Y2', yaxis="y2",opacity=0.7) #柱状图对象y轴为y2, 图形透明度为0.7
data = [trace0, trace1]
layout = go.Layout(title="ScatterL+BarR",
yaxis=dict(title="Y1"),
yaxis2=dict(title="Y2", overlaying='y', side="right"),
legend=dict(x=0, y=1, font=dict(size=12, color="black"))) #设置标题及字体
fig = go.Figure(data=data, layout=layout)
plot_ly(fig, filename='bar.html')
3.环形饼图
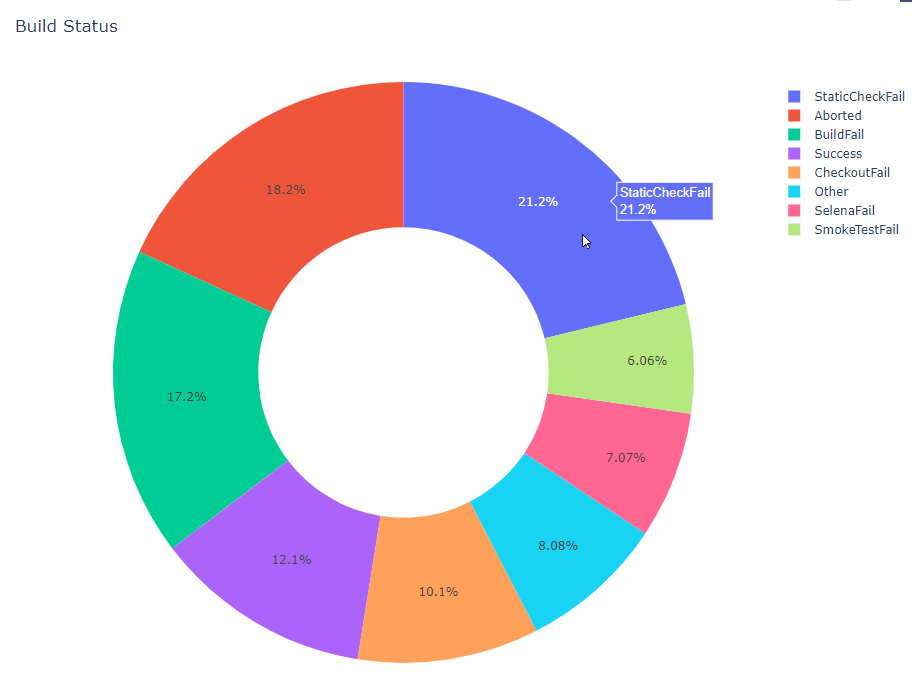
labels = ['BuildFail','Aborted','Success','SmokeTestFail','SelenaFail','Other','CheckoutFail','StaticCheckFail']
values = [17,18,12,6,7,8,10,21]
trace = [go.Pie( labels = labels, values = values, hole = 0.5,
hoverinfo = "label + percent")] #hole即为中间洞的大小,hoverinfo为鼠标悬停在图表上显示的内容
layout = go.Layout( title = 'Build Status' )
fig = go.Figure(data = trace, layout = layout)
plot_ly(fig, filename='pie.html')
4.旭日图
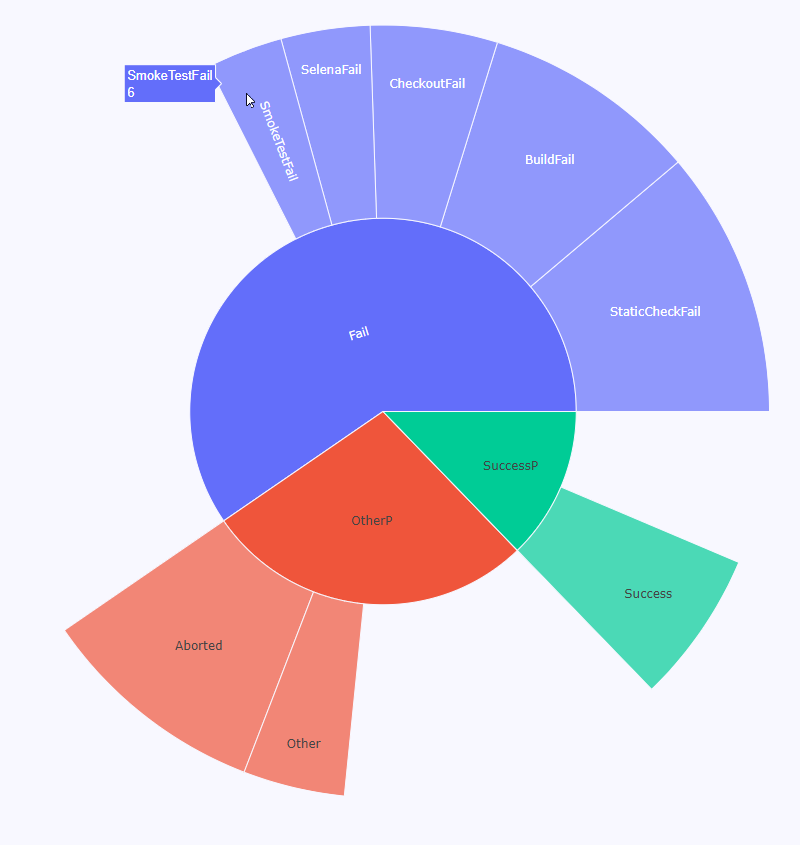
基于上例的数据稍作修改,我们就可以做出旭日图
labels = ['BuildFail','Aborted','Success','SmokeTestFail','SelenaFail','Other','CheckoutFail','StaticCheckFail','Fail','OtherP','SuccessP']
parents = ['Fail','OtherP','SuccessP','Fail','Fail','OtherP','Fail','Fail','','','']
values = [17,18,12,6,7,8,10,21,51,26,12]
trace = [go.Sunburst (
labels = labels,
parents = parents,
values = values)]
layout=go.Layout( plot_bgcolor='#E6E6FA',paper_bgcolor='#F8F8FF')
fig = go.Figure(data = trace, layout = layout)
plot_ly(fig, filename='Sunburst.html')
旭日图为是饼图的拓展,点击父级可以仅展示该父级及其子集。
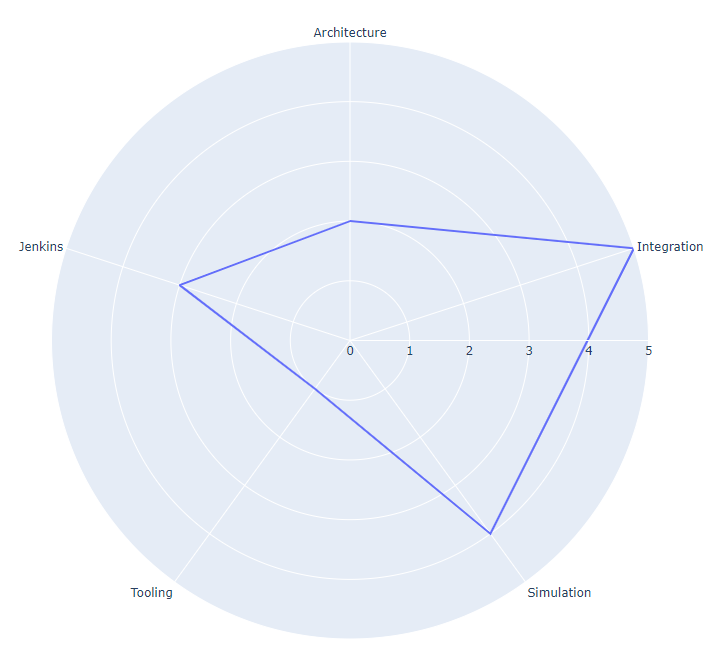
5. 雷达图
import plotly.express as px #plotly.express是对plotly.py的高级封装,可以为复杂的图表提供简单的语法
import pandas as pd
df = pd.DataFrame(dict(
r=[2, 5, 4, 1, 3],
theta=['Architecture','Integration','Simulation', 'Tooling', 'Jenkins']))
fig = px.line_polar(df, r='r', theta='theta', line_close=True)
plot_ly(fig, filename='radar.html')
总结
以上的例子演示的都是离线下的Plotly作图,如果需要在线绘图只需多一个注册免费账号获取API key的步骤,这里不做展开。Plotly无疑是我目前用过的Python图形包中可视化效果最好,功能最齐全,语法最简单的一款。希望它能帮到你。:)


【推荐】国内首个AI IDE,深度理解中文开发场景,立即下载体验Trae
【推荐】编程新体验,更懂你的AI,立即体验豆包MarsCode编程助手
【推荐】抖音旗下AI助手豆包,你的智能百科全书,全免费不限次数
【推荐】轻量又高性能的 SSH 工具 IShell:AI 加持,快人一步
· AI与.NET技术实操系列:向量存储与相似性搜索在 .NET 中的实现
· 基于Microsoft.Extensions.AI核心库实现RAG应用
· Linux系列:如何用heaptrack跟踪.NET程序的非托管内存泄露
· 开发者必知的日志记录最佳实践
· SQL Server 2025 AI相关能力初探
· 震惊!C++程序真的从main开始吗?99%的程序员都答错了
· 【硬核科普】Trae如何「偷看」你的代码?零基础破解AI编程运行原理
· 单元测试从入门到精通
· 上周热点回顾(3.3-3.9)
· winform 绘制太阳,地球,月球 运作规律