服务器监控系统Prometheus(普罗米修斯)+可视化工具Grafana
一 Prometheus完全笔记
Prometheus 是一个开源监控系统它前身是 SoundCloud的告警工具包。从 2012 年开始许多公司和组织开始使用 Prometheus。该项目的开发人员和用户社区非常活跃越来越多的开发人员和用户参与到该项目中。目前它是一个独立的开源项目且不依赖于任何公司。为了强调这点和明确该项目治理结构Prometheus 在 2016 年继Kurberntes 之后加入了 Cloud Native Computing Foundation。
1.1 Prometheus核心概念
Prometheus 是一个开源的服务监控系统和时间序列数据库,Promietheus从根本上存储的所有数据都是时间序列数据Time Serie Data简称时序数据.
1.2 Prometheus运行流程
Prometheus架构图
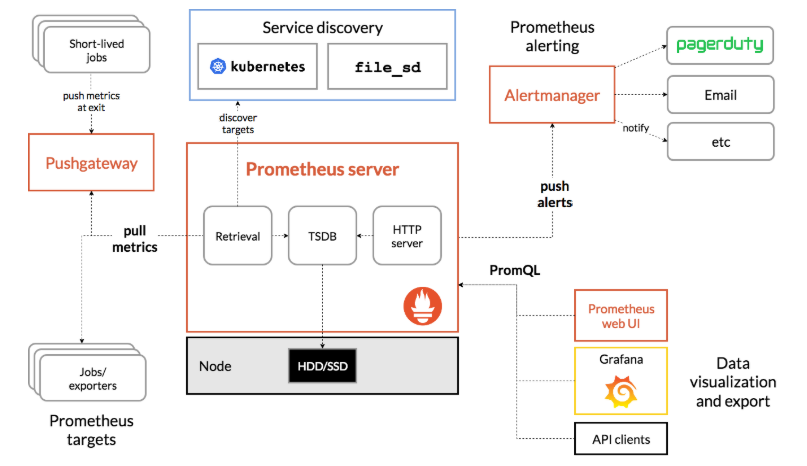
Prometheus根据配置定时去拉取各个节点的数据,默认使用的方式是pull,也可以使用pushgateway提供的push方式获取各个监控节点的数据。Prometheus将获取到的数据存入TSDB,一款时序型数据库。此时prometheus已经获取到了监控数据,可以使用内置的PromQL进行查询。它的报警功能使用Alertmanager提供,Alertmanager是prometheus的告警管理和发送报警的一个组件。prometheus原生的图标功能过于简单,可将prometheus数据接入grafana,由grafana进行统一管理。
二 Grafana概念
Grafana是一个跨平台的开源的度量分析和可视化工具,可以通过将采集的数据查询然后可视化的展示,并及时通知。它主要有以下六大特点:
1、展示方式:快速灵活的客户端图表,面板插件有许多不同方式的可视化指标和日志,官方库中具有丰富的仪表盘插件,比如热图、折线图、图表等多种展示方式;
2、数据源:Graphite,InfluxDB,OpenTSDB,Prometheus,Elasticsearch,CloudWatch和KairosDB等;
3、通知提醒:以可视方式定义最重要指标的警报规则,Grafana将不断计算并发送通知,在数据达到阈值时通过Slack、PagerDuty等获得通知;
4、混合展示:在同一图表中混合使用不同的数据源,可以基于每个查询指定数据源,甚至自定义数据源;
5、注释:使用来自不同数据源的丰富事件注释图表,将鼠标悬停在事件上会显示完整的事件元数据和标记;
6、过滤器:Ad-hoc过滤器允许动态创建新的键/值过滤器,这些过滤器会自动应用于使用该数据源的所有查询
官网地址:Grafana
官方文档:Grafana文档
理论性的东西不说太多了,下面开始安装部署,这里我们使用windows docker来安装Prometheus和Grafana。
1.拉取镜像
docker pull prom/prometheus
docker pull grafana/grafana
2.配置Prometheus运行所需要的的配置文件,如下
# my global config
global:
  scrape_interval:     15s # Set the scrape interval to every 15 seconds. Default is every 1 minute.
  evaluation_interval: 15s # Evaluate rules every 15 seconds. The default is every 1 minute.
  # scrape_timeout is set to the global default (10s).

# Alertmanager configuration
alerting:
  alertmanagers:
  - static_configs:
    - targets:
      # - alertmanager:9093

# Load rules once and periodically evaluate them according to the global 'evaluation_interval'.
rule_files:
  # - "first_rules.yml"
  # - "second_rules.yml"

# A scrape configuration containing exactly one endpoint to scrape:
# Here it's Prometheus itself.
scrape_configs:
  # The job name is added as a label `job=<job_name>` to any timeseries scraped from this config.
  - job_name: 'prometheus'

    # metrics_path defaults to '/metrics'
    # scheme defaults to 'http'.

    static_configs:
    - targets: ['localhost:9090']


  - job_name: 'processmetrice'
    metrics_path: '/metrics'
    static_configs:
    - targets: ['127.0.0.1:8081']
配置文件最后的- job_name下面的metrics_path路径代表获取时序话数据的路径,static_configs代表将要监控的服务ip和端口号,如上所标识的接口为http://127.0.0.1:8081/metrics,默认的scheme为http。
3.使用容器启动Prometheus
docker run  -d   -p 9090:9090   -v /opt/prometheus/prometheus.yml:/etc/prometheus/prometheus.yml    prom/prometheus
(注意这里 -v挂载的内容,如果是windows系统,则冒号左边的路径为实际的prometheus.yml的存放路径,这里代表将配置文件挂载到本地的H:\prometheus路径下,只需要修改本地的配置文件重启容器即可生效,如
docker run  -d   -p 9090:9090   -v H:\prometheus\prometheus.yml:/etc/prometheus/prometheus.yml    prom/prometheus)
4.使用容器启用Grafana
docker run -d   -p 3000:3000   --name=grafana   -v /opt/grafana-storage:/var/lib/grafana   grafana/grafana
(这里同理,如果是windows docker安装,则以实际的物理路径为准)
5.本地打开9090端口,http://127.0.0.1:9090,在菜单栏中打开status/Targets,如下图所示

可以看到有相关记录,注意我这里在prometheus.yml中配置的地址是IPV4地址,也可以是127.0.0.1,
6.接着,访问 3000 端口,打开 Grafana,初始账号密码都是 admin
7.配置Grafana
7.1 首先我们要为 Grafana 获取 Prometheus 中的监控数据,我们要添加一个数据源,选择工具图标 Configuration/Data Sources
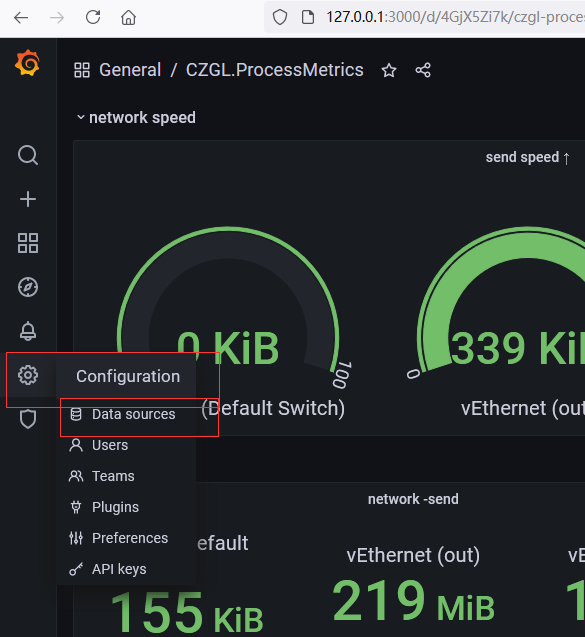
在Plugins里面选择Prometheus

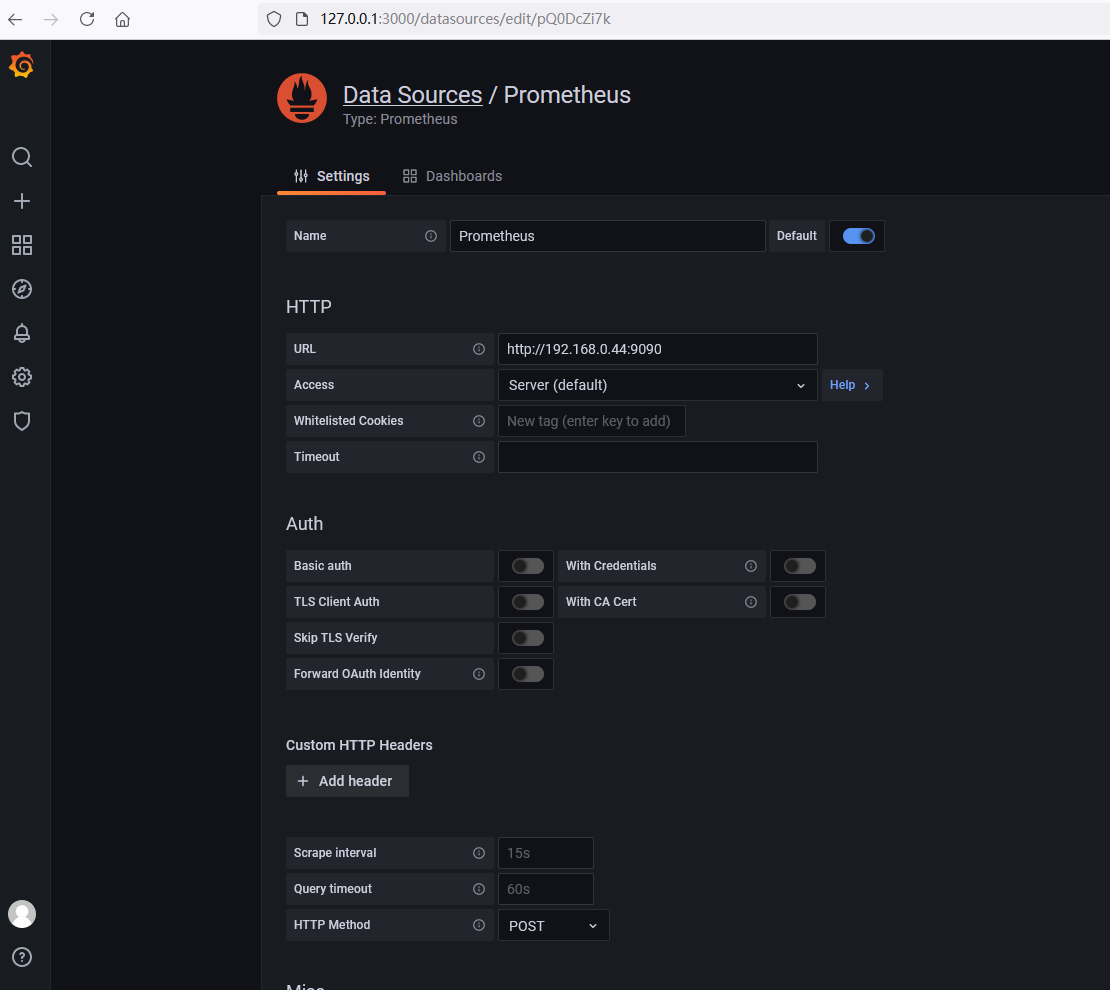
填写好HTTP/URL,点击下面的Save按钮
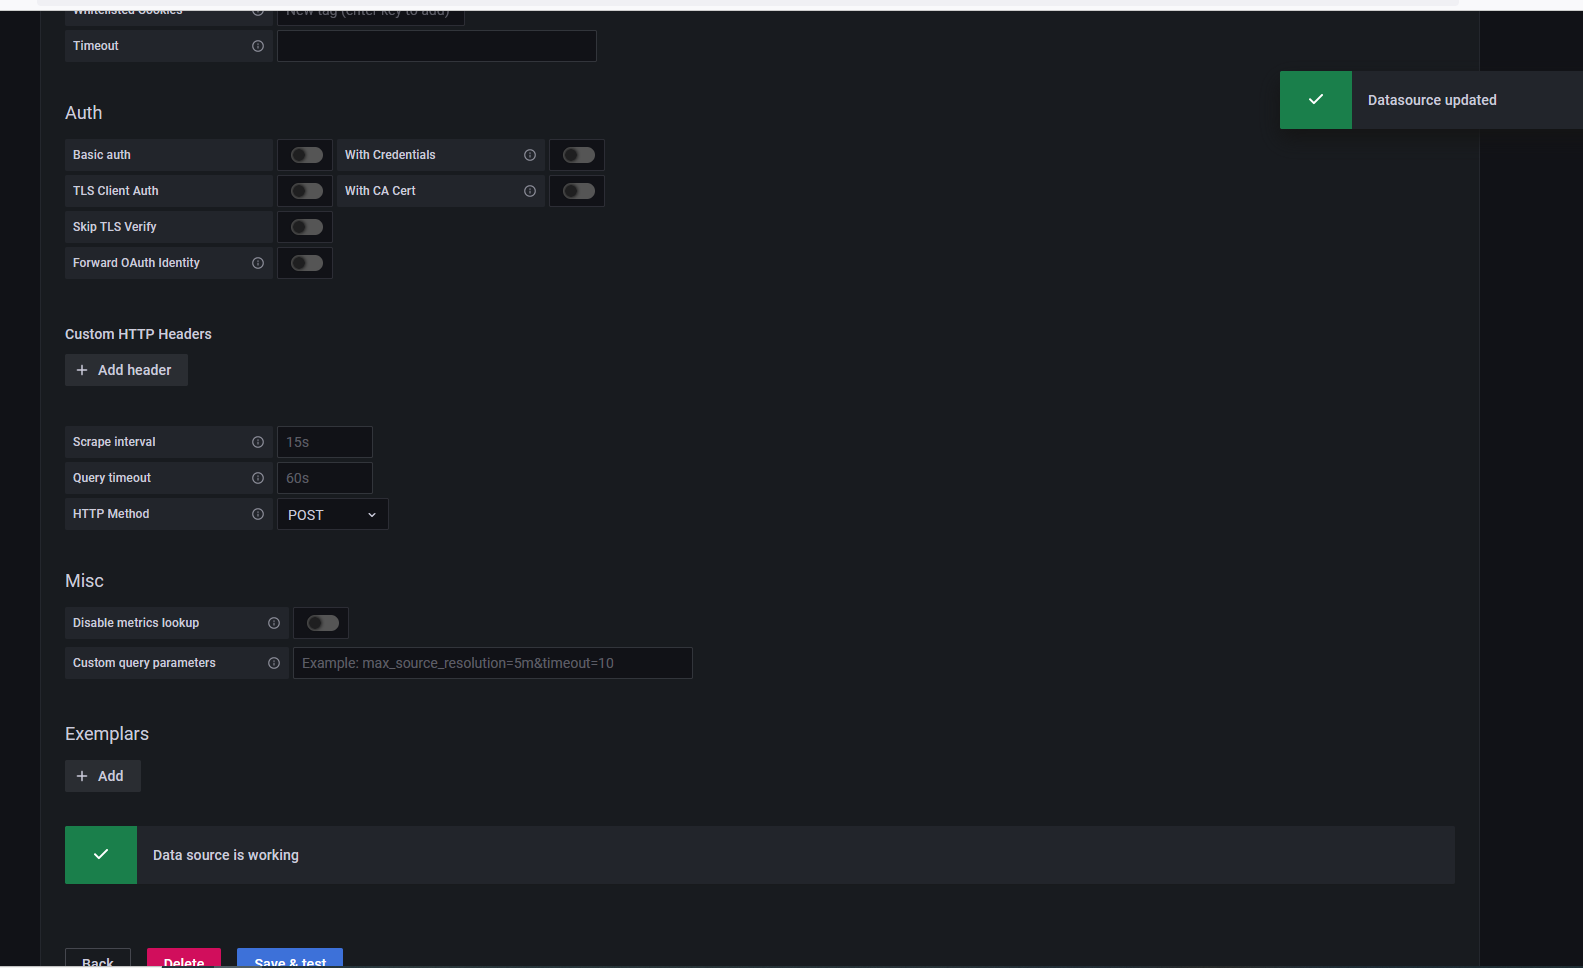
导入时序模化数据模板
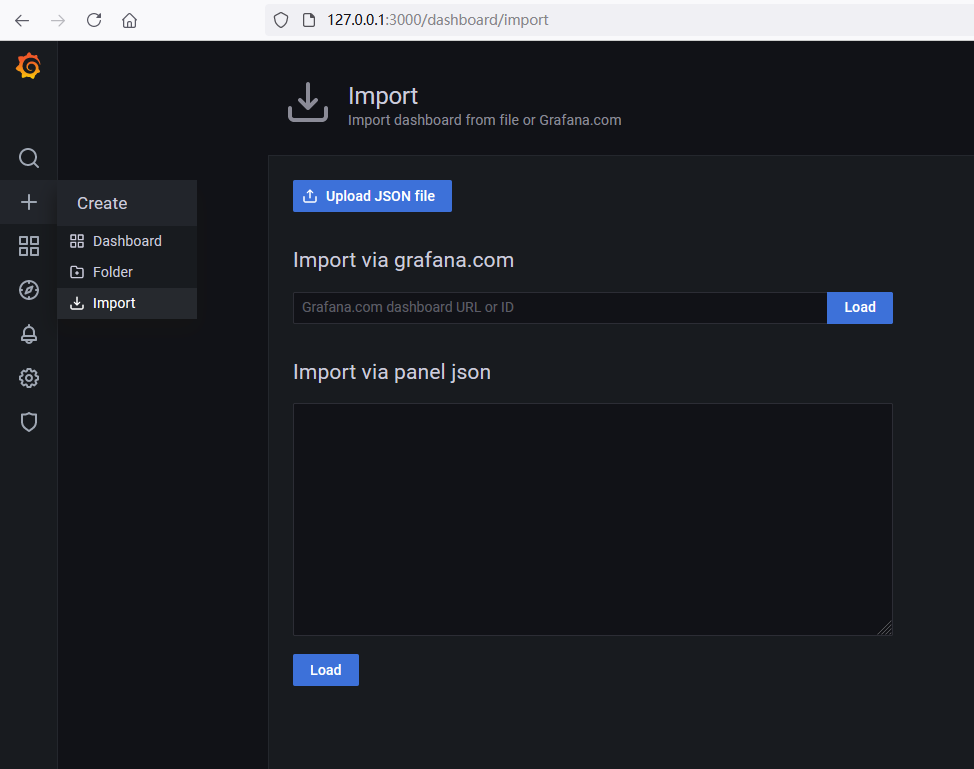
接着下载笔者百度的时序化数据JSON模板,然后导入,既可看到监控界面。
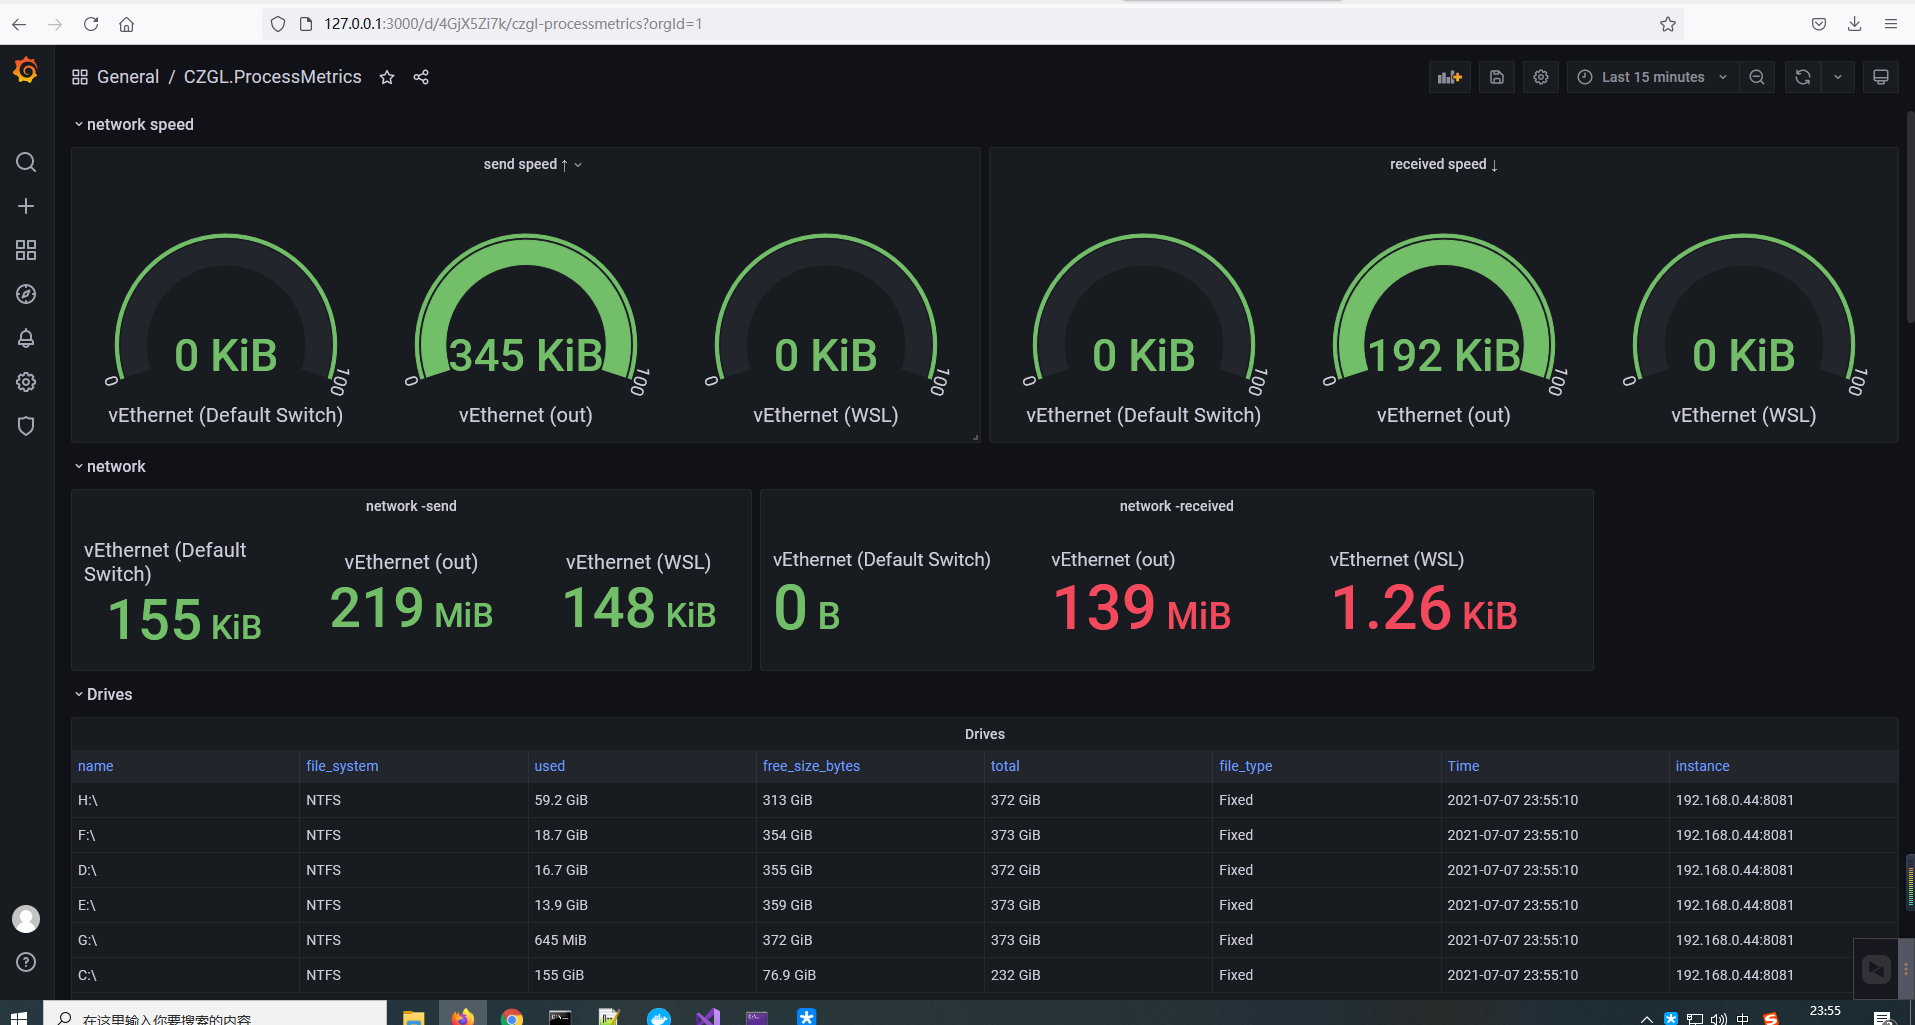
最终效果图:
本文来自博客园,作者:可乐加冰-Mr-Wang,转载请注明原文链接:https://www.cnblogs.com/helloworld-wang/p/14984243.html

