『科学计算』最小二乘法
最小二乘法
线性最小二乘的基本公式
考虑超定方程组(超定指未知数小于方程个数):


显然该方程组一般而言没有解,所以为了选取最合适的
 让该等式"尽量成立",引入残差平方和函数S
当
 时,
时,
 取最小值,记作:
实质:m维空间点向n维空间的子空间的投影坐标,如下,向量空间A向C的投影就是点B。
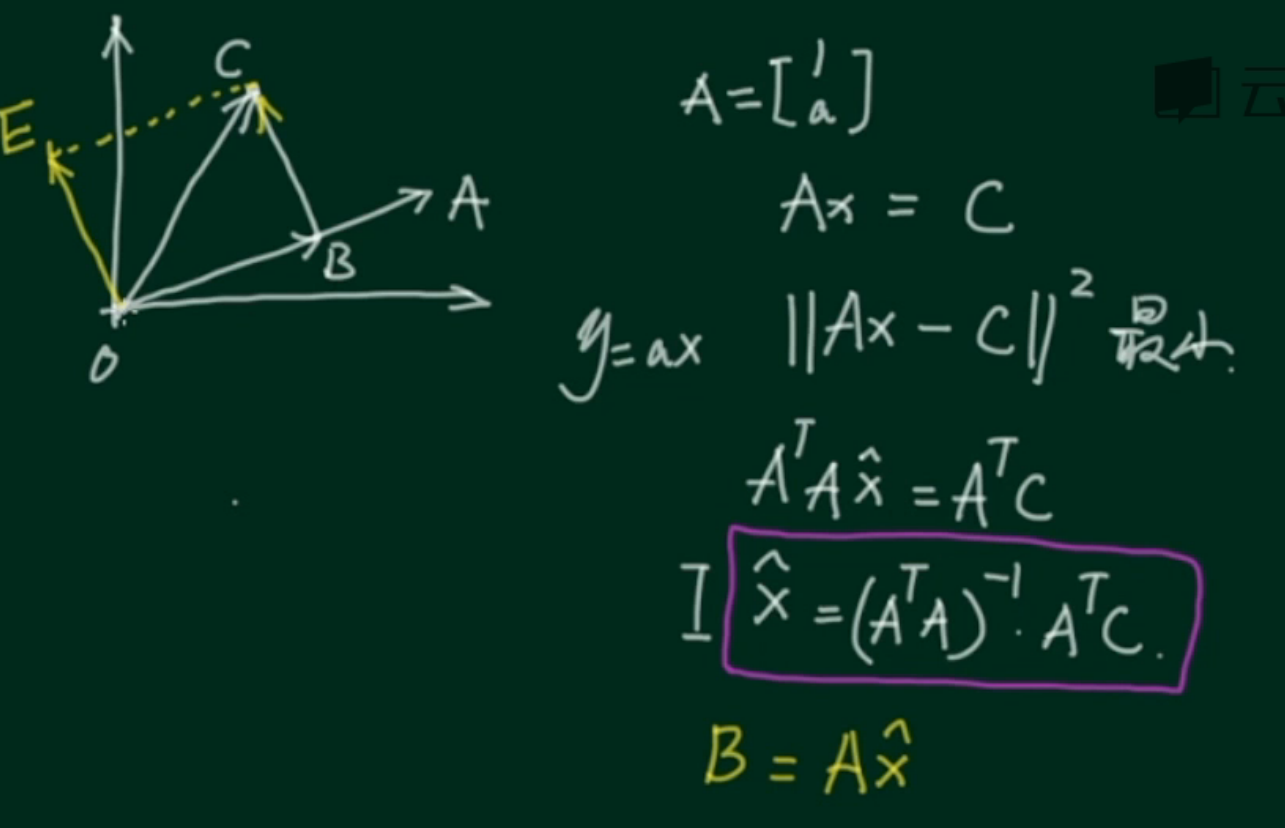
拟合示意,最后得出来系数向量x,利用已知矩阵A乘上x,可以得出拟合后直线上的点集b向量,用于绘图即可:

作业一
已知A(3,1),C(1,3)求垂足B的坐标。
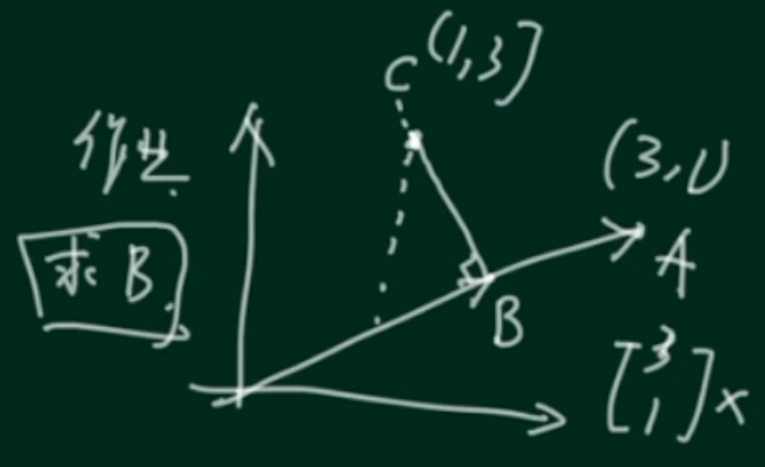
利用向量的垂直关系:
利用向量BC垂直于向量OA,且B在直线OA上两个已知条件,利用方程求解B点的坐标。
import numpy as np

def solve_point(a=[3,1], c=[1,3]):
    b=[]
    b.append((pow(a[0],2)*c[0] + a[0]*a[1]*c[1])/np.sum(np.square(a)))
    b.append((a[0]*a[1]*c[0] + pow(a[1],2)*c[1])/np.sum(np.square(a)))
    return b
solve_point()
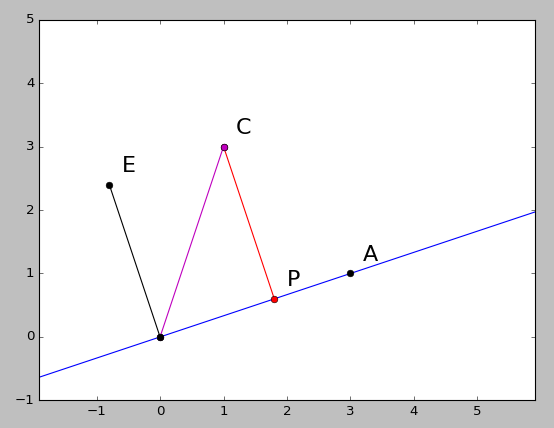
利用最小二乘法:
注意如果不使用dot(矩阵乘法)的话,那么*乘法是numpy的广播乘法。
import numpy as np
import matplotlib.pyplot as plt

A = np.array([[3],[1]])
C = np.array([[1],[3]])

B = A.dot(np.linalg.inv(A.T.dot(A)).dot(A.T.dot(C)))
E = C - B

fig = plt.figure()
ax = fig.add_subplot(111)
ax.axis('equal')
ax.set_xlim(-1,5)

# 绘制直线OA
x = np.linspace(-1,5,6)
l = x * A
ax.plot(l[0,:],l[1,:])

# 绘制点
ax.plot(A[0],A[1],'ko')
ax.plot([C[0],B[0]],[C[1],B[1]],'r-o')
ax.plot([0,C[0]],[0,C[1]],'m-o')
ax.plot([0,E[0]],[0,E[1]],'k-o')

margin = 0.2
ax.text(A[0]+margin, A[1]+margin, "A",fontsize=20)
ax.text(C[0]+margin, C[1]+margin, "C",fontsize=20)
ax.text(B[0]+margin, B[1]+margin, "P",fontsize=20)
ax.text(E[0]+margin, E[1]+margin, "E",fontsize=20)
作业二
最小二乘法拟合二维点
线性拟合:
import numpy as np
import matplotlib.pyplot as plt

x = np.arange(-1,1,0.02)
y = 2*np.sin(x*2.3)+0.5*x**3

y1 = y+0.5*(np.random.rand(len(x))-0.5)


##################################
# 写下你的Code
A = np.vstack((x, np.ones(len(x)))).T
print(A)
b = y.T
print(b)

def projection(A,b):
    ####
    # return A*inv(AT*A)*AT*b
    ####
    return A.dot(np.linalg.inv(A.T.dot(A)).dot(A.T.dot(b)))

yw = projection(A,b)
##################################

plt.plot(x,y,color='g',linestyle='-',marker='')
plt.plot(x,y1,color='m',linestyle='',marker='o')

# 把拟合的曲线在这里画出来
plt.plot(x,yw,color='r',linestyle='',marker='.')

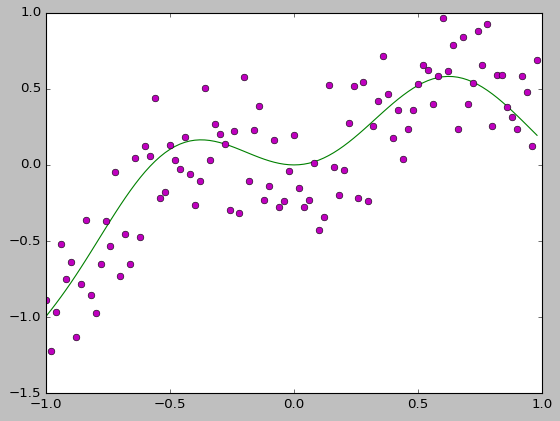
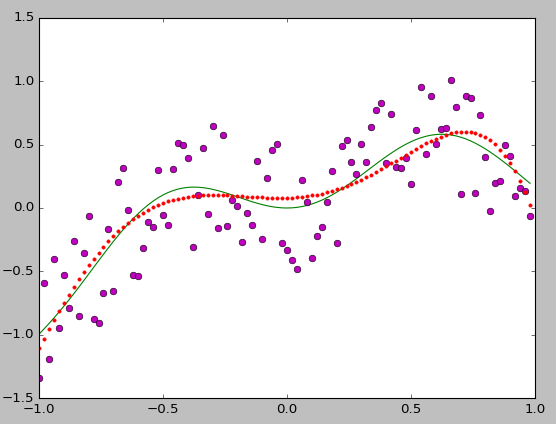
扩展,多项式拟合:
import numpy as np
import matplotlib.pyplot as plt

x = np.arange(-1,1,0.02)
y = ((x*x-1)**3+1)*(np.cos(x*2)+0.6*np.sin(x*1.3))

y1 = y+(np.random.rand(len(x))-0.5)

##################################
### write your code to gen A,b
m = []
for i in range(6):
    m.append(x**(i))

# A =
# [[x1^6,x1^5...],
#  [x2^6,x2^5...],
#  ... ...]

A = np.array(m).T
b = y.T
##################################

def projection(A,b):
    ####
    # return A*inv(AT*A)*AT*b
    ####
    AA = A.T.dot(A)
    w=np.linalg.inv(AA).dot(A.T).dot(b)
    print(w)
    return A.dot(w)

yw = projection(A,b)
#yw.shape = (yw.shape[0],)

plt.plot(x,y,color='g',linestyle='-',marker='')
plt.plot(x,y1,color='m',linestyle='',marker='o')
plt.plot(x,yw,color='r',linestyle='',marker='.')



 浙公网安备 33010602011771号