import numpy as np
from matplotlib import pyplot as plt
from matplotlib import animation
fig, ax = plt.subplots()
x = np.arange(0, 2*np.pi, 0.01)
print(len(x))
print(x)
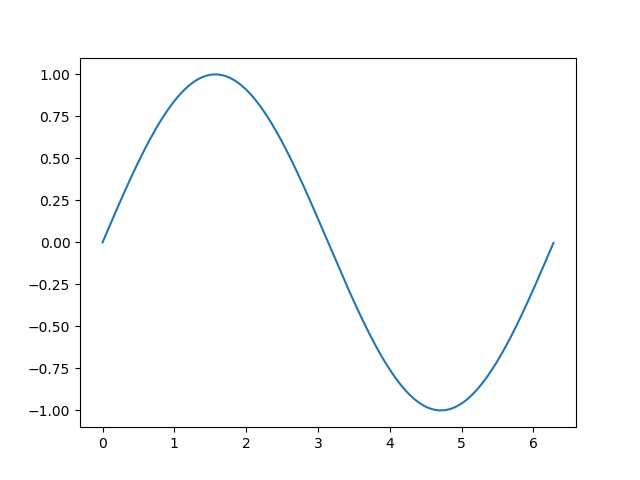
line, = ax.plot(x, np.sin(x))
def animate(i):
line.set_ydata(np.sin(x+i/10))
return line,
def init():
line.set_ydata(np.sin(x))
return line,
# func 表示animation的动画, frames表示100个时间点, init_func 表示初始点,
# inyterval 表示每隔多少时间点刷新 一次, blit是否是全部更新, 如果为FLASE则更新需要更新的点
ani = animation.FuncAnimation(fig=fig, func=animate, frames=100, init_func=init, interval=20, blit=False)
plt.savefig('./image_dir/animation.png')
plt.tight_layout()
plt.show()
![]()

 浙公网安备 33010602011771号