
学习笔记229—Three-way ANOVA using SPSS
Setup in SPSS Statistics
In this example, there are four variables: (1) the dependent variable, cholesterol, which is the cholesterol concentration (in mmol/L); (2) the independent variable, gender, which has two categories: "male" and "female"; (3) the independent variable, risk, which has two categories: "low" and "high"; and (4) the independent variable drug, which has three categories: "drugA", "drugB" and "drugC". The file setup in the Data View window is shown below:
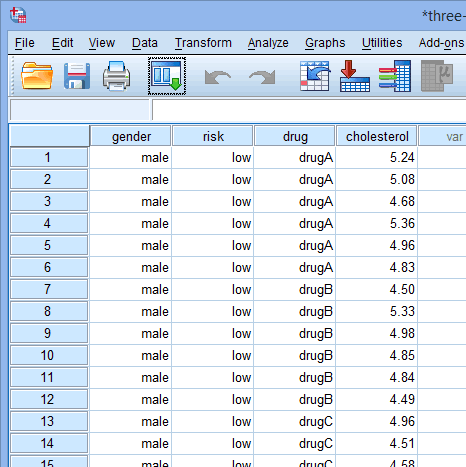
Published with written permission from SPSS Statistics, IBM Corporation.
If you are still unsure how to correctly set up your data in SPSS Statistics to carry out a three-way ANOVA, we show you all the required steps in our enhanced three-way ANOVA guide.
Test Procedure in SPSS Statistics
The General Linear Model > Univariate... procedure below show you how to analyse your data using a three-way ANOVA in SPSS Statistics when the six assumptions in the previous section, Assumptions, have not been violated. At the end of these steps, we show you how to interpret the results from this test. If you are looking for help to make sure your data meets assumptions #4, #5 and #6, which are required when using a three-way ANOVA and can be tested using SPSS Statistics, you can learn more in our enhanced guides on our Features: Overview page.
Since some of the options in the General Linear Model > Univariate... procedure changed in SPSS Statistics version 25, we show how to carry out a three-way ANOVA in SPSS Statistics versions 25, 26, 27 or 28 (or the subscription version of SPSS Statistics) or version 24 or an earlier version of SPSS Statistics. The latest versions of SPSS Statistics are version 28 and the subscription version. If you are unsure which version of SPSS Statistics you are using, see our guide: Identifying your version of SPSS Statistics.
SPSS Statistics versions 25, 26, 27 and 28
(and the subscription version of SPSS Statistics)
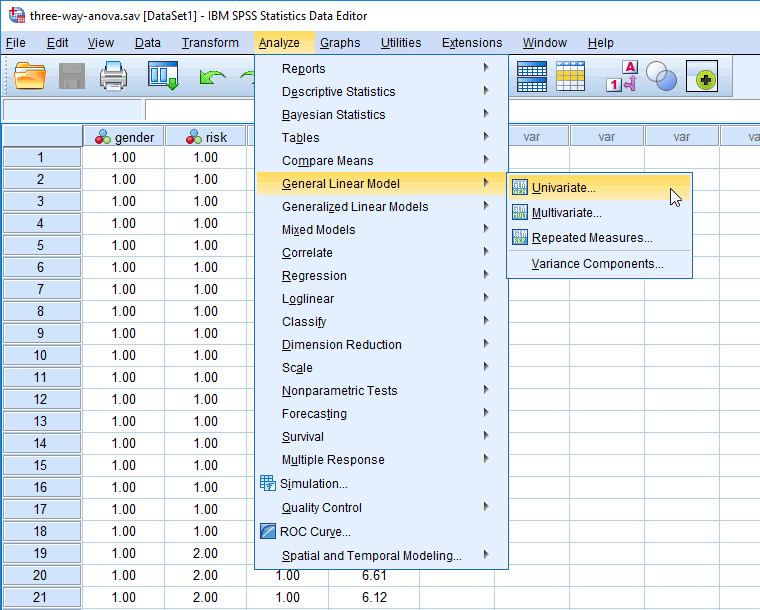
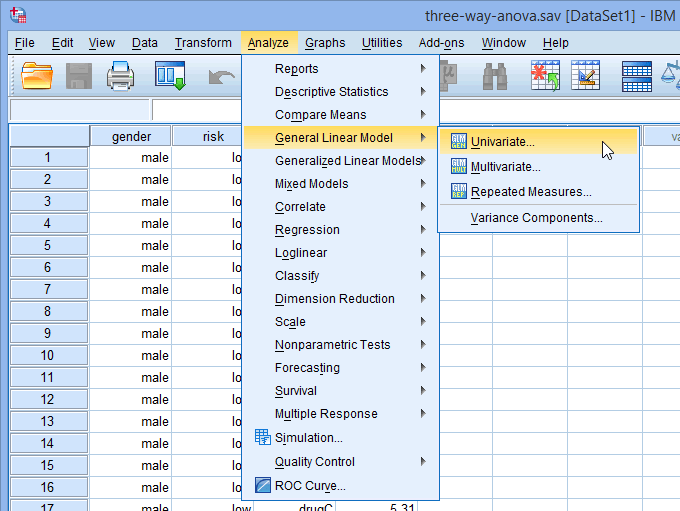
- Click Analyze > General Linear Model > Univariate... on the main menu, as shown below:
Note: In version 27 and the subscription version, SPSS Statistics introduced a new look to their interface called "SPSS Light", replacing the previous look for versions 26 and earlier versions, which was called "SPSS Standard". Therefore, if you have SPSS Statistics versions 27 or 28 (or the subscription version of SPSS Statistics), the images that follow will be light grey rather than blue. However, the procedure is identical.
!['Univariate' menu for the three-way ANOVA in SPSS Statistics]()
Published with written permission from SPSS Statistics, IBM Corporation.
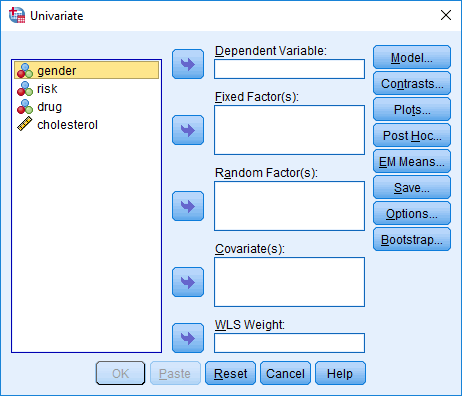
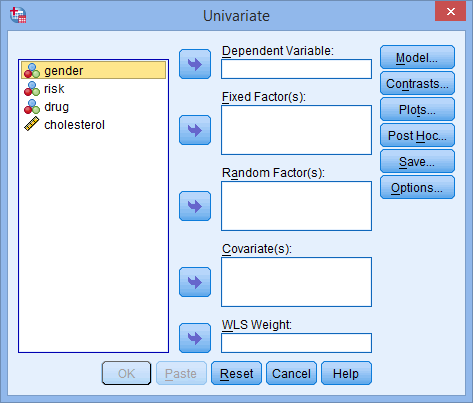
You will be presented with the Univariate dialogue box, as shown below:
!['Univariate' dialogue box for the three-way ANOVA in SPSS Statistics]()
Published with written permission from SPSS Statistics, IBM Corporation.
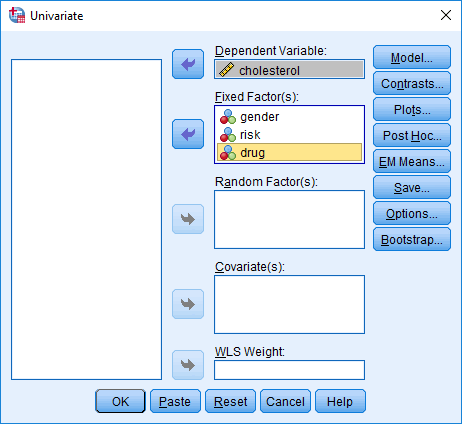
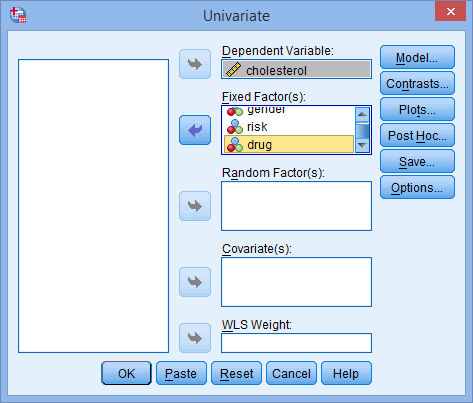
- Transfer the dependent variable, cholesterol, into the Dependent Variable: box and the independent variables – gender, risk and drug – into the Fixed Factor(s): box, using the appropriate
![Right arrow]() buttons. You will end up with a screen similar to the one below:
buttons. You will end up with a screen similar to the one below:
!['Univariate' dialogue box for the three-way ANOVA in SPSS Statistics. Variables transferred into boxes on the right]()
Published with written permission from SPSS Statistics, IBM Corporation.
- Click on the
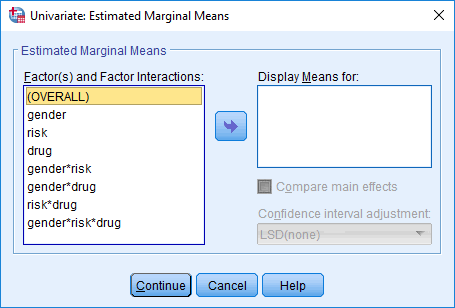
![EM Means]() button and you will be presented with the Univariate: Estimated Marginal Means dialogue box, as shown below:
button and you will be presented with the Univariate: Estimated Marginal Means dialogue box, as shown below:
!['Univariate: Estimated Marginal Means' dialogue box for the three-way ANOVA in SPSS Statistics]()
Published with written permission from SPSS Statistics, IBM Corporation.
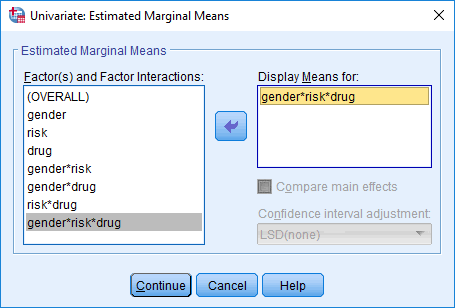
- Transfer the three-way interaction term, gender*risk*drug, from the Factor(s) and Factor Interactions: box to the Display Means For: box by highlighting it and clicking on the
![Right arrow]() button. You will end up with the screen shown below:
button. You will end up with the screen shown below:
!['Univariate: Estimated Marginal Means' dialogue box for the three-way ANOVA in SPSS Statistics. Interaction term transferred]()
Published with written permission from SPSS Statistics, IBM Corporation.
- Click on the
![Continue]() button and you will be returned to the Univariate dialogue box.
button and you will be returned to the Univariate dialogue box.
- Click on the
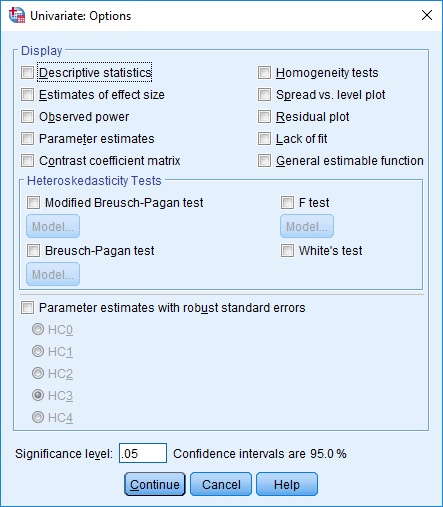
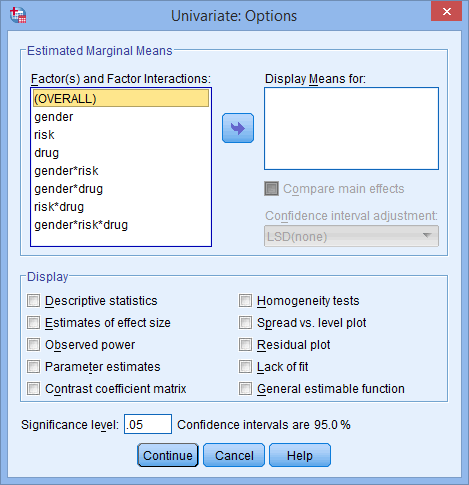
![Options]() button and you will be presented with the Univariate: Options dialogue box, as shown below:
button and you will be presented with the Univariate: Options dialogue box, as shown below:
!['Univariate: Options' dialogue box for the three-way ANOVA in SPSS Statistics]()
Published with written permission from SPSS Statistics, IBM Corporation.
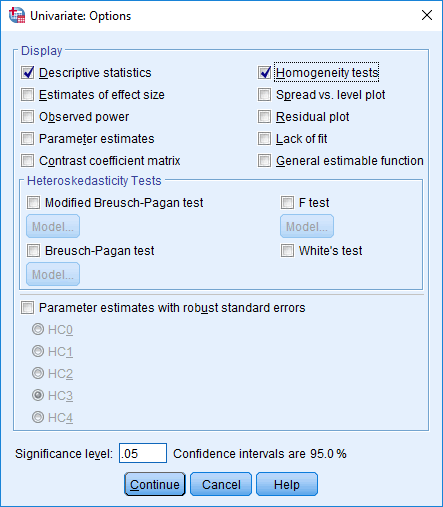
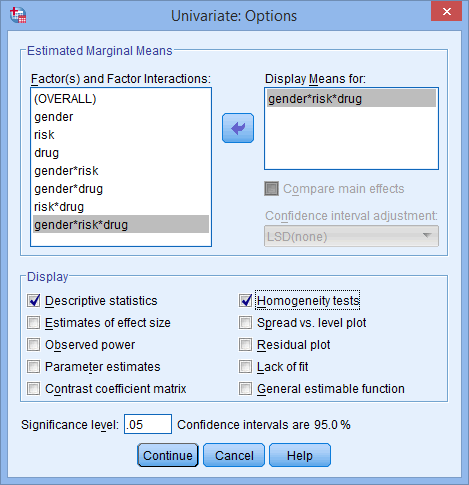
- Select the Descriptive statistics and Homogeneity tests options in the –Display– area. You will end up with the screen shown below:
!['Univariate: Options' dialogue box for the three-way ANOVA in SPSS. 'Descriptive statistics' & Homogeneity tests' selected]()
Published with written permission from SPSS Statistics, IBM Corporation.
- Click on the
![Continue]() button and you will be returned to the Univariate dialogue box.
button and you will be returned to the Univariate dialogue box.
- Click on the
![OK]() button. This will generate the results for the three-way ANOVA.
button. This will generate the results for the three-way ANOVA.
Now that you have run the General Linear Model > Univariate... procedure to carry out a three-way ANOVA, go to the Interpreting Results section. You can ignore the section below, which shows you how to carry out a three-way ANOVA if you have SPSS Statistics version 24 or an earlier version of SPSS Statistics.
SPSS Statistics version 24
and earlier versions of SPSS Statistics
- Click Analyze > General Linear Model > Univariate... on the main menu, as shown below:
![Menu for a three-way ANOVA in SPSS Statistics]()
Published with written permission from SPSS Statistics, IBM Corporation.
You will be presented with the Univariate dialogue box, as shown below:
!['Univariate' dialogue box for a three-way ANOVA in SPSS Statistics. All variables on the left]()
Published with written permission from SPSS Statistics, IBM Corporation.
- Transfer the dependent variable, cholesterol, into the Dependent Variable: box and the independent variables – gender, risk and drug – into the Fixed Factor(s): box, using the appropriate
![Right arrow]() buttons. You will end up with a screen similar to the one below:
buttons. You will end up with a screen similar to the one below:
!['Univariate' dialogue box for a three-way ANOVA in SPSS Statistics. Variables transferred on the right]()
Published with written permission from SPSS Statistics, IBM Corporation.
- Click on the
![Options]() button and you will be presented with the Univariate: Options dialogue box, as shown below:
button and you will be presented with the Univariate: Options dialogue box, as shown below:
!['Univariate: Options' dialogue box for a three-way ANOVA in SPSS Statistics]()
Published with written permission from SPSS Statistics, IBM Corporation.
- Transfer the three-way interaction term, gender*risk*drug, from the Factor(s) and Factor Interactions: box to the Display Means For: box by highlighting it and clicking on the
![Right arrow]() button. Then select the Descriptive statistics and Homogeneity tests options in the –Display– area. You will end up with the screen shown below:
button. Then select the Descriptive statistics and Homogeneity tests options in the –Display– area. You will end up with the screen shown below:
![''Univariate: Options' dialogue box. 3-way ANOVA in SPSS. 'gender*risk*drug' transferred. Options selected in 'Display' area]()
Published with written permission from SPSS Statistics, IBM Corporation.
- Click on the
![Continue]() button and you will be returned to the Univariate dialogue box.
button and you will be returned to the Univariate dialogue box.
- Click on the
![OK]() button. This will generate the results for the three-way ANOVA.
button. This will generate the results for the three-way ANOVA.
SPSS Statistics
Three-way ANOVA result
The primary goal of running a three-way ANOVA is to determine whether there is a three-way interaction between your three independent variables (i.e., a gender*risk*drug interaction). Essentially, a three-way interaction tests whether the simple two-way risk*drug interactions differ between the levels of gender (i.e., differ for "males" and "females").
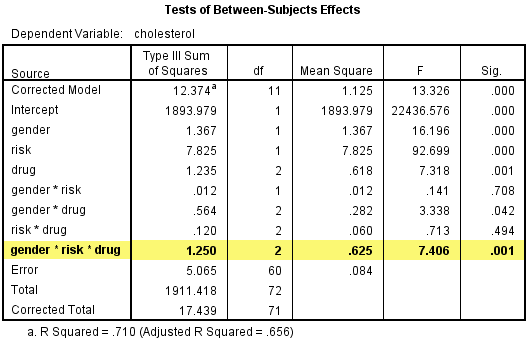
To determine whether you have a statistically significant three-way gender*risk*drug interaction, you need to consult the "gender * risk * drug" row in the Tests of Between-Subjects Effects table, as highlighted below:
Published with written permission from SPSS Statistics, IBM Corporation.
The "Sig." column presents the statistical significance level (i.e., p-value) of the three-way interaction term of the three-way ANOVA. You can see that the statistical significance level of the three-way interaction term is .001 (i.e., p = .001). This value is less than .05 (i.e., it satisfies p < .05), which means that there is a statistically significant three-way gender*risk*drug interaction effect.
You could report this result as follows:

In our enhanced three-way ANOVA guide (see our Plans & Pricing), in addition to testing all the assumptions, we show you how to follow up a three-way ANOVA result with simple two-way interactions, followed by simple simple main effects and, finally, simple simple comparisons. We show you at every stage how to run these tests, interpret and report them and how to write up all your results. Check out our low prices, which give you access to all our enhanced guides: Plans & Pricing.
参考链接:https://statistics.laerd.com/spss-tutorials/three-way-anova-using-spss-statistics.php

 浙公网安备 33010602011771号