
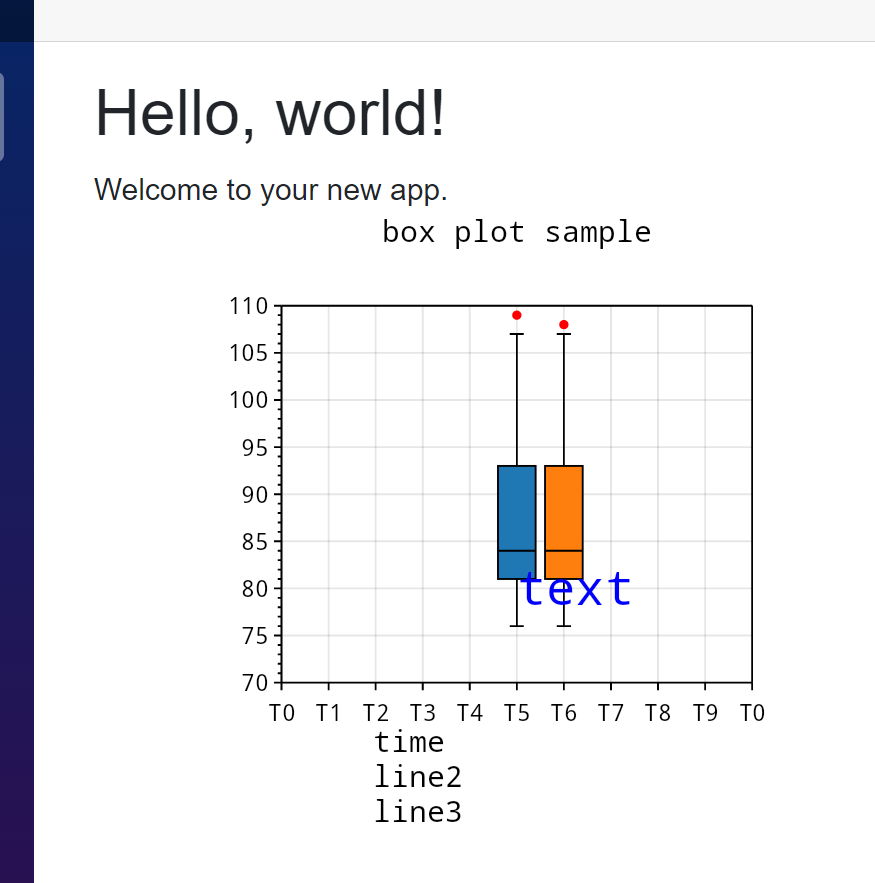
在Blazor页面上显示ScottPlot5 chart图
ScottPlot5 支持blazor, 内置支持缩放和拖地等交互性, 其他交互性暂不支持, 比如选中指定散点, 显示散点的tooltip.
下面是一个示例,
@page "/"
@using ScottPlot
@using ScottPlot.Blazor

<PageTitle>Home</PageTitle>
<h1>Hello, world!</h1>
Welcome to your new app.
<BlazorPlot @ref=blazorPlot Style="width: 400px; height: 400px;" />

@code{


    //创建一个 BlazorPlot 对象
    BlazorPlot blazorPlot { get; set; } = new();

    protected override void OnAfterRender(bool firstRender)
    {
        if (firstRender)
        {
            // 从 blazorPlot 中获取  Plot 对象
            var myPlot = blazorPlot.Plot;


            //创建2个boxPlot
            ScottPlot.Box box = new()
            {
                Position = 5,
                BoxMin = 81,
                BoxMax = 93,
                WhiskerMin = 76,
                WhiskerMax = 107,
                BoxMiddle = 84,

            };
            ScottPlot.Box box2 = new()
            {
                Position = 6,
                BoxMin = 81,
                BoxMax = 93,
                WhiskerMin = 76,
                WhiskerMax = 107,
                BoxMiddle = 84,
            };


            //在myPlot增加boxPlot
            myPlot.Add.Box(box);
            myPlot.Add.Box(box2);

            //设置X label, 可以设置多行文本
            myPlot.Axes.Bottom.Label.Text = "time\nline2\nline3";

            //因为X Label为多行, 所以需要设置padding值, 否则只能显示出第一行文本, 数值单位为像素
            var padding =new ScottPlot.PixelPadding(left:100,right:50,bottom:150,top:50);
            myPlot.Layout.Fixed(padding);


            //设置title
            myPlot.Title("box plot sample");

            //在plot上增加一个 text, 坐标单位是X/Y轴刻度单位
            var myText= myPlot.Add.Text("text", 5, 80);
            myText.Label.Alignment = Alignment.MiddleLeft;
            myText.Label.Bold = true;
            myText.Label.FontSize = 26;
            myText.Label.ForeColor = Colors.Blue;

            // 设置坐标轴限制
            myPlot.Axes.SetLimits(0, 10, 70, 110);

            //设置X轴刻度
            ScottPlot.Tick[] ticks = {
                new ScottPlot.Tick(0, "T0"),
                new ScottPlot.Tick(1, "T1"),
                new ScottPlot.Tick(2, "T2"),
                new ScottPlot.Tick(3, "T3"),
                new ScottPlot.Tick(4, "T4"),
                new ScottPlot.Tick(5, "T5"),
                new ScottPlot.Tick(6, "T6"),
                new ScottPlot.Tick(7, "T7"),
                new ScottPlot.Tick(8, "T8"),
                new ScottPlot.Tick(9, "T9"),
                new ScottPlot.Tick(10, "T0"),
       };
            myPlot.Axes.Bottom.TickGenerator = new ScottPlot.TickGenerators.NumericManual(ticks);

            //或者使用日期刻度
            //myPlot.Axes.DateTimeTicksBottom();

            //使用散点图来显示异常点 outliers
            double[] outlierX = { 5, 6 };//X坐标对应 boxplot 的位置, 数值单位为刻度尺单位
            double[] outlierY = { 109, 108 };//Y坐标异常点的数值, 数值单位为刻度尺单位
            var scatter=myPlot.Add.Scatter(outlierX, outlierY);
            scatter.MarkerStyle = new MarkerStyle(MarkerShape.FilledCircle, 5f, Colors.Red);
            scatter.LineWidth = 0; //不显示连接线

            // 刷新 BlazorPlot 组件以显示更新后的图表
            //blazorPlot.Refresh();

            //myPlot.SavePng() ;
        }
    }


}


【推荐】国内首个AI IDE,深度理解中文开发场景,立即下载体验Trae
【推荐】编程新体验,更懂你的AI,立即体验豆包MarsCode编程助手
【推荐】抖音旗下AI助手豆包,你的智能百科全书,全免费不限次数
【推荐】轻量又高性能的 SSH 工具 IShell:AI 加持,快人一步
· 震惊!C++程序真的从main开始吗?99%的程序员都答错了
· 【硬核科普】Trae如何「偷看」你的代码?零基础破解AI编程运行原理
· 单元测试从入门到精通
· 上周热点回顾(3.3-3.9)
· winform 绘制太阳,地球,月球 运作规律