
[Dash-python]学习记录01
前记:
Dash-python 可快速本地使用python构建web数据可视化交互;
#doc:Dash Documentation & User Guide | Plotly
模块安装:pip install dash
在Jupyter notebook 上安装:pip install jupyter-dash
建议安装pandas : pip install pandas 这是Plotly Express所需要的,在许多示例中都使用过。
Now-构建应用! threre:Part 1. Installation | Dash for Python Documentation | Plotly
一.Dash 布局
#doc Part 2. Layout | Dash for Python Documentation | Plotly
1.Hello Dash
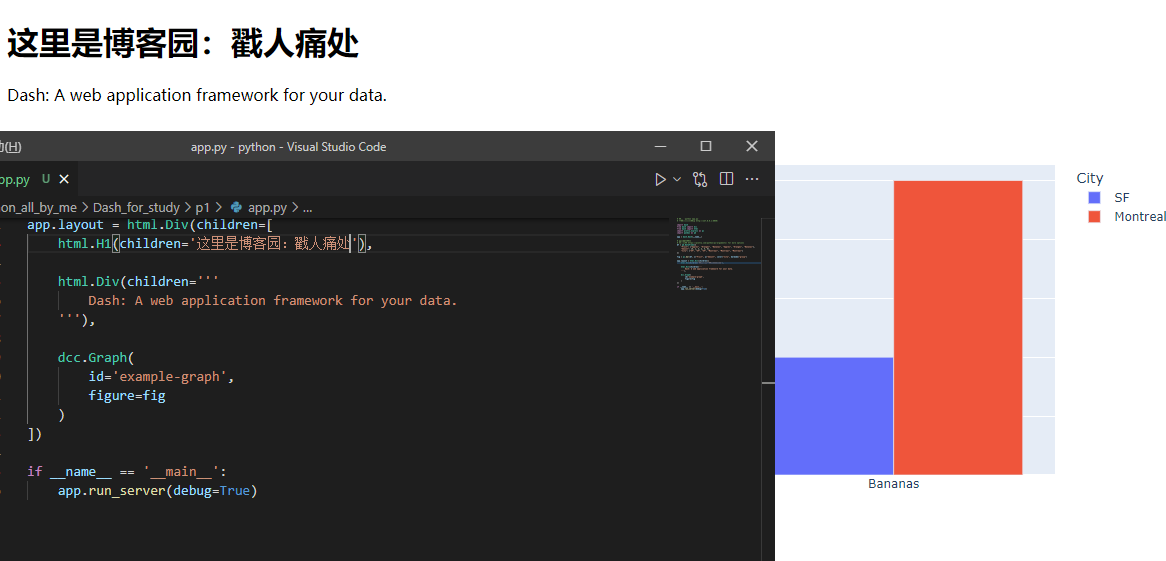
首先,创建一个名为app.py的文件,将下面的代码复制到其中,并用python app.py运行它

# 运行 `python app.py`
# 访问浏览器本地ip http://127.0.0.1:8050/

import dash
from dash import dcc
from dash import html
import plotly.express as px
import pandas as pd

app = dash.Dash(__name__)

# 假定你有数据
# 更多选项 https://plotly.com/python/px-arguments/ for more options
df = pd.DataFrame({
    "Fruit": ["Apples", "Oranges", "Bananas", "Apples", "Oranges", "Bananas"],
    "Amount": [4, 1, 2, 2, 4, 5],
    "City": ["SF", "SF", "SF", "Montreal", "Montreal", "Montreal"]
})

fig = px.bar(df, x="Fruit", y="Amount", color="City", barmode="group")

app.layout = html.Div(children=[
    html.H1(children='Hello Dash'),

    html.Div(children='''
        Dash: A web application framework for your data.
    '''),

    dcc.Graph(
        id='example-graph',
        figure=fig
    )
])

if __name__ == '__main__':
    app.run_server(debug=True)
1.控制台输出
PS D:\pppython\python> & D:/cpython/python.exe d:/pppython/python/python_all_by_me/Dash_for_study/p1/app.py
d:\pppython\python\python_all_by_me\Dash_for_study\p1\app.py:5: UserWarning:
The dash_core_components package is deprecated. Please replace
`import dash_core_components as dcc` with `from dash import dcc`
  import dash_core_components as dcc
d:\pppython\python\python_all_by_me\Dash_for_study\p1\app.py:6: UserWarning:
The dash_html_components package is deprecated. Please replace
`import dash_html_components as html` with `from dash import html`
PS D:\pppython\python> & D:/cpython/python.exe d:/pppython/python/python_all_by_me/Dash_for_study/p1/app.py
Dash is running on http://127.0.0.1:8050/

 * Serving Flask app 'app' (lazy loading)
 * Environment: production
   WARNING: This is a development server. Do not use it in a production deployment.
   Use a production WSGI server instead.
 * Debug mode: on
2.web界面

3.Note
1.这个界面是由组件组成,例如html.Div 和 dcc.Graph.
2.这个 dash_html_components ( Dash v2.0 的dash.html)为每一个HTML标签都提供了一个组件,如code html.H1(children='Hello Dash') ,该组件生成一个 <h1>Hello Dash</h1> HTML元素在你的应用中;
3.不是所有的组件都是纯粹的HTML组件,dash_core_components是更高级的组件,被用作交互式javaScript 的生成;
4.每个组件完全通过关键字属性进行描述。Dash是声明性的:你将主要通过这些属性描述你的应用程序。
5.children 属性是特别的,按照惯例,它总是第一个属性,这意味着你可以省略它;html.H1(children='Hello Dash')与html.H1('Hello Dash')相同。它可以包含字符串、数字、单个组件或组件列表。
6.应用程序中的字体与这里显示的字体有一点不同。这个应用程序使用自定义CSS样式表和Dash企业设计工具包来修改元素的默认样式。你可以在CSS教程中了解更多关于自定义CSS的知识。
2.做出第一次改变
Dash包含热加载机制,当你运行app.run_server(debug=True)时,这个特性就被激活了。这个意味着当你改变了你的代码,Dash 会自动刷新你的浏览器;
试一试:改变代码中的标题“Hello Dash”或者xy轴的数据,你的应用应该会随着你的修改自动刷新;
(不用停止应用的运行,只接修改内容保存[ctrl+s]就自动刷新了,amazing!)
3.更多HTML组件
dash_html_components (Dash v2.0的Dash.HTML)包含每个HTML标签的组件类以及所有HTML参数的关键字参数。
让我们通过修改组件的内联样式来定制应用程序中的文本。用下面的代码创建一个名为app.py的文件:
# Run this app with `python app.py` and
# visit http://127.0.0.1:8050/ in your web browser.
import dash
from dash import dcc
from dash import html
import plotly.express as px
import pandas as pd

app = dash.Dash(__name__)
df = pd.DataFrame({
    "Fruit": ["Apples", "Oranges", "Bananas", "Apples", "Oranges", "Bananas"],
    "Amount": [4, 1, 2, 2, 4, 5],
    "City": ["SF", "SF", "SF", "Montreal", "Montreal", "Montreal"]
})

fig = px.bar(df, x="Fruit", y="Amount", color="City", barmode="group")
fig.update_layout(
    plot_bgcolor='#FF0000',
    paper_bgcolor='#00FF00',
    font_color='#0000FF'
)

app.layout = html.Div(style={'backgroundColor': '#666666'}, children=[
    html.H1(
        children='Hello Dash',
        style={
            'textAlign': 'center',
            'color': '#000000'
        }
    ),
    html.Div(children='Dash: A web application framework for your data.', style={
        'textAlign': 'center',
        'color': '#000000'
    }),
    dcc.Graph(
        id='example-graph-2',
        figure=fig
    )
])

if __name__ == '__main__':
    app.run_server(debug=True)
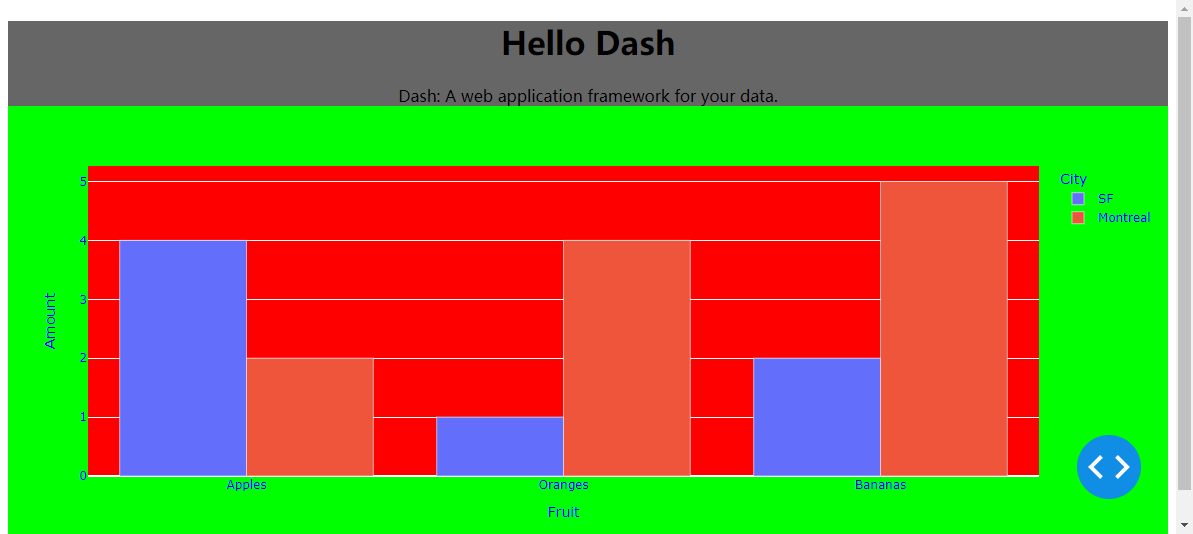
在这个例子中,我们修改了html.Div和html.H1的style属性。
html.H1('Hello Dash', style={'textAlign': 'center', 'color':'#000000'})
HTML语句被渲染为
<h1 style="text-align: center; color: #000000">Hello Dash</h1>
对于dash_html_components(dash.html)和HTML,这里有一些区别;
1.HTML中的style属性是一个分号分隔的字符串。在Dash中,你只需要提供一本字典。style={'textAlign': 'center', 'color': '#000000'}
2.样式字典中的键是驼峰式大小写。这里不是text-align,而是textAlign。
3.HTML 中类(class)属性是Dash中的类名(className)。
4.HTML标记的子标记通过children关键字参数指定。按照惯例,这总是第一个参数,因此经常被省略。
除此之外,所有可用的HTML属性和标记在Python内容中都是可用的。
4.重用组件
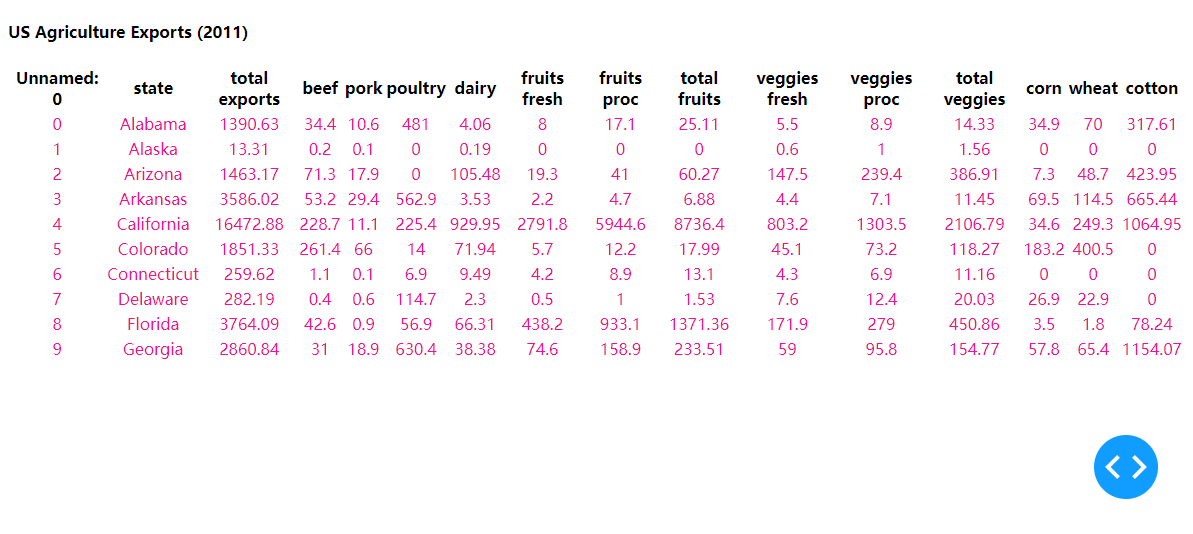
通过用Python编写标记,我们可以创建复杂的可重用组件,如表,而无需切换内容或语言。
下面是一个从Pandas数据帧生成图表的快速示例,用下面的代码创建一个名为app.py的文件:
# Run this app with `python app.py` and
# visit http://127.0.0.1:8050/ in your web browser.
import dash
from dash import html
import pandas as pd
df = pd.read_csv('https://gist.githubusercontent.com/chriddyp/c78bf172206ce24f77d6363a2d754b59/raw/c353e8ef842413cae56ae3920b8fd78468aa4cb2/usa-agricultural-exports-2011.csv')

def generate_table(dataframe, max_rows=10):
    return html.Table([
        html.Thead(
            html.Tr([html.Th(col) for col in dataframe.columns])
        ),
        html.Tbody([
            html.Tr([
                html.Td(dataframe.iloc[i][col]) for col in dataframe.columns
            ]) for i in range(min(len(dataframe), max_rows))
        ])
    ])


app = dash.Dash(__name__)
app.layout = html.Div([
    html.H4(children='US Agriculture Exports (2011)'),
    generate_table(df)
])
if __name__ == '__main__':
    app.run_server(debug=True)
csv数据格式


 1 ,state,total exports,beef,pork,poultry,dairy,fruits fresh,fruits proc,total fruits,veggies fresh,veggies proc,total veggies,corn,wheat,cotton
 2 0,Alabama,1390.63,34.4,10.6,481.0,4.06,8.0,17.1,25.11,5.5,8.9,14.33,34.9,70.0,317.61
 3 1,Alaska,13.31,0.2,0.1,0.0,0.19,0.0,0.0,0.0,0.6,1.0,1.56,0.0,0.0,0.0
 4 2,Arizona,1463.17,71.3,17.9,0.0,105.48,19.3,41.0,60.27,147.5,239.4,386.91,7.3,48.7,423.95
 5 3,Arkansas,3586.02,53.2,29.4,562.9,3.53,2.2,4.7,6.88,4.4,7.1,11.45,69.5,114.5,665.44
 6 4, California,16472.88,228.7,11.1,225.4,929.95,2791.8,5944.6,8736.4,803.2,1303.5,2106.79,34.6,249.3,1064.95
 7 5,Colorado,1851.33,261.4,66.0,14.0,71.94,5.7,12.2,17.99,45.1,73.2,118.27,183.2,400.5,0.0
 8 6,Connecticut,259.62,1.1,0.1,6.9,9.49,4.2,8.9,13.1,4.3,6.9,11.16,0.0,0.0,0.0
 9 7,Delaware,282.19,0.4,0.6,114.7,2.3,0.5,1.0,1.53,7.6,12.4,20.03,26.9,22.9,0.0
10 8,Florida,3764.09,42.6,0.9,56.9,66.31,438.2,933.1,1371.36,171.9,279.0,450.86,3.5,1.8,78.24
11 9,Georgia,2860.84,31.0,18.9,630.4,38.38,74.6,158.9,233.51,59.0,95.8,154.77,57.8,65.4,1154.07
12 10,Hawaii,401.84,4.0,0.7,1.3,1.16,17.7,37.8,55.51,9.5,15.4,24.83,0.0,0.0,0.0
13 11,Idaho,2078.89,119.8,0.0,2.4,294.6,6.9,14.7,21.64,121.7,197.5,319.19,24.0,568.2,0.0
14 12,Illinois,8709.48,53.7,394.0,14.0,45.82,4.0,8.5,12.53,15.2,24.7,39.95,2228.5,223.8,0.0
15 13,Indiana,5050.23,21.9,341.9,165.6,89.7,4.1,8.8,12.98,14.4,23.4,37.89,1123.2,114.0,0.0
16 14,Iowa,11273.76,289.8,1895.6,155.6,107.0,1.0,2.2,3.24,2.7,4.4,7.1,2529.8,3.1,0.0
17 15,Kansas,4589.01,659.3,179.4,6.4,65.45,1.0,2.1,3.11,3.6,5.8,9.32,457.3,1426.5,43.98
18 16,Kentucky,1889.15,54.8,34.2,151.3,28.27,2.1,4.5,6.6,0.0,0.0,0.0,179.1,149.3,0.0
19 17,Louisiana,1914.23,19.8,0.8,77.2,6.02,5.7,12.1,17.83,6.6,10.7,17.25,91.4,78.7,280.42
20 18,Maine,278.37,1.4,0.5,10.4,16.18,16.6,35.4,52.01,24.0,38.9,62.9,0.0,0.0,0.0
21 19,Maryland,692.75,5.6,3.1,127.0,24.81,4.1,8.8,12.9,7.8,12.6,20.43,54.1,55.8,0.0
22 20,Massachusetts,248.65,0.6,0.5,0.6,5.81,25.8,55.0,80.83,8.1,13.1,21.13,0.0,0.0,0.0
23 21,Michigan,3164.16,37.7,118.1,32.6,214.82,82.3,175.3,257.69,72.4,117.5,189.96,381.5,247.0,0.0
24 22,Minnesota,7192.33,112.3,740.4,189.2,218.05,2.5,5.4,7.91,45.9,74.5,120.37,1264.3,538.1,0.0
25 23,Mississippi,2170.8,12.8,30.4,370.8,5.45,5.4,11.6,17.04,10.6,17.2,27.87,110.0,102.2,494.75
26 24,Missouri,3933.42,137.2,277.3,196.1,34.26,4.2,9.0,13.18,6.8,11.1,17.9,428.8,161.7,345.29
27 25,Montana,1718.0,105.0,16.7,1.7,6.82,1.1,2.2,3.3,17.3,28.0,45.27,5.4,1198.1,0.0
28 26,Nebraska,7114.13,762.2,262.5,31.4,30.07,0.7,1.5,2.16,20.4,33.1,53.5,1735.9,292.3,0.0
29 27,Nevada,139.89,21.8,0.2,0.0,16.57,0.4,0.8,1.19,10.6,17.3,27.93,0.0,5.4,0.0
30 28,New Hampshire,73.06,0.6,0.2,0.8,7.46,2.6,5.4,7.98,1.7,2.8,4.5,0.0,0.0,0.0
31 29,New Jersey,500.4,0.8,0.4,4.6,3.37,35.0,74.5,109.45,21.6,35.0,56.54,10.1,6.7,0.0
32 30,New Mexico,751.58,117.2,0.1,0.3,191.01,32.6,69.3,101.9,16.7,27.1,43.88,11.2,13.9,72.62
33 31,New York,1488.9,22.2,5.8,17.7,331.8,64.7,137.8,202.56,54.7,88.7,143.37,106.1,29.9,0.0
34 32,North Carolina,3806.05,24.8,702.8,598.4,24.9,23.8,50.7,74.47,57.4,93.1,150.45,92.2,200.3,470.86
35 33,North Dakota,3761.96,78.5,16.1,0.5,8.14,0.1,0.2,0.25,49.9,80.9,130.79,236.1,1664.5,0.0
36 34,Ohio,3979.79,36.2,199.1,129.9,134.57,8.7,18.5,27.21,20.4,33.1,53.53,535.1,207.4,0.0
37 35,Oklahoma,1646.41,337.6,265.3,131.1,24.35,3.0,6.3,9.24,3.4,5.5,8.9,27.5,324.8,110.54
38 36,Oregon,1794.57,58.8,1.4,14.2,63.66,100.7,214.4,315.04,48.2,78.3,126.5,11.7,320.3,0.0
39 37,Pennsylvania,1969.87,50.9,91.3,169.8,280.87,28.6,60.9,89.48,14.6,23.7,38.26,112.1,41.0,0.0
40 38,Rhode Island,31.59,0.1,0.1,0.2,0.52,0.9,1.9,2.83,1.2,1.9,3.02,0.0,0.0,0.0
41 39,South Carolina,929.93,15.2,10.9,186.5,7.62,17.1,36.4,53.45,16.3,26.4,42.66,32.1,55.3,206.1
42 40,South Dakota,3770.19,193.5,160.2,29.3,46.77,0.3,0.5,0.8,1.5,2.5,4.06,643.6,704.5,0.0
43 41,Tennessee,1535.13,51.1,17.6,82.4,21.18,2.0,4.2,6.23,9.4,15.3,24.67,88.8,100.0,363.83
44 42,Texas,6648.22,961.0,42.7,339.2,240.55,31.9,68.0,99.9,43.9,71.3,115.23,167.2,309.7,2308.76
45 43,Utah,453.39,27.9,59.0,23.1,48.6,3.9,8.4,12.34,2.5,4.1,6.6,5.3,42.8,0.0
46 44,Vermont,180.14,6.2,0.2,0.9,65.98,2.6,5.4,8.01,1.5,2.5,4.05,0.0,0.0,0.0
47 45,Virginia,1146.48,39.5,16.9,164.7,47.85,11.7,24.8,36.48,10.4,16.9,27.25,39.5,77.5,64.84
48 46,Washington,3894.81,59.2,0.0,35.6,154.18,555.6,1183.0,1738.57,138.7,225.1,363.79,29.5,786.3,0.0
49 47,West Virginia,138.89,12.0,0.3,45.4,3.9,3.7,7.9,11.54,0.0,0.0,0.0,3.5,1.6,0.0
50 48,Wisconsin,3090.23,107.3,38.6,34.5,633.6,42.8,91.0,133.8,56.8,92.2,148.99,460.5,96.7,0.0
51 49,Wyoming,349.69,75.1,33.2,0.1,2.89,0.1,0.1,0.17,3.9,6.3,10.23,9.0,20.7,0.0
5.更多关于可视化
dash_core_components库包含一个名为Graph的组件。
Graph使用开源plotly.js JavaScript图形库呈现交互式数据可视化。Plotly.js支持超过35种图表类型,并以矢量质量的SVG和高性能的WebGL呈现图表。
graph组件中的figure参数与Plotly的开源Python图形库Plotly.py使用的figure参数相同。查看plot.py文档和图库了解更多信息。
下面是一个从Pandas数据帧创建散点图的示例。用下面的代码创建一个名为app.py的文件:
# Run this app with `python app.py` and
# visit http://127.0.0.1:8050/ in your web browser.
import dash
from dash import dcc    #import dash_core_components as dcc
from dash import html   #import dash_html_components as html
import plotly.express as px
import pandas as pd

app = dash.Dash(__name__)

df = pd.read_csv('https://gist.githubusercontent.com/chriddyp/5d1ea79569ed194d432e56108a04d188/raw/a9f9e8076b837d541398e999dcbac2b2826a81f8/gdp-life-exp-2007.csv')
fig = px.scatter(df, x="gdp per capita", y="life expectancy",
                 size="population", color="continent", hover_name="country",
                 log_x=True, size_max=60)

app.layout = html.Div([
    dcc.Graph(
        id='life-exp-vs-gdp',
        figure=fig
    )
])
if __name__ == '__main__':
    app.run_server(debug=True)
使用的csv数据:
  1 ,country,continent,population,life expectancy,gdp per capita
  2 11,Afghanistan,Asia,31889923.0,43.828,974.5803384
  3 23,Albania,Europe,3600523.0,76.423,5937.029526
  4 35,Algeria,Africa,33333216.0,72.301,6223.367465
  5 47,Angola,Africa,12420476.0,42.731,4797.231267
  6 59,Argentina,Americas,40301927.0,75.32,12779.37964
  7 71,Australia,Oceania,20434176.0,81.235,34435.36744
  8 83,Austria,Europe,8199783.0,79.829,36126.4927
  9 95,Bahrain,Asia,708573.0,75.635,29796.04834
 10 107,Bangladesh,Asia,150448339.0,64.062,1391.253792
 11 119,Belgium,Europe,10392226.0,79.441,33692.60508
 12 131,Benin,Africa,8078314.0,56.728,1441.284873
 13 143,Bolivia,Americas,9119152.0,65.554,3822.137084
 14 155,Bosnia and Herzegovina,Europe,4552198.0,74.852,7446.298803
 15 167,Botswana,Africa,1639131.0,50.728,12569.85177
 16 179,Brazil,Americas,190010647.0,72.39,9065.800825
 17 191,Bulgaria,Europe,7322858.0,73.005,10680.79282
 18 203,Burkina Faso,Africa,14326203.0,52.295,1217.032994
 19 215,Burundi,Africa,8390505.0,49.58,430.0706916
 20 227,Cambodia,Asia,14131858.0,59.723,1713.778686
 21 239,Cameroon,Africa,17696293.0,50.43,2042.09524
 22 251,Canada,Americas,33390141.0,80.653,36319.23501
 23 263,Central African Republic,Africa,4369038.0,44.741,706.016537
 24 275,Chad,Africa,10238807.0,50.651,1704.063724
 25 287,Chile,Americas,16284741.0,78.553,13171.63885
 26 299,China,Asia,1318683096.0,72.961,4959.114854
 27 311,Colombia,Americas,44227550.0,72.889,7006.580419
 28 323,Comoros,Africa,710960.0,65.152,986.1478792
 29 335,"Congo, Dem. Rep.",Africa,64606759.0,46.462,277.5518587
 30 347,"Congo, Rep.",Africa,3800610.0,55.322,3632.557798
 31 359,Costa Rica,Americas,4133884.0,78.782,9645.06142
 32 371,Cote d'Ivoire,Africa,18013409.0,48.328,1544.750112
 33 383,Croatia,Europe,4493312.0,75.748,14619.22272
 34 395,Cuba,Americas,11416987.0,78.273,8948.102923
 35 407,Czech Republic,Europe,10228744.0,76.486,22833.30851
 36 419,Denmark,Europe,5468120.0,78.332,35278.41874
 37 431,Djibouti,Africa,496374.0,54.791,2082.481567
 38 443,Dominican Republic,Americas,9319622.0,72.235,6025.374752
 39 455,Ecuador,Americas,13755680.0,74.994,6873.262326
 40 467,Egypt,Africa,80264543.0,71.338,5581.180998
 41 479,El Salvador,Americas,6939688.0,71.878,5728.353514
 42 491,Equatorial Guinea,Africa,551201.0,51.579,12154.08975
 43 503,Eritrea,Africa,4906585.0,58.04,641.3695236
 44 515,Ethiopia,Africa,76511887.0,52.947,690.8055759
 45 527,Finland,Europe,5238460.0,79.313,33207.0844
 46 539,France,Europe,61083916.0,80.657,30470.0167
 47 551,Gabon,Africa,1454867.0,56.735,13206.48452
 48 563,Gambia,Africa,1688359.0,59.448,752.7497265
 49 575,Germany,Europe,82400996.0,79.406,32170.37442
 50 587,Ghana,Africa,22873338.0,60.022,1327.60891
 51 599,Greece,Europe,10706290.0,79.483,27538.41188
 52 611,Guatemala,Americas,12572928.0,70.259,5186.050003
 53 623,Guinea,Africa,9947814.0,56.007,942.6542111
 54 635,Guinea-Bissau,Africa,1472041.0,46.388,579.231743
 55 647,Haiti,Americas,8502814.0,60.916,1201.637154
 56 659,Honduras,Americas,7483763.0,70.198,3548.330846
 57 671,"Hong Kong, China",Asia,6980412.0,82.208,39724.97867
 58 683,Hungary,Europe,9956108.0,73.338,18008.94444
 59 695,Iceland,Europe,301931.0,81.757,36180.78919
 60 707,India,Asia,1110396331.0,64.698,2452.210407
 61 719,Indonesia,Asia,223547000.0,70.65,3540.651564
 62 731,Iran,Asia,69453570.0,70.964,11605.71449
 63 743,Iraq,Asia,27499638.0,59.545,4471.061906
 64 755,Ireland,Europe,4109086.0,78.885,40675.99635
 65 767,Israel,Asia,6426679.0,80.745,25523.2771
 66 779,Italy,Europe,58147733.0,80.546,28569.7197
 67 791,Jamaica,Americas,2780132.0,72.567,7320.880262
 68 803,Japan,Asia,127467972.0,82.603,31656.06806
 69 815,Jordan,Asia,6053193.0,72.535,4519.461171
 70 827,Kenya,Africa,35610177.0,54.11,1463.249282
 71 839,"Korea, Dem. Rep.",Asia,23301725.0,67.297,1593.06548
 72 851,"Korea, Rep.",Asia,49044790.0,78.623,23348.13973
 73 863,Kuwait,Asia,2505559.0,77.588,47306.98978
 74 875,Lebanon,Asia,3921278.0,71.993,10461.05868
 75 887,Lesotho,Africa,2012649.0,42.592,1569.331442
 76 899,Liberia,Africa,3193942.0,45.678,414.5073415
 77 911,Libya,Africa,6036914.0,73.952,12057.49928
 78 923,Madagascar,Africa,19167654.0,59.443,1044.770126
 79 935,Malawi,Africa,13327079.0,48.303,759.3499101
 80 947,Malaysia,Asia,24821286.0,74.241,12451.6558
 81 959,Mali,Africa,12031795.0,54.467,1042.581557
 82 971,Mauritania,Africa,3270065.0,64.164,1803.151496
 83 983,Mauritius,Africa,1250882.0,72.801,10956.99112
 84 995,Mexico,Americas,108700891.0,76.195,11977.57496
 85 1007,Mongolia,Asia,2874127.0,66.803,3095.772271
 86 1019,Montenegro,Europe,684736.0,74.543,9253.896111
 87 1031,Morocco,Africa,33757175.0,71.164,3820.17523
 88 1043,Mozambique,Africa,19951656.0,42.082,823.6856205
 89 1055,Myanmar,Asia,47761980.0,62.069,944.0
 90 1067,Namibia,Africa,2055080.0,52.906,4811.060429
 91 1079,Nepal,Asia,28901790.0,63.785,1091.359778
 92 1091,Netherlands,Europe,16570613.0,79.762,36797.93332
 93 1103,New Zealand,Oceania,4115771.0,80.204,25185.00911
 94 1115,Nicaragua,Americas,5675356.0,72.899,2749.320965
 95 1127,Niger,Africa,12894865.0,56.867,619.6768924
 96 1139,Nigeria,Africa,135031164.0,46.859,2013.977305
 97 1151,Norway,Europe,4627926.0,80.196,49357.19017
 98 1163,Oman,Asia,3204897.0,75.64,22316.19287
 99 1175,Pakistan,Asia,169270617.0,65.483,2605.94758
100 1187,Panama,Americas,3242173.0,75.537,9809.185636
101 1199,Paraguay,Americas,6667147.0,71.752,4172.838464
102 1211,Peru,Americas,28674757.0,71.421,7408.905561
103 1223,Philippines,Asia,91077287.0,71.688,3190.481016
104 1235,Poland,Europe,38518241.0,75.563,15389.92468
105 1247,Portugal,Europe,10642836.0,78.098,20509.64777
106 1259,Puerto Rico,Americas,3942491.0,78.746,19328.70901
107 1271,Reunion,Africa,798094.0,76.442,7670.122558
108 1283,Romania,Europe,22276056.0,72.476,10808.47561
109 1295,Rwanda,Africa,8860588.0,46.242,863.0884639
110 1307,Sao Tome and Principe,Africa,199579.0,65.528,1598.435089
111 1319,Saudi Arabia,Asia,27601038.0,72.777,21654.83194
112 1331,Senegal,Africa,12267493.0,63.062,1712.472136
113 1343,Serbia,Europe,10150265.0,74.002,9786.534714
114 1355,Sierra Leone,Africa,6144562.0,42.568,862.5407561
115 1367,Singapore,Asia,4553009.0,79.972,47143.17964
116 1379,Slovak Republic,Europe,5447502.0,74.663,18678.31435
117 1391,Slovenia,Europe,2009245.0,77.926,25768.25759
118 1403,Somalia,Africa,9118773.0,48.159,926.1410683
119 1415,South Africa,Africa,43997828.0,49.339,9269.657808
120 1427,Spain,Europe,40448191.0,80.941,28821.0637
121 1439,Sri Lanka,Asia,20378239.0,72.396,3970.095407
122 1451,Sudan,Africa,42292929.0,58.556,2602.394995
123 1463,Swaziland,Africa,1133066.0,39.613,4513.480643
124 1475,Sweden,Europe,9031088.0,80.884,33859.74835
125 1487,Switzerland,Europe,7554661.0,81.701,37506.41907
126 1499,Syria,Asia,19314747.0,74.143,4184.548089
127 1511,Taiwan,Asia,23174294.0,78.4,28718.27684
128 1523,Tanzania,Africa,38139640.0,52.517,1107.482182
129 1535,Thailand,Asia,65068149.0,70.616,7458.396327
130 1547,Togo,Africa,5701579.0,58.42,882.9699438
131 1559,Trinidad and Tobago,Americas,1056608.0,69.819,18008.50924
132 1571,Tunisia,Africa,10276158.0,73.923,7092.923025
133 1583,Turkey,Europe,71158647.0,71.777,8458.276384
134 1595,Uganda,Africa,29170398.0,51.542,1056.380121
135 1607,United Kingdom,Europe,60776238.0,79.425,33203.26128
136 1619,United States,Americas,301139947.0,78.242,42951.65309
137 1631,Uruguay,Americas,3447496.0,76.384,10611.46299
138 1643,Venezuela,Americas,26084662.0,73.747,11415.80569
139 1655,Vietnam,Asia,85262356.0,74.249,2441.576404
140 1667,West Bank and Gaza,Asia,4018332.0,73.422,3025.349798
141 1679,"Yemen, Rep.",Asia,22211743.0,62.698,2280.769906
142 1691,Zambia,Africa,11746035.0,42.384,1271.211593
143 1703,Zimbabwe,Africa,12311143.0,43.487,469.7092981
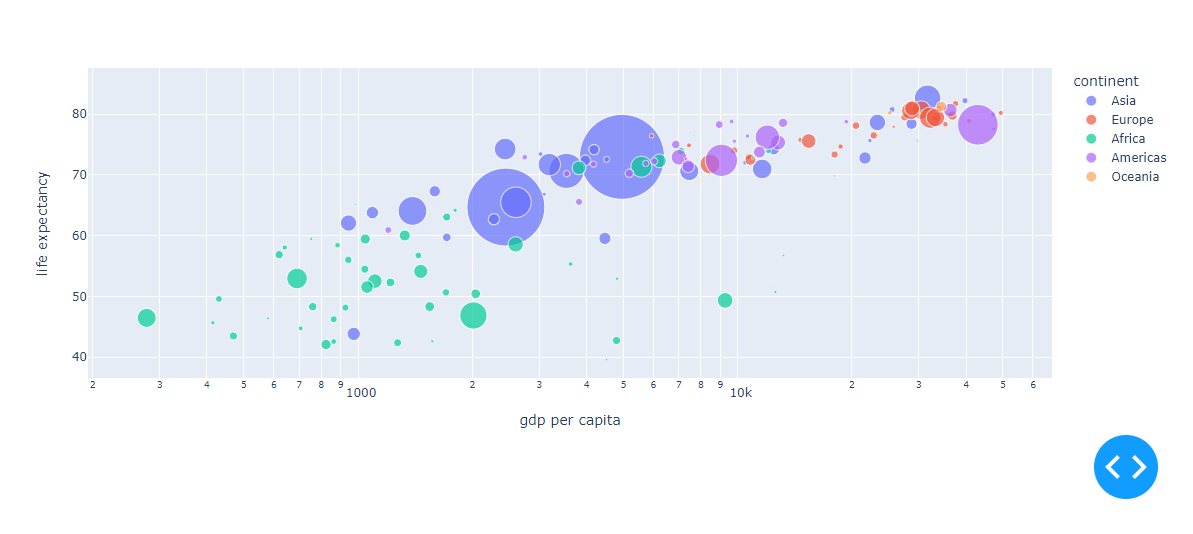
这些图表具有交互性和响应性。将鼠标悬停在点上以查看其值,单击图例项以切换轨迹,单击并拖动以缩放,按住shift键,单击并拖动以平移。
6.Markdown
虽然Dash通过dash_html_components (Dash.HTML)来编写HTML,但用HTML编写副本可能会很乏味。要编写文本块,可以使用dash_core_components(dash.dcc)中的Markdown组件。用下面的代码创建一个名为app.py的文件:
# Run this app with `python app.py` and
# visit http://127.0.0.1:8050/ in your web browser.
import dash
from dash import dcc    #import dash_core_components as dcc
from dash import html   #import dash_html_components as html

app = dash.Dash(__name__)
markdown_text = '''
### Dash and Markdown

Dash apps can be written in Markdown.
Dash uses the [CommonMark](http://commonmark.org/)
specification of Markdown.
Check out their [60 Second Markdown Tutorial](http://commonmark.org/help/)
if this is your first introduction to Markdown!
'''
app.layout = html.Div([
    dcc.Markdown(children=markdown_text)
])

if __name__ == '__main__':
    app.run_server(debug=True)

7.核心组件
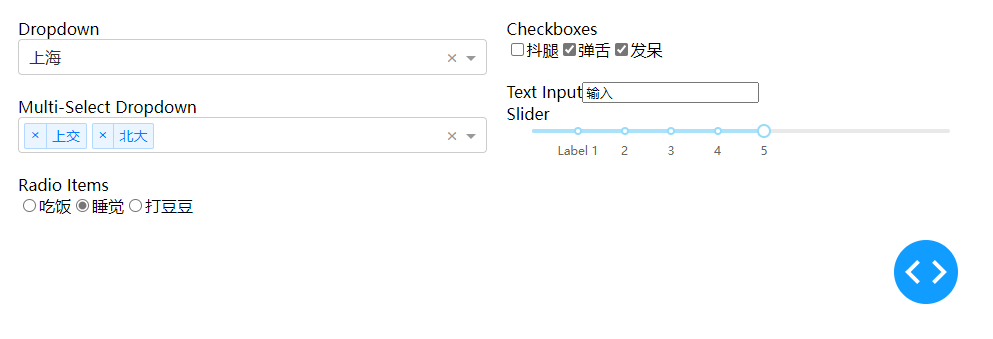
Dash_core_components(dash.dcc)包括一组高级组件,如下拉菜单、图表、标记块等等。
像所有的Dash组件一样,它们完全是声明式的描述。每个可配置的选项都可以作为组件的关键字参数使用。
我们将在整个教程中看到许多这样的组件。您可以在Dash核心组件库中查看所有可用组件。
下面是一些可用的组件。用下面的代码创建一个名为app.py的文件:
# Run this app with `python app.py` and
# visit http://127.0.0.1:8050/ in your web browser.
import dash
from dash import dcc    # import dash_core_components as dcc
from dash import html   # import dash_html_components as html

app = dash.Dash(__name__)

app.layout = html.Div([
    html.Div(children=[
        html.Label('Dropdown'),
        dcc.Dropdown(
            options=[
                {'label': '重庆', 'value': 'NYC'},
                {'label': '上海', 'value': 'MTL'},
                {'label': '北京', 'value': 'SF'}
            ],
            value='MTL'
        ),
        html.Br(),
        html.Label('Multi-Select Dropdown'),
        dcc.Dropdown(
            options=[
                {'label': '重邮', 'value': 'NYC'},
                {'label': '上交', 'value': 'MTL'},
                {'label': '北大', 'value': 'SF'}
            ],
            value=['MTL', 'SF'],
            multi=True
        ),
        html.Br(),
        html.Label('Radio Items'),
        dcc.RadioItems(
            options=[
                {'label': '吃饭', 'value': 'NYC'},
                {'label': '睡觉', 'value': 'MTL'},
                {'label': '打豆豆', 'value': 'SF'}
            ],
            value='MTL'
        ),
    ], style={'padding': 10, 'flex': 1}),
    html.Div(children=[
        html.Label('Checkboxes'),
        dcc.Checklist(
            options=[
                {'label': '抖腿', 'value': 'NYC'},
                {'label': '弹舌', 'value': 'MTL'},
                {'label': '发呆', 'value': 'SF'}
            ],
            value=['MTL', 'SF']
        ),
        html.Br(),
        html.Label('Text Input'),
        dcc.Input(value='输入', type='text'),
        html.Br(),
        html.Label('Slider'),
        dcc.Slider(
            min=0,
            max=9,
            marks={i: 'Label {}'.format(i) if i == 1 else str(i) for i in range(1, 6)},
            value=5,
        ),
    ], style={'padding': 10, 'flex': 1})
], style={'display': 'flex', 'flex-direction': 'row'})

if __name__ == '__main__':
    app.run_server(debug=True)
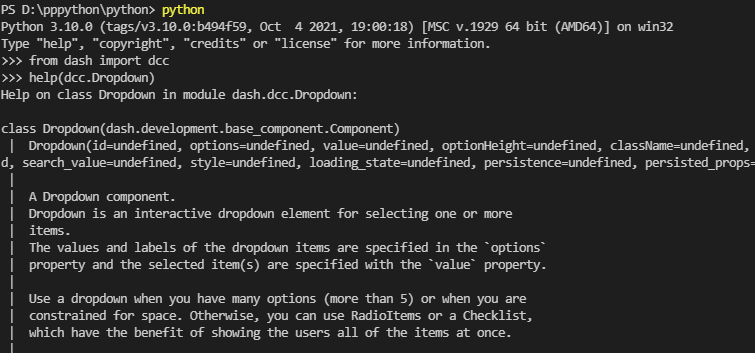
8.帮助
Dash组件是声明性的:这些组件都在实例化时通过关键字参数设置。
在您的Python控制台中调用任何组件的帮助,以了解有关组件及其可用参数的更多信息。
二.基础Dash 回调
#docBasic Callbacks | Dash for Python Documentation | Plotly
当输入组件的属性发生变化时,Dash会自动调用回调函数,以更新另一个组件(输出)中的一些属性。
为了获得最佳的用户交互和图表加载性能,生产版Dash应用程序应该考虑Job Queue、HPC、Datashader和Dash Enterprise的水平缩放功能。
让我们从一个简单的互动Dash应用程序的例子开始。
1.简单的Dash 交互应用
import dash
from dash import dcc
from dash import html
from dash import Input, Output

app = dash.Dash(__name__)

app.layout = html.Div([
    html.H6("改变输入观察回调!"),
    html.Div([
        "输入: ",
        dcc.Input(id='my-input', value='初始值', type='text')
    ]),
    html.Br(),
    html.Div(id='my-output',style={'font-size':'66px','color':'#A4F199','backgroundColor':'rgba(0,0,0,0.3)'}),

])
#回调函数绑定id 指定输入输出
@app.callback(
    Output(component_id='my-output', component_property='children'),#指定输出
    Input(component_id='my-input', component_property='value')#指定输入
)
def teste(input_value):#被回调的函数
    return '输出: {}'.format(input_value)


if __name__ == '__main__':
    app.run_server(debug=True)

让我们分解一下这个例子:
1.输入输出(input\output)被装饰器@app.callback修饰;
2.在Dash中,应用程序的输入和输出仅仅是特定组件的属性。在本例中,我们的输入是ID为“my-input”的组件的“value”属性。我们的输出是ID为my-output的组件的“children”属性
3.当输入属性发生变化时,回调装饰器包装的函数将被自动调用。Dash为这个回调函数提供了输入属性的新值作为它的参数,Dash用函数返回的任何内容更新输出组件的属性。
4. component id和component-property关键字是可选的(每个对象只有两个参数)。为了清晰起见,本例中包含了它们,但为了简洁性和可读性,在文档的其余部分将省略它们。
5. 不要混淆dash.dependencies.Input和dcc.Input对象的关系。前者只是回调定义,后者是确切的组件;
6. 注意,在布局中,我们没有为(my-output)组件的children属性设置值。当Dash应用程序启动时,它会自动使用输入组件的初始值调用的回调函数,以填充输出组件的初始状态。在这个例子中,如果你指定div组件为html.Div(id='myoutput', children='Hello worla'),它将在应用程序启动时被覆盖;
还记得每个组件是如何完全通过其关键字参数集来描述的吗?我们在Python中设置的参数变成了组件的属性,这些属性现在很重要。通过Dash的交互性,我们可以使用回调来动态更新这些属性。通常我们会更新HTML组件的children属性来显示新的文本,记住children负责组件的内容)或figure属性来使用图形组件以显示新数据。我们还可以更新组件的style(css),甚至是下拉组件(dcc.Dropdown)!
2.Dash 应用使用图表(Figure)和滑动(Slider)布局
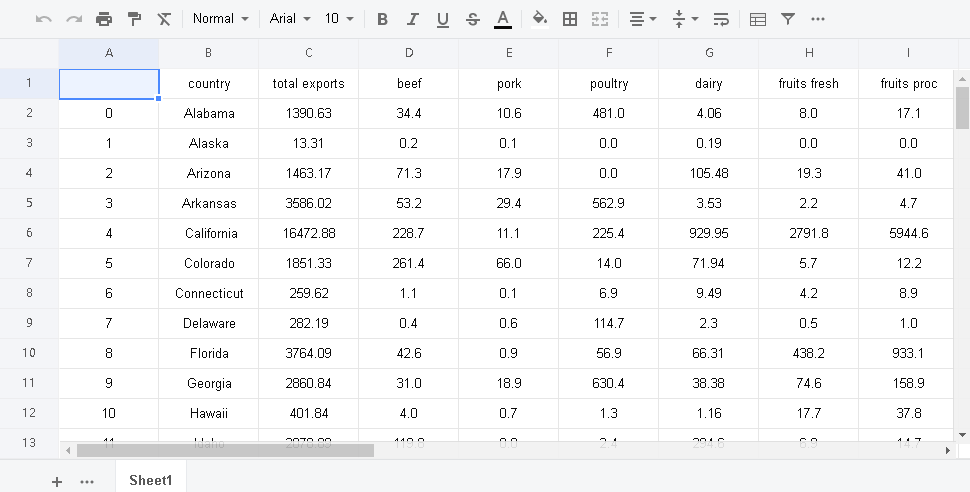
用于测试的csv 数据
,country,total exports,beef,pork,poultry,dairy,fruits fresh,fruits proc,total fruits,veggies fresh,countryx,continent,pop,lifeExp,gdpPercap,year
0,Alabama,1390.63,34.4,10.6,481.0,4.06,8.0,17.1,25.11,5.5,8.9,14.33,34.9,70.0,317.61,1999
1,Alaska,13.31,0.2,0.1,0.0,0.19,0.0,0.0,0.0,0.6,1.0,1.56,0.0,0.0,0.0,1999
2,Arizona,1463.17,71.3,17.9,0.0,105.48,19.3,41.0,60.27,147.5,239.4,386.91,7.3,48.7,423.95,1999
3,Arkansas,3586.02,53.2,29.4,562.9,3.53,2.2,4.7,6.88,4.4,7.1,11.45,69.5,114.5,665.44,2002
4, California,16472.88,228.7,11.1,225.4,929.95,2791.8,5944.6,8736.4,803.2,1303.5,2106.79,34.6,249.3,1064.95,2002
5,Colorado,1851.33,261.4,66.0,14.0,71.94,5.7,12.2,17.99,45.1,73.2,118.27,183.2,400.5,0.0,2002
6,Connecticut,259.62,1.1,0.1,6.9,9.49,4.2,8.9,13.1,4.3,6.9,11.16,0.0,0.0,0.0,2002
7,Delaware,282.19,0.4,0.6,114.7,2.3,0.5,1.0,1.53,7.6,12.4,20.03,26.9,22.9,0.0,2002
8,Florida,3764.09,42.6,0.9,56.9,66.31,438.2,933.1,1371.36,171.9,279.0,450.86,3.5,1.8,78.24,2002
9,Georgia,2860.84,31.0,18.9,630.4,38.38,74.6,158.9,233.51,59.0,95.8,154.77,57.8,65.4,1154.07,2002
10,Hawaii,401.84,4.0,0.7,1.3,1.16,17.7,37.8,55.51,9.5,15.4,24.83,0.0,0.0,0.0,2009
11,Idaho,2078.89,119.8,0.0,2.4,294.6,6.9,14.7,21.64,121.7,197.5,319.19,24.0,568.2,0.0,2010
12,Illinois,8709.48,53.7,394.0,14.0,45.82,4.0,8.5,12.53,15.2,24.7,39.95,2228.5,223.8,0.0,2010
13,Indiana,5050.23,21.9,341.9,165.6,89.7,4.1,8.8,12.98,14.4,23.4,37.89,1123.2,114.0,0.0,2010
14,Iowa,11273.76,289.8,1895.6,155.6,107.0,1.0,2.2,3.24,2.7,4.4,7.1,2529.8,3.1,0.0,2010
15,Kansas,4589.01,659.3,179.4,6.4,65.45,1.0,2.1,3.11,3.6,5.8,9.32,457.3,1426.5,43.98,2010
16,Kentucky,1889.15,54.8,34.2,151.3,28.27,2.1,4.5,6.6,0.0,0.0,0.0,179.1,149.3,0.0,2015
17,Louisiana,1914.23,19.8,0.8,77.2,6.02,5.7,12.1,17.83,6.6,10.7,17.25,91.4,78.7,280.42,2016
18,Maine,278.37,1.4,0.5,10.4,16.18,16.6,35.4,52.01,24.0,38.9,62.9,0.0,0.0,0.0,2016
19,Maryland,692.75,5.6,3.1,127.0,24.81,4.1,8.8,12.9,7.8,12.6,20.43,54.1,55.8,0.0,2016
20,Massachusetts,248.65,0.6,0.5,0.6,5.81,25.8,55.0,80.83,8.1,13.1,21.13,0.0,0.0,0.0,2016
21,Michigan,3164.16,37.7,118.1,32.6,214.82,82.3,175.3,257.69,72.4,117.5,189.96,381.5,247.0,0.0,2020
22,Minnesota,7192.33,112.3,740.4,189.2,218.05,2.5,5.4,7.91,45.9,74.5,120.37,1264.3,538.1,0.0,2016
23,Mississippi,2170.8,12.8,30.4,370.8,5.45,5.4,11.6,17.04,10.6,17.2,27.87,110.0,102.2,494.75,2016
24,Missouri,3933.42,137.2,277.3,196.1,34.26,4.2,9.0,13.18,6.8,11.1,17.9,428.8,161.7,345.29,2023
25,Montana,1718.0,105.0,16.7,1.7,6.82,1.1,2.2,3.3,17.3,28.0,45.27,5.4,1198.1,0.0,2024
26,Nebraska,7114.13,762.2,262.5,31.4,30.07,0.7,1.5,2.16,20.4,33.1,53.5,1735.9,292.3,0.0,2025
27,Nevada,139.89,21.8,0.2,0.0,16.57,0.4,0.8,1.19,10.6,17.3,27.93,0.0,5.4,0.0,2026
28,New Hampshire,73.06,0.6,0.2,0.8,7.46,2.6,5.4,7.98,1.7,2.8,4.5,0.0,0.0,0.0,2027
29,New Jersey,500.4,0.8,0.4,4.6,3.37,35.0,74.5,109.45,21.6,35.0,56.54,10.1,6.7,0.0,2028
30,New Mexico,751.58,117.2,0.1,0.3,191.01,32.6,69.3,101.9,16.7,27.1,43.88,11.2,13.9,72.62,2029
31,New York,1488.9,22.2,5.8,17.7,331.8,64.7,137.8,202.56,54.7,88.7,143.37,106.1,29.9,0.0,2030
32,North Carolina,3806.05,24.8,702.8,598.4,24.9,23.8,50.7,74.47,57.4,93.1,150.45,92.2,200.3,470.86,2031
33,North Dakota,3761.96,78.5,16.1,0.5,8.14,0.1,0.2,0.25,49.9,80.9,130.79,236.1,1664.5,0.0,2032
34,Ohio,3979.79,36.2,199.1,129.9,134.57,8.7,18.5,27.21,20.4,33.1,53.53,535.1,207.4,0.0,2033
35,Oklahoma,1646.41,337.6,265.3,131.1,24.35,3.0,6.3,9.24,3.4,5.5,8.9,27.5,324.8,110.54,2034
36,Oregon,1794.57,58.8,1.4,14.2,63.66,100.7,214.4,315.04,48.2,78.3,126.5,11.7,320.3,0.0,2035
37,Pennsylvania,1969.87,50.9,91.3,169.8,280.87,28.6,60.9,89.48,14.6,23.7,38.26,112.1,41.0,0.0,2036
38,Rhode Island,31.59,0.1,0.1,0.2,0.52,0.9,1.9,2.83,1.2,1.9,3.02,0.0,0.0,0.0,2037
39,South Carolina,929.93,15.2,10.9,186.5,7.62,17.1,36.4,53.45,16.3,26.4,42.66,32.1,55.3,206.1,2038
40,South Dakota,3770.19,193.5,160.2,29.3,46.77,0.3,0.5,0.8,1.5,2.5,4.06,643.6,704.5,0.0,2039
41,Tennessee,1535.13,51.1,17.6,82.4,21.18,2.0,4.2,6.23,9.4,15.3,24.67,88.8,100.0,363.83,2040
42,Texas,6648.22,961.0,42.7,339.2,240.55,31.9,68.0,99.9,43.9,71.3,115.23,167.2,309.7,2308.76,2041
43,Utah,453.39,27.9,59.0,23.1,48.6,3.9,8.4,12.34,2.5,4.1,6.6,5.3,42.8,0.0,2042
44,Vermont,180.14,6.2,0.2,0.9,65.98,2.6,5.4,8.01,1.5,2.5,4.05,0.0,0.0,0.0,2043
45,Virginia,1146.48,39.5,16.9,164.7,47.85,11.7,24.8,36.48,10.4,16.9,27.25,39.5,77.5,64.84,2044
46,Washington,3894.81,59.2,0.0,35.6,154.18,555.6,1183.0,1738.57,138.7,225.1,363.79,29.5,786.3,0.0,2045
47,West Virginia,138.89,12.0,0.3,45.4,3.9,3.7,7.9,11.54,0.0,0.0,0.0,3.5,1.6,0.0,2046
48,Wisconsin,3090.23,107.3,38.6,34.5,633.6,42.8,91.0,133.8,56.8,92.2,148.99,460.5,96.7,0.0,2047
49,Wyoming,349.69,75.1,33.2,0.1,2.89,0.1,0.1,0.17,3.9,6.3,10.23,9.0,20.7,0.0,2048
code
import dash
import dash_core_components as dcc
import dash_html_components as html
from dash.dependencies import Input, Output
import plotly.express as px

import pandas as pd

df = pd.read_csv('http://127.0.0.1:8000/1.csv')#python -m http.server 搭建的本地web服务
app = dash.Dash(__name__)
app.layout = html.Div([
    dcc.Graph(id='graph-with-slider'),
    dcc.Slider(
        id='year-slider',#年 滚动条
        min=df['year'].min(),#设定刻度可最大小值
        max=df['year'].max(),#设定刻度可最大小值
        value=df['year'].min(), #初始默认最小刻度处
        marks={str(year): str(year) for year in df['year'].unique()},#设定显示的刻度
        step=None
    )
])
@app.callback(
    Output('graph-with-slider', 'figure'),#绑定图表id
    Input('year-slider', 'value'))#绑定选择的年 刻度
def update_figure(selected_year):
    filtered_df = df[df.year == selected_year] #筛选所有当年 (该刻度)的数据
    fig = px.scatter(filtered_df, x="gdpPercap", y="lifeExp",#设定x y轴的数据项
                     size="pop", color="continent", hover_name="country",#鼠标移入显示的细节信息 (hover)
                     log_x=True, size_max=55)#size_max 最大刻度??
    fig.update_layout(transition_duration=500)#500ms 刷新一次?
    return fig #返回图表对象并显示


if __name__ == '__main__':
    app.run_server(debug=True)
显示demo如下
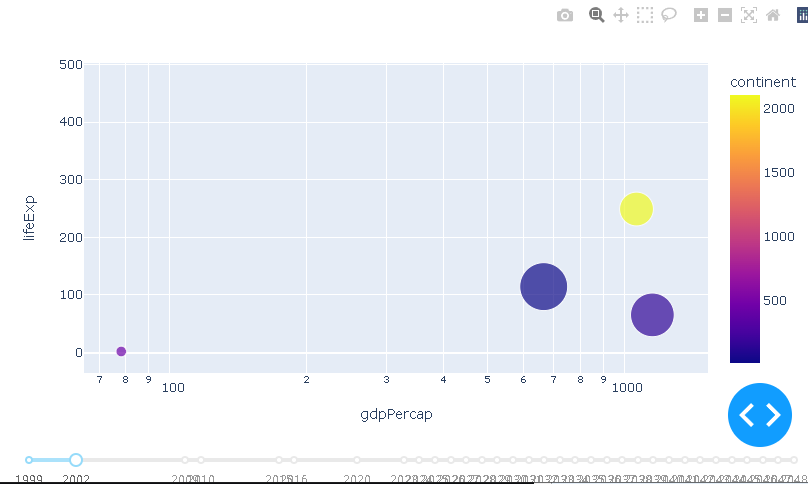
在这个例子中有一些不错的方法:
1.我们使用Pandas 库去加载我们的数据帧在应用运行之前:df = pd.read_csv('....') ,这个df对象是全局的,能在回调函数里去访问;
2.加载数据到内存里是便利的,在运行dash应用前需确保下载这个操作完成,当用户访问和与dash应用交互时,这个df (data)已经在内存中了,最好不要在回调函数中去准备数据;
3.回调不会修改原始数据,它只会通过使用 pandas 进行筛选来创建数据帧的副本。这很重要:您的回调永远不应该修改超出其范围的变量。如果回调修改了全局状态,则一个用户的会话可能会影响下一个用户的会话,并且当应用部署在多个进程或线程上时,这些修改将不会在会话之间共享。
4.layout,transition允许图表发生变化时运行动画以平滑过渡;
3.Dash 应用使用多个输入
在Dash中,任何“output”都可以有多个“input”组件。下面是一个绑定五个输入(两个dcc的value属性)的简单示例。俩个下拉组件dcc.Dropdown。俩个拨钮组件dcc.RadioItems,和一个dcc.Slider组件)到一个输出组件(dcc的Figure属性。图形组件dcc.Graph)。注意app.callback是如何在Output后面列出所有5个Input项的。
部分csv数据
Country Name,Indicator Name,Year,Value
Arab World,"Agriculture, value added (% of GDP)",1962,
Arab World,CO2 emissions (metric tons per capita),1962,0.760995978569
Arab World,Domestic credit provided by financial sector (% of GDP),1962,18.1686895397
Arab World,Electric power consumption (kWh per capita),1962,
Arab World,Energy use (kg of oil equivalent per capita),1962,
Arab World,Exports of goods and services (% of GDP),1962,
Arab World,"Fertility rate, total (births per woman)",1962,6.9644537164699996
Arab World,GDP growth (annual %),1962,
Arab World,Imports of goods and services (% of GDP),1962,
Arab World,"Industry, value added (% of GDP)",1962,
Arab World,"Inflation, GDP deflator (annual %)",1962,
Arab World,"Life expectancy at birth, total (years)",1962,48.008602901
Arab World,Population density (people per sq. km of land area),1962,7.1684738533
Arab World,"Services, etc., value added (% of GDP)",1962,
Caribbean small states,"Agriculture, value added (% of GDP)",1962,
Caribbean small states,CO2 emissions (metric tons per capita),1962,2.7038747574299995
Caribbean small states,Domestic credit provided by financial sector (% of GDP),1962,15.054971343900002
Caribbean small states,Electric power consumption (kWh per capita),1962,
Caribbean small states,Energy use (kg of oil equivalent per capita),1962,
Caribbean small states,Exports of goods and services (% of GDP),1962,53.285880543699996
Caribbean small states,"Fertility rate, total (births per woman)",1962,5.52302044416
Caribbean small states,GDP growth (annual %),1962,
Caribbean small states,Imports of goods and services (% of GDP),1962,53.5410416247
Caribbean small states,"Industry, value added (% of GDP)",1962,
Caribbean small states,"Inflation, GDP deflator (annual %)",1962,
Caribbean small states,"Life expectancy at birth, total (years)",1962,63.27171776229999
Caribbean small states,Population density (people per sq. km of land area),1962,10.7612722332
Caribbean small states,"Services, etc., value added (% of GDP)",1962,
Central Europe and the Baltics,"Agriculture, value added (% of GDP)",1962,
Central Europe and the Baltics,CO2 emissions (metric tons per capita),1962,5.67398699024
Central Europe and the Baltics,Domestic credit provided by financial sector (% of GDP),1962,
Central Europe and the Baltics,Electric power consumption (kWh per capita),1962,
Central Europe and the Baltics,Energy use (kg of oil equivalent per capita),1962,
Central Europe and the Baltics,Exports of goods and services (% of GDP),1962,
Central Europe and the Baltics,"Fertility rate, total (births per woman)",1962,2.31137778329
Central Europe and the Baltics,GDP growth (annual %),1962,
Central Europe and the Baltics,Imports of goods and services (% of GDP),1962,
Central Europe and the Baltics,"Industry, value added (% of GDP)",1962,
Central Europe and the Baltics,"Inflation, GDP deflator (annual %)",1962,
Central Europe and the Baltics,"Life expectancy at birth, total (years)",1962,68.0077933168
Central Europe and the Baltics,Population density (people per sq. km of land area),1962,84.1028476463
Central Europe and the Baltics,"Services, etc., value added (% of GDP)",1962,
Early-demographic dividend,"Agriculture, value added (% of GDP)",1962,
Early-demographic dividend,CO2 emissions (metric tons per capita),1962,0.623761075266
Early-demographic dividend,Domestic credit provided by financial sector (% of GDP),1962,22.6410753035
Early-demographic dividend,Electric power consumption (kWh per capita),1962,
Early-demographic dividend,Energy use (kg of oil equivalent per capita),1962,
Early-demographic dividend,Exports of goods and services (% of GDP),1962,11.1587321223
Early-demographic dividend,"Fertility rate, total (births per woman)",1962,6.13830620013
Early-demographic dividend,GDP growth (annual %),1962,4.15383252523
Early-demographic dividend,Imports of goods and services (% of GDP),1962,11.4113861727
Early-demographic dividend,"Industry, value added (% of GDP)",1962,
Early-demographic dividend,"Inflation, GDP deflator (annual %)",1962,1.94237042555
Early-demographic dividend,"Life expectancy at birth, total (years)",1962,46.4260962142
Early-demographic dividend,Population density (people per sq. km of land area),1962,30.9003592989
Early-demographic dividend,"Services, etc., value added (% of GDP)",1962,
East Asia & Pacific,"Agriculture, value added (% of GDP)",1962,
East Asia & Pacific,CO2 emissions (metric tons per capita),1962,0.894870615738
East Asia & Pacific,Domestic credit provided by financial sector (% of GDP),1962,
East Asia & Pacific,Electric power consumption (kWh per capita),1962,
East Asia & Pacific,Energy use (kg of oil equivalent per capita),1962,
East Asia & Pacific,Exports of goods and services (% of GDP),1962,11.2425923201
East Asia & Pacific,"Fertility rate, total (births per woman)",1962,5.54754303076
East Asia & Pacific,GDP growth (annual %),1962,6.20989184
East Asia & Pacific,Imports of goods and services (% of GDP),1962,11.7798591851
East Asia & Pacific,"Industry, value added (% of GDP)",1962,
East Asia & Pacific,"Inflation, GDP deflator (annual %)",1962,
East Asia & Pacific,"Life expectancy at birth, total (years)",1962,49.4229605536
East Asia & Pacific,Population density (people per sq. km of land area),1962,43.4376541609
East Asia & Pacific,"Services, etc., value added (% of GDP)",1962,
East Asia & Pacific (excluding high income),"Agriculture, value added (% of GDP)",1962,40.2225807366
East Asia & Pacific (excluding high income),CO2 emissions (metric tons per capita),1962,0.561665530212
East Asia & Pacific (excluding high income),Domestic credit provided by financial sector (% of GDP),1962,
East Asia & Pacific (excluding high income),Electric power consumption (kWh per capita),1962,
East Asia & Pacific (excluding high income),Energy use (kg of oil equivalent per capita),1962,
East Asia & Pacific (excluding high income),Exports of goods and services (% of GDP),1962,6.919595844460001
East Asia & Pacific (excluding high income),"Fertility rate, total (births per woman)",1962,6.03860028913
East Asia & Pacific (excluding high income),GDP growth (annual %),1962,-0.215937002259
East Asia & Pacific (excluding high income),Imports of goods and services (% of GDP),1962,6.035706151880001
East Asia & Pacific (excluding high income),"Industry, value added (% of GDP)",1962,29.216751456999997
East Asia & Pacific (excluding high income),"Inflation, GDP deflator (annual %)",1962,
East Asia & Pacific (excluding high income),"Life expectancy at birth, total (years)",1962,46.620071671800005
East Asia & Pacific (excluding high income),Population density (people per sq. km of land area),1962,56.966386772
East Asia & Pacific (excluding high income),"Services, etc., value added (% of GDP)",1962,31.026108708600002
East Asia & Pacific (IDA & IBRD countries),"Agriculture, value added (% of GDP)",1962,40.2225807366
East Asia & Pacific (IDA & IBRD countries),CO2 emissions (metric tons per capita),1962,0.560754345699
East Asia & Pacific (IDA & IBRD countries),Domestic credit provided by financial sector (% of GDP),1962,
East Asia & Pacific (IDA & IBRD countries),Electric power consumption (kWh per capita),1962,
East Asia & Pacific (IDA & IBRD countries),Energy use (kg of oil equivalent per capita),1962,
East Asia & Pacific (IDA & IBRD countries),Exports of goods and services (% of GDP),1962,6.919595844460001
East Asia & Pacific (IDA & IBRD countries),"Fertility rate, total (births per woman)",1962,6.06991600518
East Asia & Pacific (IDA & IBRD countries),GDP growth (annual %),1962,-0.215937002259
East Asia & Pacific (IDA & IBRD countries),Imports of goods and services (% of GDP),1962,6.035706151880001
East Asia & Pacific (IDA & IBRD countries),"Industry, value added (% of GDP)",1962,29.216751456999997
East Asia & Pacific (IDA & IBRD countries),"Inflation, GDP deflator (annual %)",1962,
East Asia & Pacific (IDA & IBRD countries),"Life expectancy at birth, total (years)",1962,46.5510630104
East Asia & Pacific (IDA & IBRD countries),Population density (people per sq. km of land area),1962,56.6489330732
East Asia & Pacific (IDA & IBRD countries),"Services, etc., value added (% of GDP)",1962,31.026108708600002
Euro area,"Agriculture, value added (% of GDP)",1962,
Euro area,CO2 emissions (metric tons per capita),1962,
Euro area,Domestic credit provided by financial sector (% of GDP),1962,37.6286044559
Euro area,Electric power consumption (kWh per capita),1962,1392.42201129
Euro area,Energy use (kg of oil equivalent per capita),1962,1566.55425905
Euro area,Exports of goods and services (% of GDP),1962,17.9798923508
Euro area,"Fertility rate, total (births per woman)",1962,2.63860990563
Euro area,GDP growth (annual %),1962,6.389289445599999
code
import dash
import dash_core_components as dcc
import dash_html_components as html
from dash.dependencies import Input, Output
import plotly.express as px

import pandas as pd

app = dash.Dash(__name__)
df = pd.read_csv('https://plotly.github.io/datasets/country_indicators.csv')
available_indicators = df['Indicator Name'].unique() #去除重复

app.layout = html.Div([
    html.Div([
        html.Div([
            dcc.Dropdown(
                id='xaxis-column',
                options=[{'label': i, 'value': i} for i in available_indicators],#设定下拉项名和值
                value='Fertility rate, total (births per woman)'
            ),
            dcc.RadioItems(
                id='xaxis-type',
                options=[{'label': i, 'value': i} for i in ['Linear', 'Log']],#设置线性or对数显示
                value='Linear',
                labelStyle={'display': 'inline-block'}
            )
        ], style={'width': '48%', 'display': 'inline-block'}),

        html.Div([
            dcc.Dropdown(
                id='yaxis-column',
                options=[{'label': i, 'value': i} for i in available_indicators],
                value='Life expectancy at birth, total (years)'
            ),
            dcc.RadioItems(
                id='yaxis-type',
                options=[{'label': i, 'value': i} for i in ['Linear', 'Log']],
                value='Linear',
                labelStyle={'display': 'inline-block'}
            )
        ], style={'width': '48%', 'float': 'right', 'display': 'inline-block'})
    ]),
    dcc.Graph(id='indicator-graphic'),
    dcc.Slider(
        id='year--slider',
        min=df['Year'].min(),
        max=df['Year'].max(),
        value=df['Year'].max(),
        marks={str(year): str(year) for year in df['Year'].unique()},
        step=None
    )
])


@app.callback(
    Output('indicator-graphic', 'figure'),
    Input('xaxis-column', 'value'),
    Input('yaxis-column', 'value'),
    Input('xaxis-type', 'value'),
    Input('yaxis-type', 'value'),
    Input('year--slider', 'value'))
def update_graph(xaxis_column_name, yaxis_column_name,#按顺序一一对应输入
                 xaxis_type, yaxis_type,
                 year_value):
    dff = df[df['Year'] == year_value] #筛选数据

    fig = px.scatter(x=dff[dff['Indicator Name'] == xaxis_column_name]['Value'],
                     y=dff[dff['Indicator Name'] == yaxis_column_name]['Value'],
                     hover_name=dff[dff['Indicator Name'] == yaxis_column_name]['Country Name'])

    fig.update_layout(margin={'l': 40, 'b': 40, 't': 10, 'r': 0}, hovermode='closest') #不清楚干啥的

    fig.update_xaxes(title=xaxis_column_name,
                     type='linear' if xaxis_type == 'Linear' else 'log')#设定x轴是否对数显示
    fig.update_yaxes(title=yaxis_column_name,
                     type='linear' if yaxis_type == 'Linear' else 'log')#设定y轴是否对数显示
    return fig

if __name__ == '__main__':
    app.run_server(debug=True)
显示如下
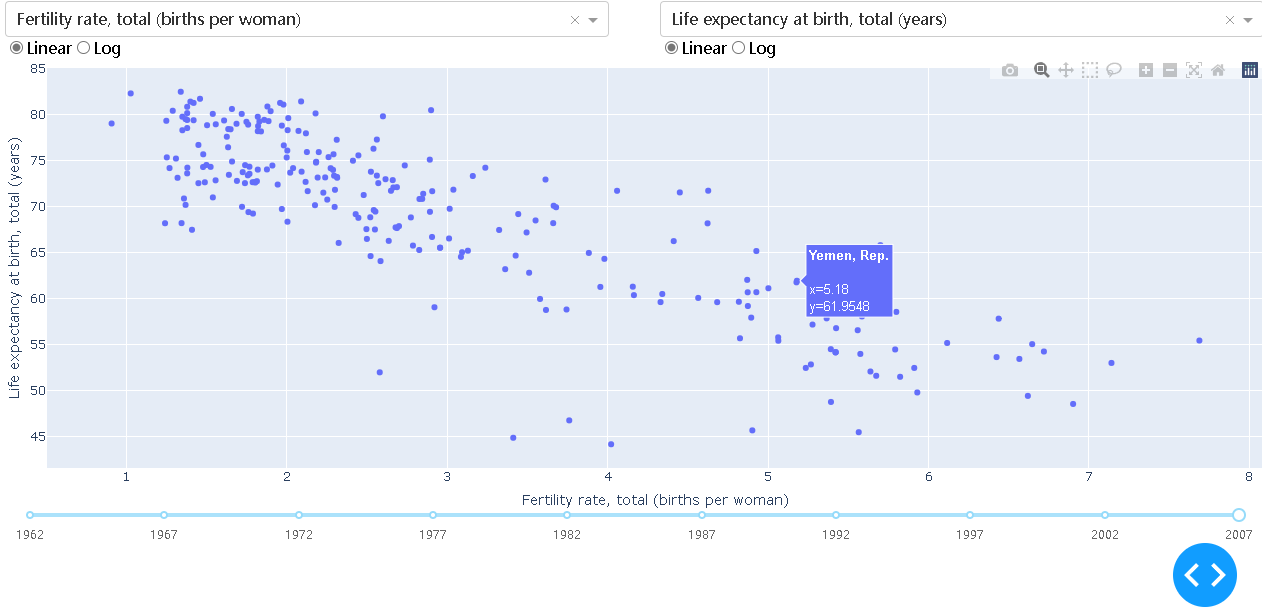
在本例中,当dcc.Dropdown, dcc.Slider, 或者 dcc.RadioItems组件值发生改变就调用回调函数;
回调的输入参数是每个“input”属性的当前值,按照它们被指定的顺序。
即使一次只有一个Input改变(即用户只能在给定时刻改变一个下拉菜单的值),Dash收集所有指定Input属性的当前状态,并将它们传递给回调函数。这些回调函数总是保证接收应用程序的更新状态。
让我们扩展示例以包含多个输出。
4.Dash 应用使用多个输出
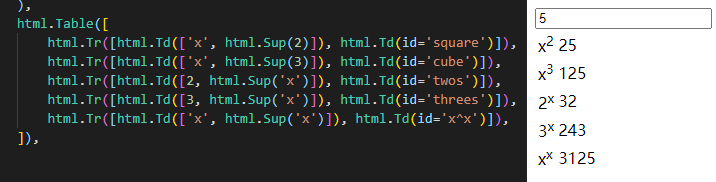
到目前为止,我们编写的所有回调只更新了一个Output属性。我们还可以一次更新多个输出:列出你想在app.callback中更新的所有属性,并从回调中返回那么多项。如果两个输出依赖于相同的复杂计算的结果,比如一个慢速的数据库查询,这就特别有用。
import dash
from dash import dcc
from dash import html
from dash import Input, Output

# external_stylesheets = ['https://codepen.io/chriddyp/pen/bWLwgP.css']

app = dash.Dash(__name__)

app.layout = html.Div([
    dcc.Input(
        id='num-multi',
        type='number',
        value=5
    ),
    html.Table([
        html.Tr([html.Td(['x', html.Sup(2)]), html.Td(id='square')]),
        html.Tr([html.Td(['x', html.Sup(3)]), html.Td(id='cube')]),
        html.Tr([html.Td([2, html.Sup('x')]), html.Td(id='twos')]),
        html.Tr([html.Td([3, html.Sup('x')]), html.Td(id='threes')]),
        html.Tr([html.Td(['x', html.Sup('x')]), html.Td(id='x^x')]),
    ]),
])

@app.callback(
    Output('square', 'children'),
    Output('cube', 'children'),
    Output('twos', 'children'),
    Output('threes', 'children'),
    Output('x^x', 'children'),
    Input('num-multi', 'value'))
def callback_a(x):
    return x**2, x**3, 2**x, 3**x, x**x
if __name__ == '__main__':
    app.run_server(debug=True)
输出情况如下
合并输出并不总是一个好主意:
- 如果输出依赖于某些(而不是全部)相同输入,那么将它们分开可以避免不必要的更新。
- 如果输出具有相同的输入,但它们使用这些输入执行非常不同的计算,保持回调分离可以允许它们并行运行。
5.Dash应用的链式回调
你也可以将输出和输入链接在一起:一个回调函数的输出可以是另一个回调函数的输入。
这个模式可以用于创建动态ui,例如,一个输入组件更新另一个输入组件的可用选项。
这里有一个简单的例子
# -*- coding: utf-8 -*-
import dash
from dash import dcc
from dash import html
from dash import Input, Output

# external_stylesheets = ['https://codepen.io/chriddyp/pen/bWLwgP.css']

app = dash.Dash(__name__)#, external_stylesheets=external_stylesheets

all_options = {
    '重庆': ['綦江', '合川', '巫山','渝北'],
    '四川': ['成都', '凉山', '眉山']
}
app.layout = html.Div([
    dcc.RadioItems(
        id='countries-radio',
        options=[{'label': k, 'value': k} for k in all_options.keys()],#给每个拨钮命名和赋值
        value='四川'#设置初始值
    ),
    html.Hr(),
    dcc.RadioItems(id='cities-radio'),
    html.Hr(),
    html.Div(id='display-selected-values')
])

@app.callback(
    Output('cities-radio', 'options'),
    Input('countries-radio', 'value'))
def set_cities_options(selected_country):#根据输入值动态更新选项
    return [{'label': i, 'value': i} for i in all_options[selected_country]]

@app.callback(
    Output('cities-radio', 'value'),
    Input('cities-radio', 'options'))#根据二级拨钮的更新更新输出文本
def set_cities_value(available_options):
    return available_options[0]['value']

@app.callback(
    Output('display-selected-values', 'children'),
    Input('countries-radio', 'value'),
    Input('cities-radio', 'value'))
def set_display_children(selected_country, selected_city):
    return u'{} under {}'.format(
        selected_city, selected_country,
    )

if __name__ == '__main__':
    app.run_server(debug=True)
效果如下

6.Dash 应用状态
在某些情况下,您的应用程序中可能有一个类似于“表单”的模式。在这种情况下,您可能想要读取输入组件的值,但只能在用户在表单中输入完所有信息时读取,而不是在表单更改后立即读取。
这是将回调函数直接绑定到输入值上的code,如下所示:
# -*- coding: utf-8 -*-
import dash
from dash import dcc
from dash import html
from dash import Input, Output

# external_stylesheets = ["https://codepen.io/chriddyp/pen/bWLwgP.css"]

app = dash.Dash(__name__)#, external_stylesheets=external_stylesheets
app.layout = html.Div([
    dcc.Input(id="input-1", type="text", value="what"),
    dcc.Input(id="input-2", type="text", value="happens"),
    html.Div(id="number-output"),
])

@app.callback(
    Output("number-output", "children"),
    Input("input-1", "value"),
    Input("input-2", "value"),
)
def update_output(input1, input2):
    return u'Input 1 is "{}" and Input 2 is "{}"'.format(input1, input2)

if __name__ == "__main__":
    app.run_server(debug=True)

在本例中,只要Input所描述的任何属性发生更改,就会触发回调函数。通过在上面的输入中输入数据来尝试一下。
state允许你传递额外的值而不触发回调。这里是与上面相同的例子,但与两个dcc.Input组件作为State,一个新的按钮组件作为输入。
import dash
from dash import dcc
from dash import html
from dash import Input, Output,State

# external_stylesheets = ['https://codepen.io/chriddyp/pen/bWLwgP.css']

app = dash.Dash(__name__)#, external_stylesheets=external_stylesheets

app.layout = html.Div([
    dcc.Input(id='input-1-state', type='text', value='nice'),
    dcc.Input(id='input-2-state', type='text', value='good'),
    html.Button(id='submit-button-state', n_clicks=0, children='Submit'),
    html.Div(id='output-state')
])

@app.callback(Output('output-state', 'children'),
              Input('submit-button-state', 'n_clicks'),
              State('input-1-state', 'value'),
              State('input-2-state', 'value'))
def update_output(n_clicks, input1, input2):
    return u'''
        按键次数 {} ,
        输入框1: "{}",
        输入框2: "{}"
    '''.format(n_clicks, input1, input2)

if __name__ == '__main__':
    app.run_server(debug=True)

在这个例子中,输入不会触发回调,点击按钮才会,但是我们需要使用输入的值,所以使用state描述id;
7.总结
我们已经介绍了回调的基本原理,dash应用建立在一组简单但强大的原则之上:ui可以通过响应回调进行定制。组件的每个属性/属性都可以被修改为回调的输出,而属性的一个子集(例如dcc的value属性)。下拉组件),用户可以通过与页面交互进行编辑。


【推荐】国内首个AI IDE,深度理解中文开发场景,立即下载体验Trae
【推荐】编程新体验,更懂你的AI,立即体验豆包MarsCode编程助手
【推荐】抖音旗下AI助手豆包,你的智能百科全书,全免费不限次数
【推荐】轻量又高性能的 SSH 工具 IShell:AI 加持,快人一步
· SQL Server 2025 AI相关能力初探
· Linux系列:如何用 C#调用 C方法造成内存泄露
· AI与.NET技术实操系列(二):开始使用ML.NET
· 记一次.NET内存居高不下排查解决与启示
· 探究高空视频全景AR技术的实现原理
· 阿里最新开源QwQ-32B,效果媲美deepseek-r1满血版,部署成本又又又降低了!
· 单线程的Redis速度为什么快?
· SQL Server 2025 AI相关能力初探
· AI编程工具终极对决:字节Trae VS Cursor,谁才是开发者新宠?
· 展开说说关于C#中ORM框架的用法!