
[matplotlib-学习笔记01] 使用指南ing
1.概述
层次结构的下一层是面向对象接口的第一级,其中pyplot仅用于一些函数,如图形创建,用户显式地创建并跟踪图形(figure)和坐标轴(axes)对象。在这个级别,用户使用pyplot来创建图形,通过这些图形,可以创建一个或多个轴对象。这些轴对象随后用于大多数绘图操作。
为了获得更多的控制——对于像在GUI应用程序中嵌入matplotlib图这样的事情来说,这是必不可少的——pyplot级别可以完全删除,只留下一个
import matplotlib.pyplot as plt
import numpy as np
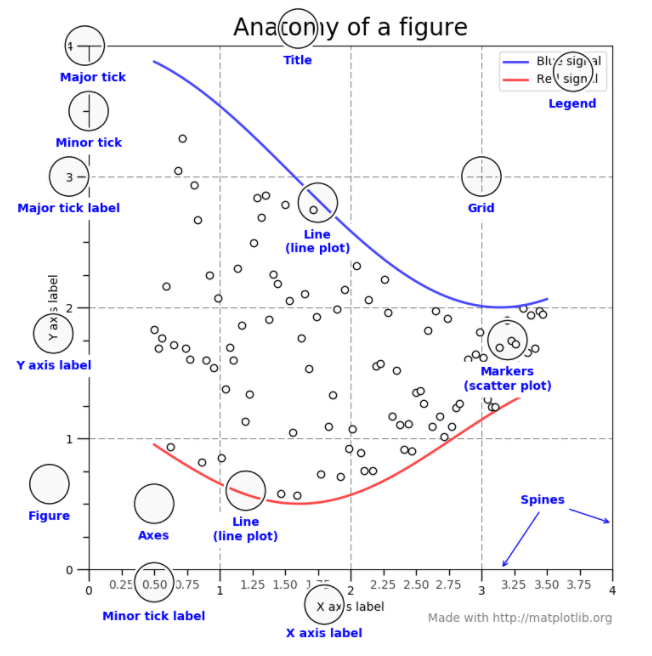
2.图像中的各个部分
a.图像(Figure)
图像对象,用于显示坐标图和子坐标图;
exp:
import matplotlib.pyplot as plt

fig = plt.figure()
fig.suptitle("ss")
fig.show()
input("")
显示如下;
b.坐标轴线(Axes)
这就是你认为的坐标图,它是带有数据空间的图像区域。一个给定的图形可以包含多个坐标轴(Axes),但是一个坐标轴(Axes)只能在一个图像(Figure)里。这个坐标轴对象包含两条或者三条轴线(Axis)对象,可以通过set_xlim()、set_ylim()设置坐标最大值,set_title()设置标题,set_xlabel()、set_ylabel()设置x,y标签;
绑定到单个坐标轴的数据对象不能被多个轴共享,也不能从一个轴移动到另一个轴。
fig = plt.figure()  # an empty figure with no axes
fig.suptitle('No axes on this figure')  # Add a title so we know which it is

fig, ax_lst = plt.subplots(2, 2)  # a figure with a 2x2 grid of Axes
3.绘图函数的输入类型
所有的绘图函数都期望使用np.array或者使用np.ma.masked_array作为输入,一些类数组类型的类如pandas 数据对象和np.matrix 可能不能正常的预期工作,最好是转换为np.array对象;
exp,转换一个 padas.DataFrame
a = pandas.DataFrame(np.random.rand(4,5), columns = list('abcde'))
a_asarray = a.values #为需要的类型
exp,转换一个 np.matrix
b = np.matrix([[1,2],[3,4]])
b_asarray = np.asarray(b)
4.Matplotlib, pyplot and pylab 之间有什么联系?
Matplotlib 是一整个包,pyplot(matplotlib.pyplot)只是这个包中的一个模块
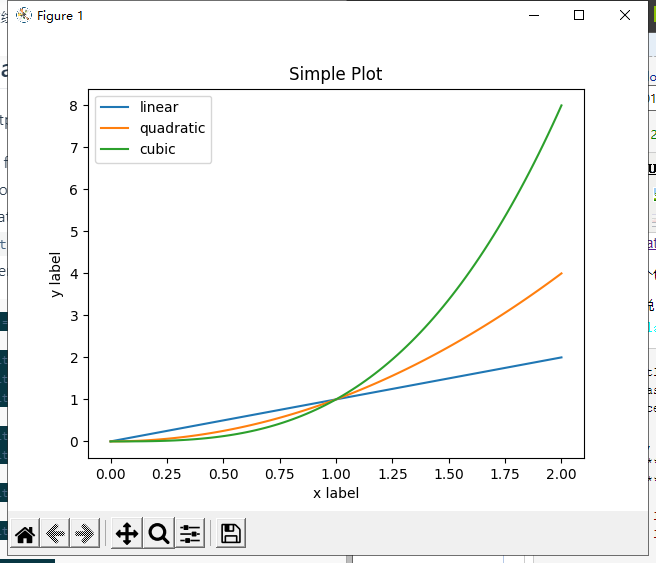
对于pyplot模块来说,它的函数总是作用于当前这个对象(figure),如下面code,第一次调用plt.plot会创建这个坐标轴,第二次调用plt.plot只会在原有的坐标轴上添加一条线,plt.xlabel, plt.ylabel, plt.title 和plt.legend 分别设置坐标轴标签、标题和图例;

import matplotlib.pyplot as plt
import numpy as np
x = np.linspace(0, 2, 100)

plt.plot(x, x, label='linear')
plt.plot(x, x**2, label='quadratic')
plt.plot(x, x**3, label='cubic')

plt.xlabel('x label')
plt.ylabel('y label')

plt.title("Simple Plot")
plt.legend()
plt.show()
Pylab是一个方便的模块,它批量导入matplotlib。Pyplot(打开新窗口)(用于绘图)和numpy(打开新窗口)(用于数学和使用数组)在单个名称空间中。Pylab已弃用,强烈建议不要使用它,因为它会污染名称空间。使用pyplot代替。
对于非交互式绘图,建议使用pyplot来创建图形,然后使用面向对象界面来绘图。
5.代码风格
在查看此文档和示例时,您将发现不同的编码风格和使用模式。这些风格都是有效的,都有自己的优缺点。几乎所有的例子都可以转换成另一种风格,并达到相同的效果。唯一需要注意的是,要避免在您自己的代码中混合使用这两种编码风格。
在不同的样式中,有两种是官方支持的。因此,这两种是使用matplotlib的首选方法。
对于pyplot风格,脚本的顶部导入通常是:
import matplotlib.pyplot as plt
import numpy as np
然后调用,例如:np.arange、np.zeros、np.pi、np.figure、plt.plot、plt.show,等等。
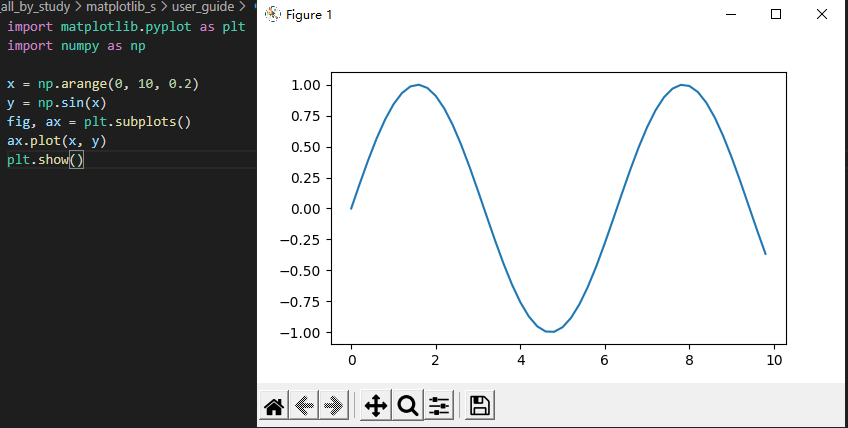
使用pyplot 接口去创建图像,然后调用对象方法;
x = np.arange(0, 10, 0.2)
y = np.sin(x)
fig, ax = plt.subplots()
ax.plot(x, y)
plt.show()
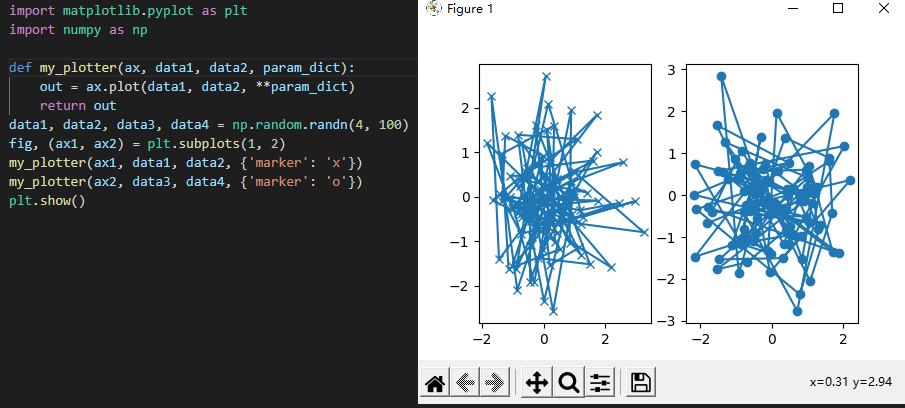
如果想绘制俩个子图:
6.什么是交互模式
a.线段简化
import numpy as np
import matplotlib.pyplot as plt
import matplotlib as mpl

# Setup, and create the data to plot
y = np.random.rand(100000)
y[50000:] *= 2
y[np.logspace(1, np.log10(50000), 400).astype(int)] = -1
mpl.rcParams['path.simplify'] = True

mpl.rcParams['path.simplify_threshold'] = 0.0
plt.plot(y)
plt.show()

mpl.rcParams['path.simplify_threshold'] = 1.0
plt.plot(y)
plt.show()
b.标记简化
markevery使用;
plt.plot(x, y, markevery=10)
7.tkinter内嵌matplotlib
#Embedding in Tk — Matplotlib 3.4.3 documentation
#tkinter内嵌Matplotlib系列(一)之解读官网教材 - 梦并不遥远 - 博客园 (cnblogs.com)
官网例程;
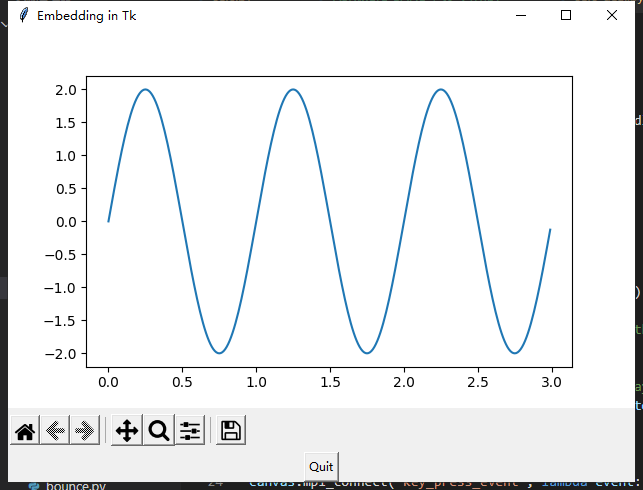
import tkinter
from matplotlib.backends.backend_tkagg import (
    FigureCanvasTkAgg, NavigationToolbar2Tk)
# Implement the default Matplotlib key bindings.
from matplotlib.backend_bases import key_press_handler
from matplotlib.figure import Figure
import numpy as np

root = tkinter.Tk()
root.wm_title("Embedding in Tk")

fig = Figure(figsize=(5, 4), dpi=100)
t = np.arange(0, 3, .01)
fig.add_subplot().plot(t, 2 * np.sin(2 * np.pi * t))

canvas = FigureCanvasTkAgg(fig, master=root)  # A tk.DrawingArea.
canvas.draw()

pack_toolbar=False #will make it easier to use a layout manager later on.
toolbar = NavigationToolbar2Tk(canvas, root, pack_toolbar=False)
toolbar.update()


canvas.mpl_connect("key_press_event", lambda event: print(f"you pressed {event.key}"))
canvas.mpl_connect("key_press_event", key_press_handler)

button = tkinter.Button(master=root, text="Quit", command=root.quit)

# Packing order is important. Widgets are processed sequentially and if there
# is no space left, because the window is too small, they are not displayed.
# The canvas is rather flexible in its size, so we pack it last which makes
# sure the UI controls are displayed as long as possible.
button.pack(side=tkinter.BOTTOM)
toolbar.pack(side=tkinter.BOTTOM, fill=tkinter.X)
canvas.get_tk_widget().pack(side=tkinter.TOP, fill=tkinter.BOTH, expand=1)

tkinter.mainloop()
显示如下:
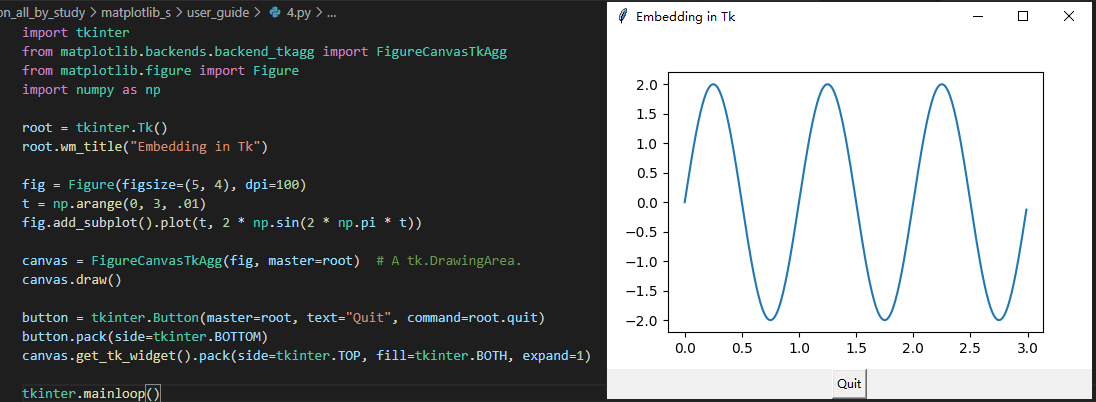
去掉toolbar部分代码后:
import tkinter
from matplotlib.backends.backend_tkagg import FigureCanvasTkAgg
from matplotlib.figure import Figure
import numpy as np

root = tkinter.Tk()
root.wm_title("Embedding in Tk")

fig = Figure(figsize=(5, 4), dpi=100)
t = np.arange(0, 3, .01)
fig.add_subplot().plot(t, 2 * np.sin(2 * np.pi * t))

canvas = FigureCanvasTkAgg(fig, master=root)  # A tk.DrawingArea.
canvas.draw()

button = tkinter.Button(master=root, text="Quit", command=root.quit)
button.pack(side=tkinter.BOTTOM)
canvas.get_tk_widget().pack(side=tkinter.TOP, fill=tkinter.BOTH, expand=1)

tkinter.mainloop()
显示如下:
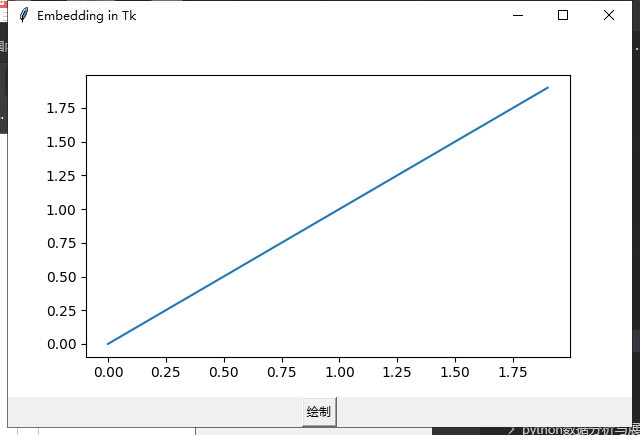
修改,绘图刷新;
from math import radians
import tkinter
from matplotlib.backends.backend_tkagg import FigureCanvasTkAgg
from matplotlib.figure import Figure
import numpy as np
i=0
def draw_line():
    xx1.cla() #清除绘图
    global i
    i=i+1
    x = np.arange(0,2,0.1)
    xx1.plot(x,i*x)

    canvas.draw()
root = tkinter.Tk()
root.wm_title("Embedding in Tk")

fig = Figure(figsize=(5, 4), dpi=100)
t = np.arange(0, 3, .01)
xx1= fig.add_subplot()
xx1.plot(t, 2 * np.sin(2 * np.pi * t))

canvas = FigureCanvasTkAgg(fig, master=root)  # A tk.DrawingArea.
canvas.draw()

button = tkinter.Button(master=root, text="绘制", command=draw_line)
button.pack(side=tkinter.BOTTOM)
canvas.get_tk_widget().pack(side=tkinter.TOP, fill=tkinter.BOTH, expand=1)

tkinter.mainloop()
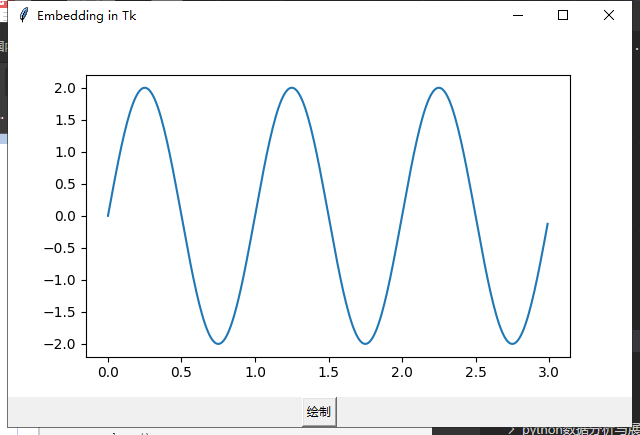
点击绘制;
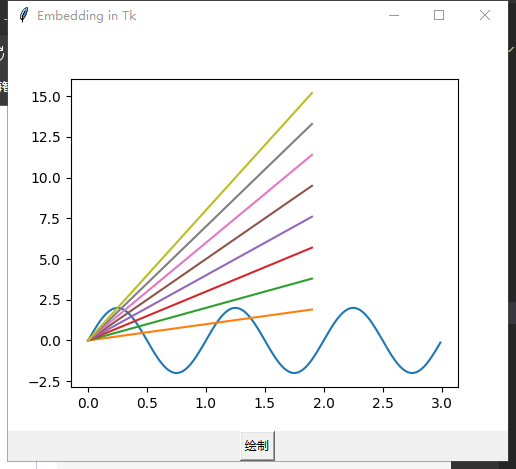
code,多次绘制在同一个坐标图上;
from math import radians
import tkinter
from matplotlib.backends.backend_tkagg import FigureCanvasTkAgg
from matplotlib.figure import Figure
import numpy as np
i=0
def draw_line():
    # xx1.cla() #清除绘图
    global i
    i=i+1
    x = np.arange(0,2,0.1)
    xx1.plot(x,i*x)

    canvas.draw()
root = tkinter.Tk()
root.wm_title("Embedding in Tk")

fig = Figure(figsize=(5, 4), dpi=100)
t = np.arange(0, 3, .01)
xx1= fig.add_subplot()
xx1.plot(t, 2 * np.sin(2 * np.pi * t))

canvas = FigureCanvasTkAgg(fig, master=root)  # A tk.DrawingArea.
canvas.draw()

button = tkinter.Button(master=root, text="绘制", command=draw_line)
button.pack(side=tkinter.BOTTOM)
canvas.get_tk_widget().pack(side=tkinter.TOP, fill=tkinter.BOTH, expand=1)

tkinter.mainloop()
多次点击绘图,如下;


【推荐】国内首个AI IDE,深度理解中文开发场景,立即下载体验Trae
【推荐】编程新体验,更懂你的AI,立即体验豆包MarsCode编程助手
【推荐】抖音旗下AI助手豆包,你的智能百科全书,全免费不限次数
【推荐】轻量又高性能的 SSH 工具 IShell:AI 加持,快人一步
· SQL Server 2025 AI相关能力初探
· Linux系列:如何用 C#调用 C方法造成内存泄露
· AI与.NET技术实操系列(二):开始使用ML.NET
· 记一次.NET内存居高不下排查解决与启示
· 探究高空视频全景AR技术的实现原理
· 阿里最新开源QwQ-32B,效果媲美deepseek-r1满血版,部署成本又又又降低了!
· 单线程的Redis速度为什么快?
· SQL Server 2025 AI相关能力初探
· AI编程工具终极对决:字节Trae VS Cursor,谁才是开发者新宠?
· 展开说说关于C#中ORM框架的用法!