prometheus + grafana对 springboot 项目进行监控
1.prometheus接入springboot
prometheus安装后,在安装目录有一个默认的配置文件prometheus.yml
# my global config global: scrape_interval: 15s # Set the scrape interval to every 15 seconds. Default is every 1 minute. evaluation_interval: 15s # Evaluate rules every 15 seconds. The default is every 1 minute. # scrape_timeout is set to the global default (10s). # Alertmanager configuration alerting: alertmanagers: - static_configs: - targets: # - alertmanager:9093 # Load rules once and periodically evaluate them according to the global 'evaluation_interval'. rule_files: # - "first_rules.yml" # - "second_rules.yml" # A scrape configuration containing exactly one endpoint to scrape: # Here it's Prometheus itself. scrape_configs: # The job name is added as a label `job=<job_name>` to any timeseries scraped from this config. - job_name: "prometheus" # metrics_path defaults to '/metrics' # scheme defaults to 'http'. static_configs: - targets: ["localhost:9090"]
默认配置了一个job_name,监控prometheus本身。需要增加一个监控springboot项目
- job_name: "custom_spring_boot" metrics_path: '/actuator/prometheus' static_configs: - targets: ["localhost:9595"]
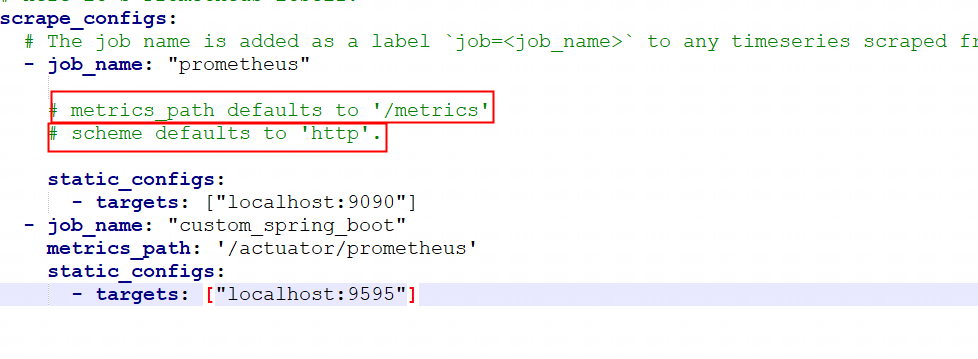
- metrics_path 默认采集metrics的路径是
/metrics;需要改成/actuator/prometheus - scheme 默认是http;如果是https需要自定义配置
- targets 获取metrics的地址和端口列表
2.访问prometheus
http://127.0.0.1:9090/
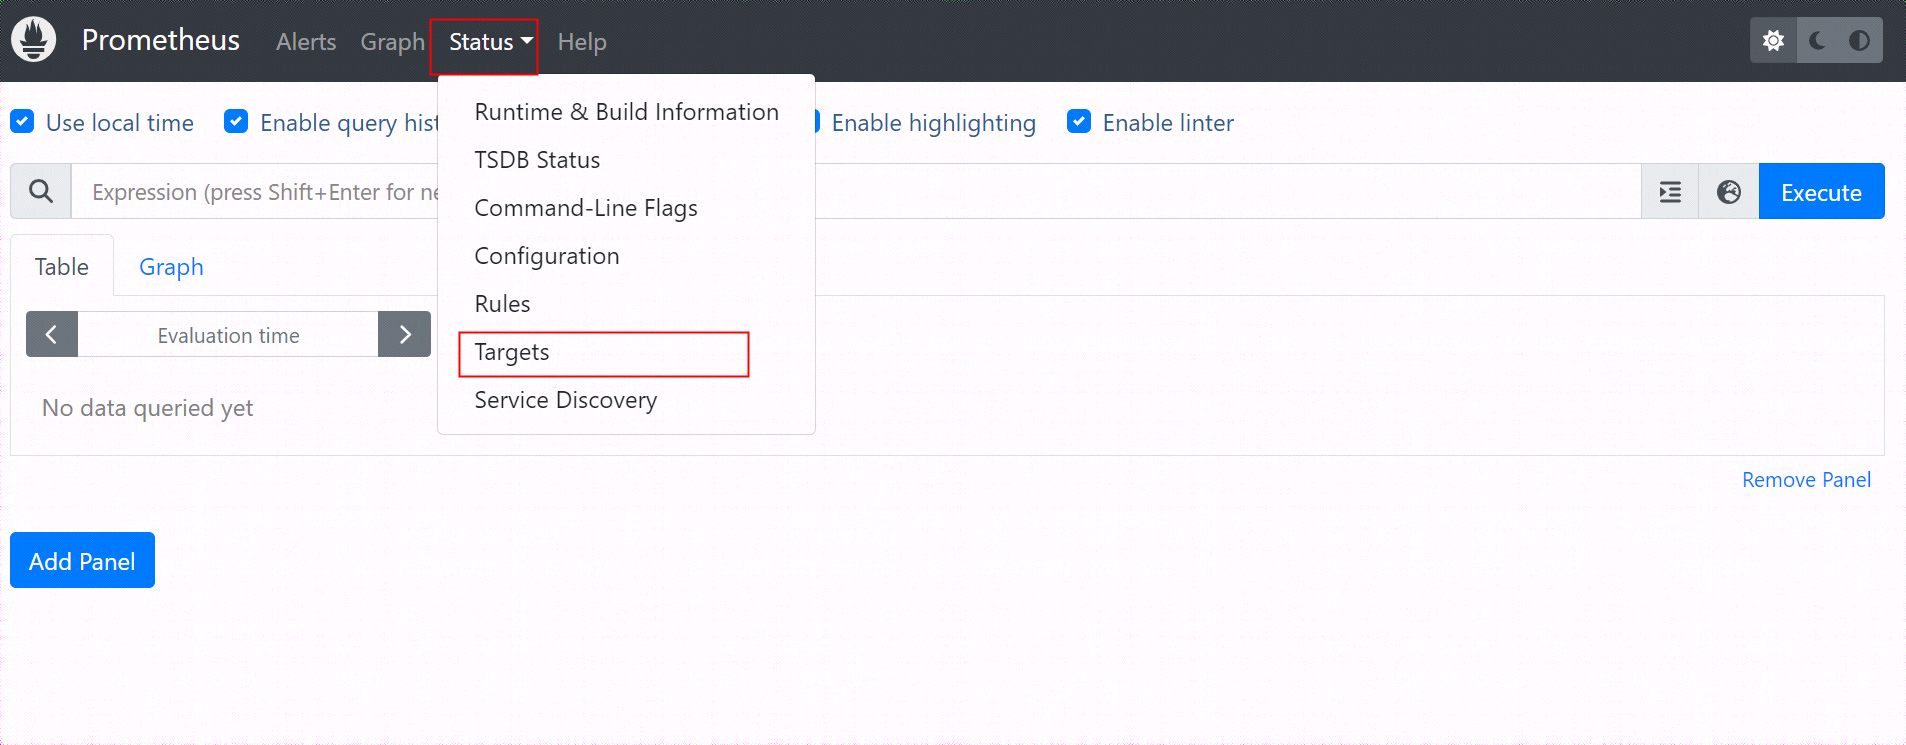
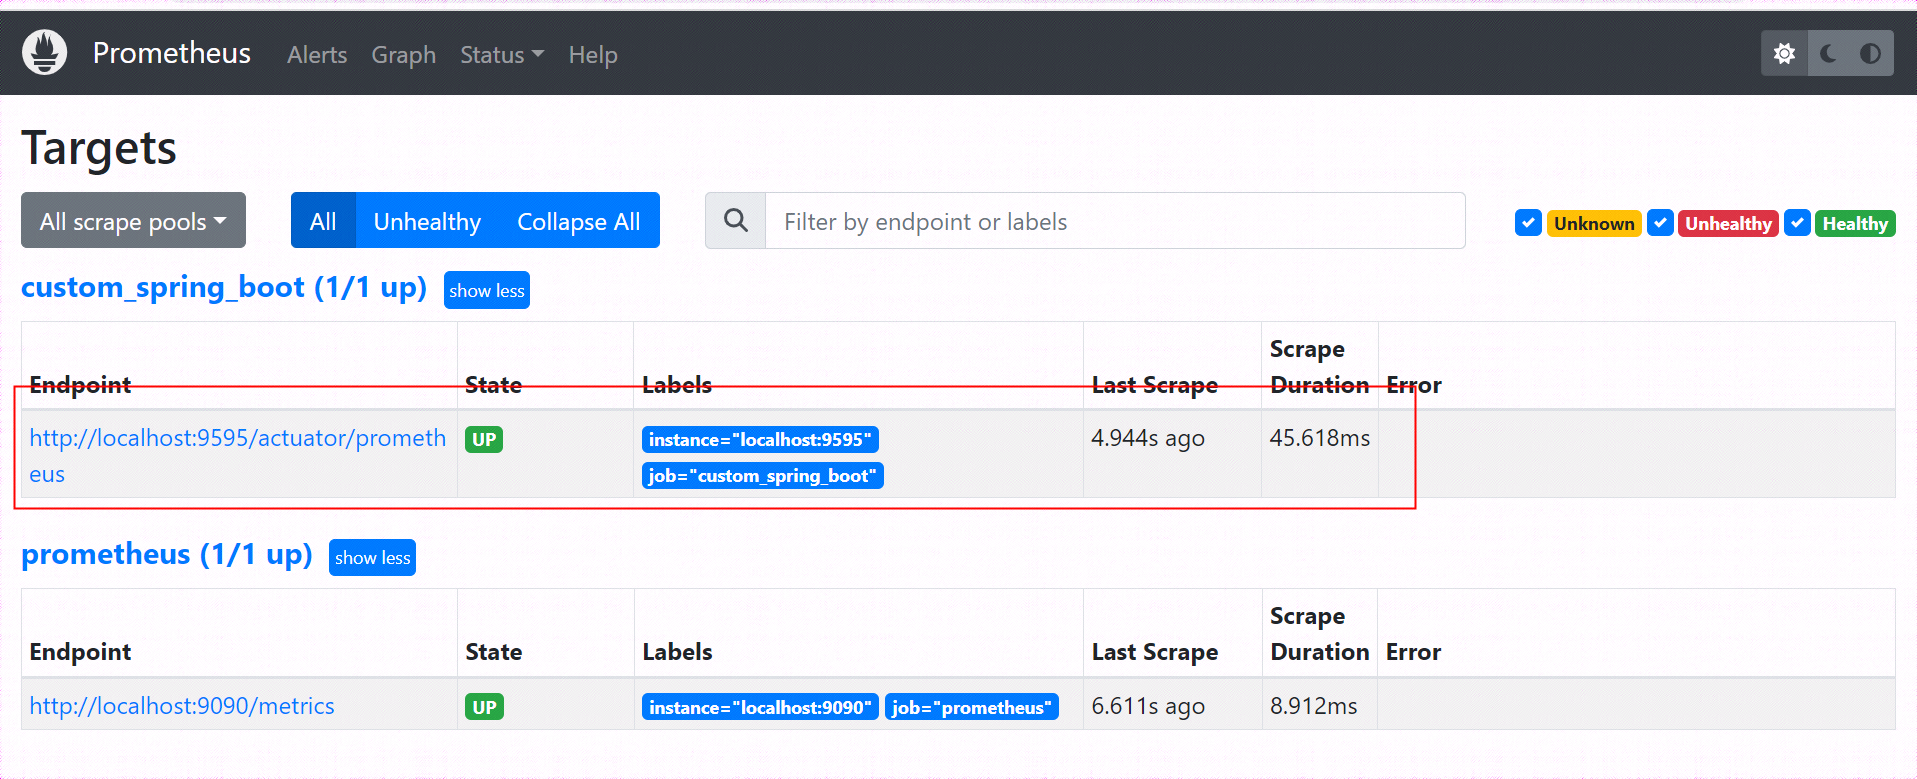
出现自定义需要监控的springboot端点列表
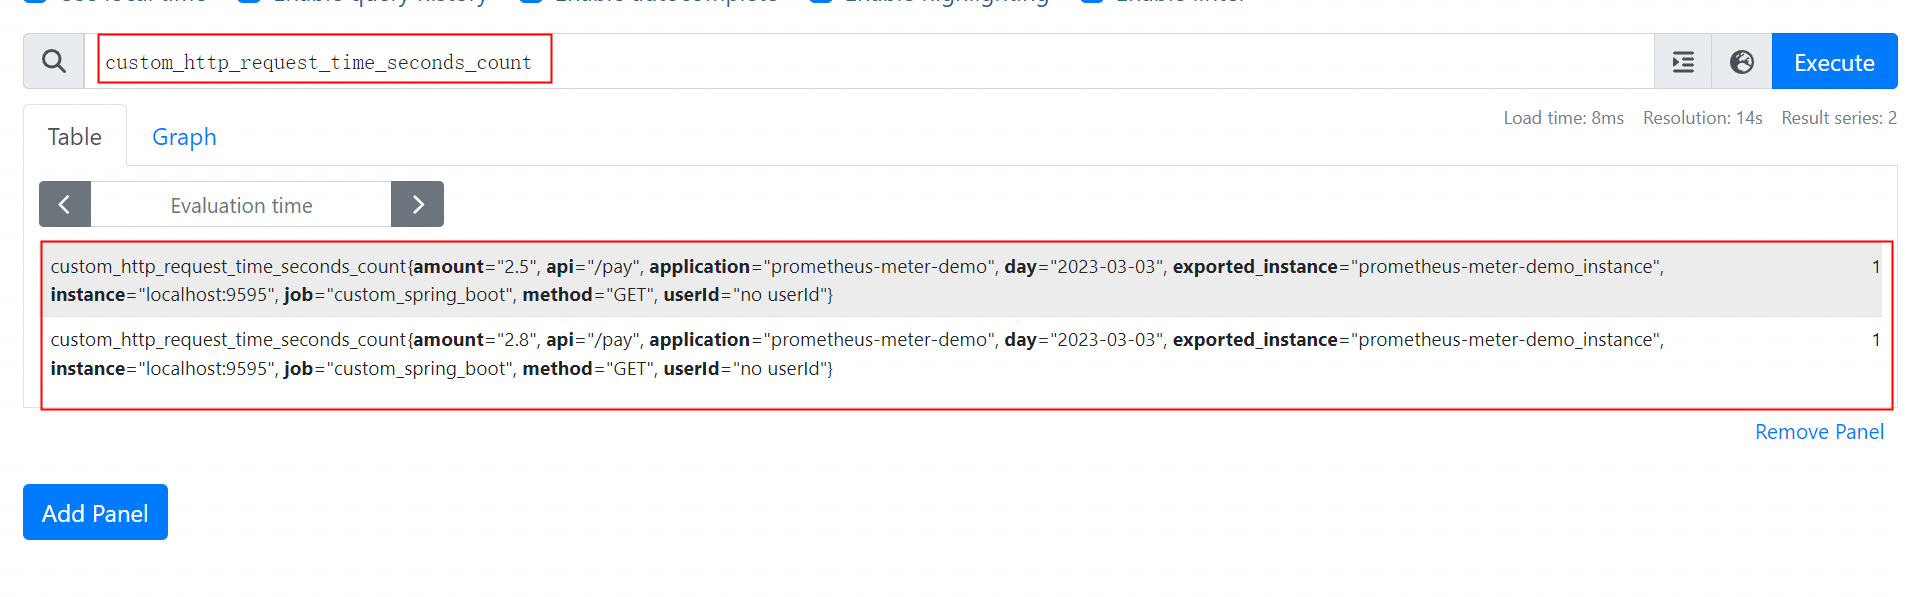
在首页,可以查询各种不同的指标
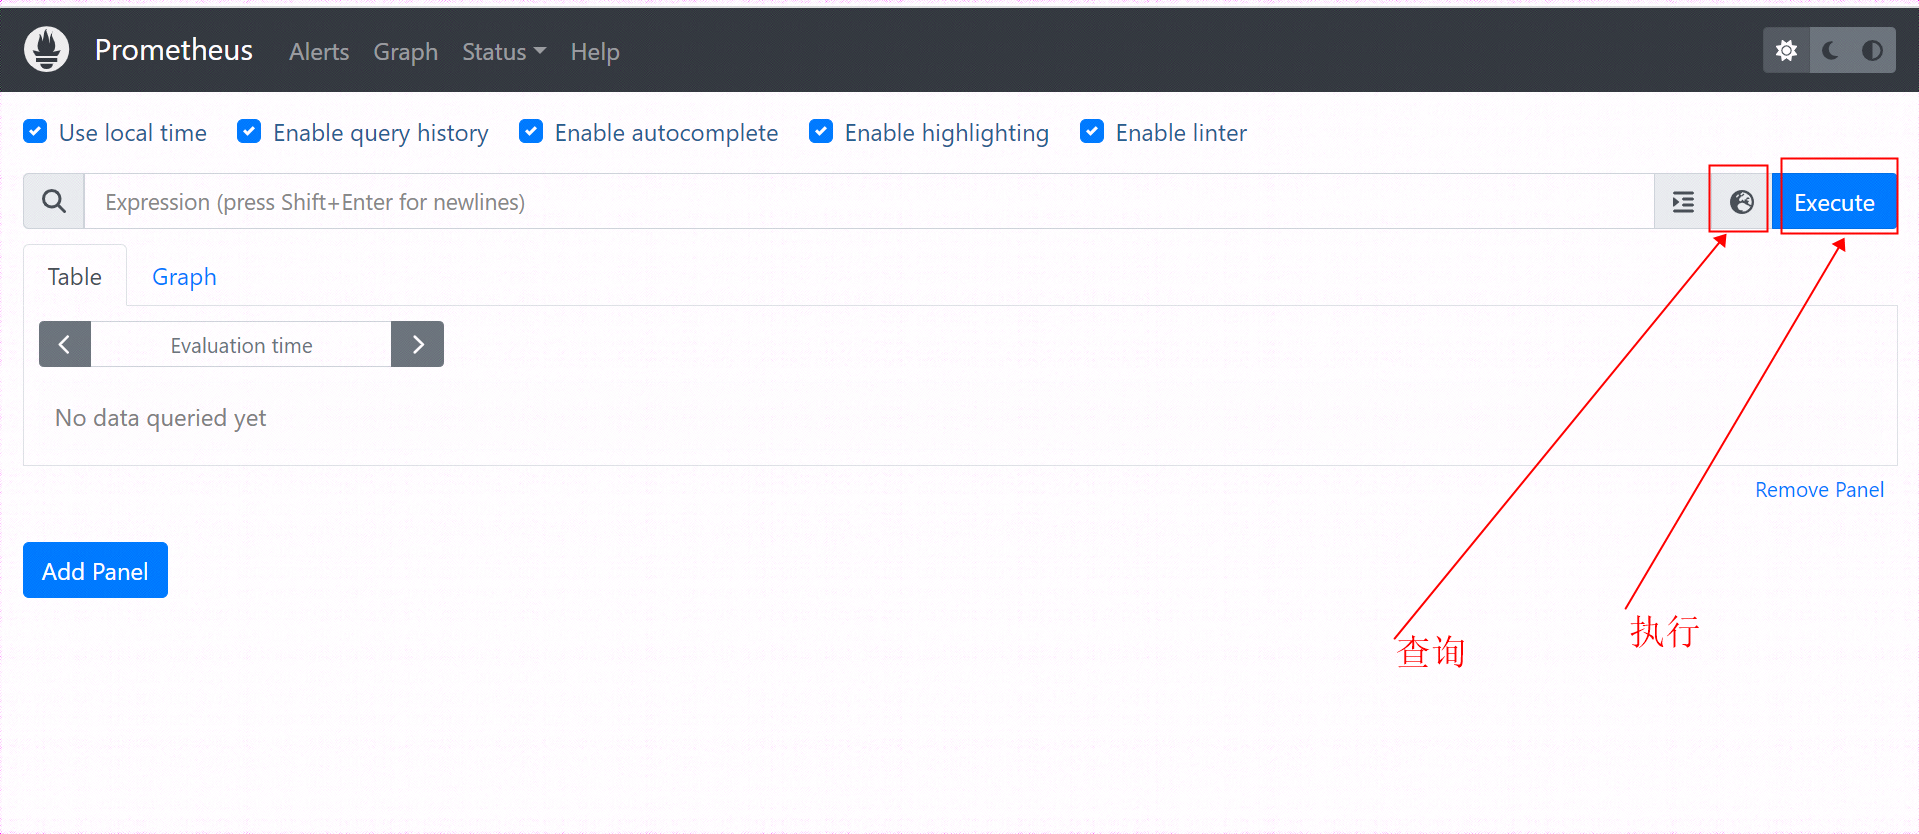
比如查询custom_http_request_time_seconds_count指标
3.grafana接入prometheus
访问
http://127.0.0.1:3000/
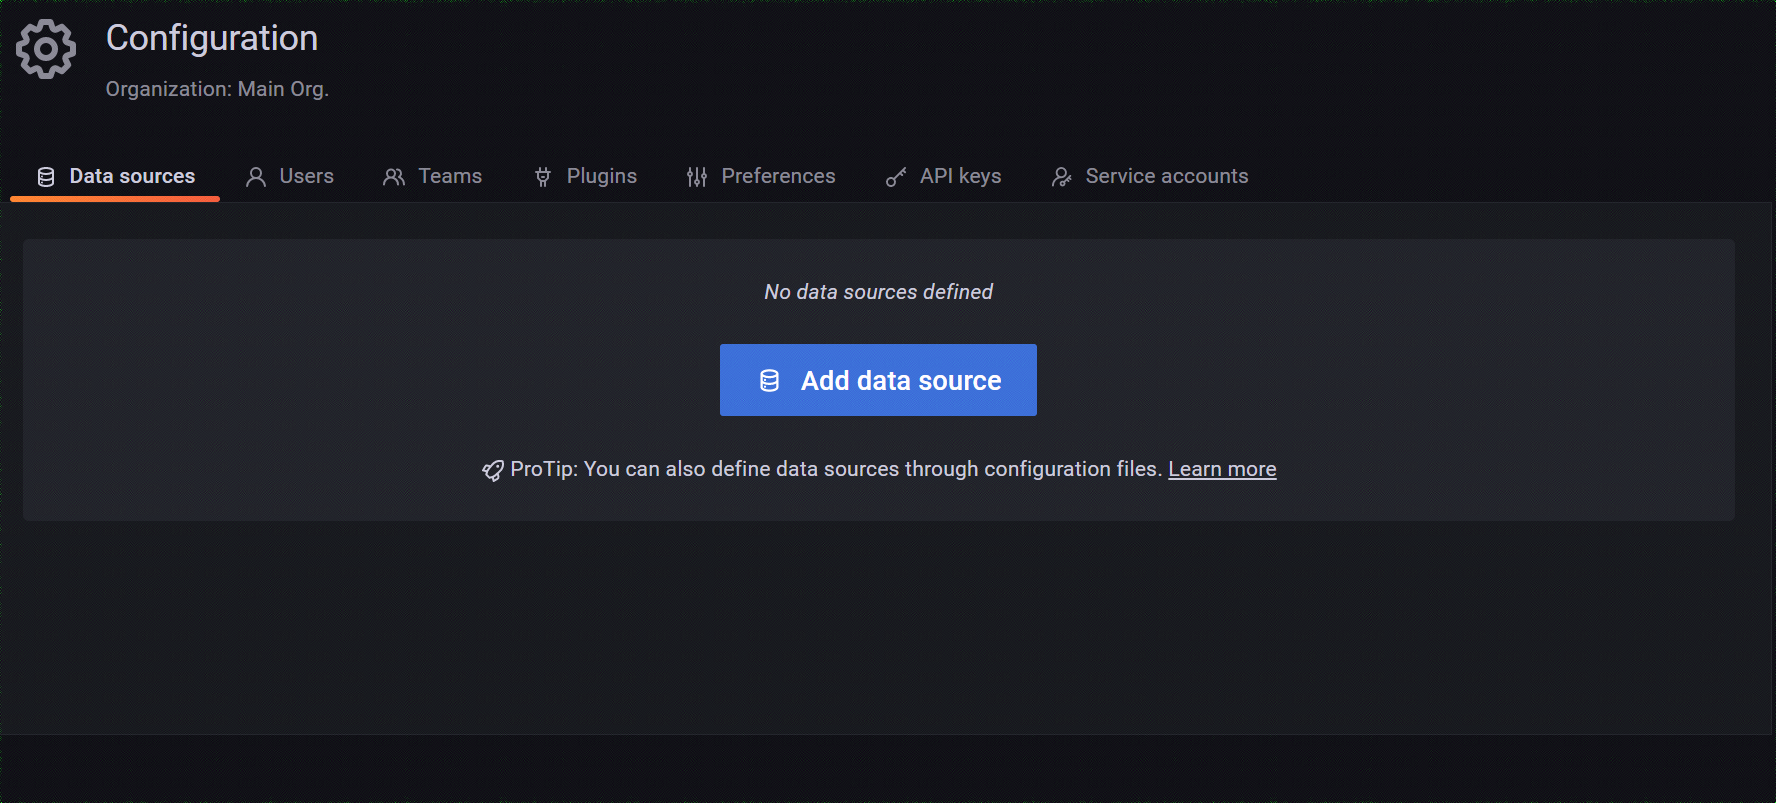
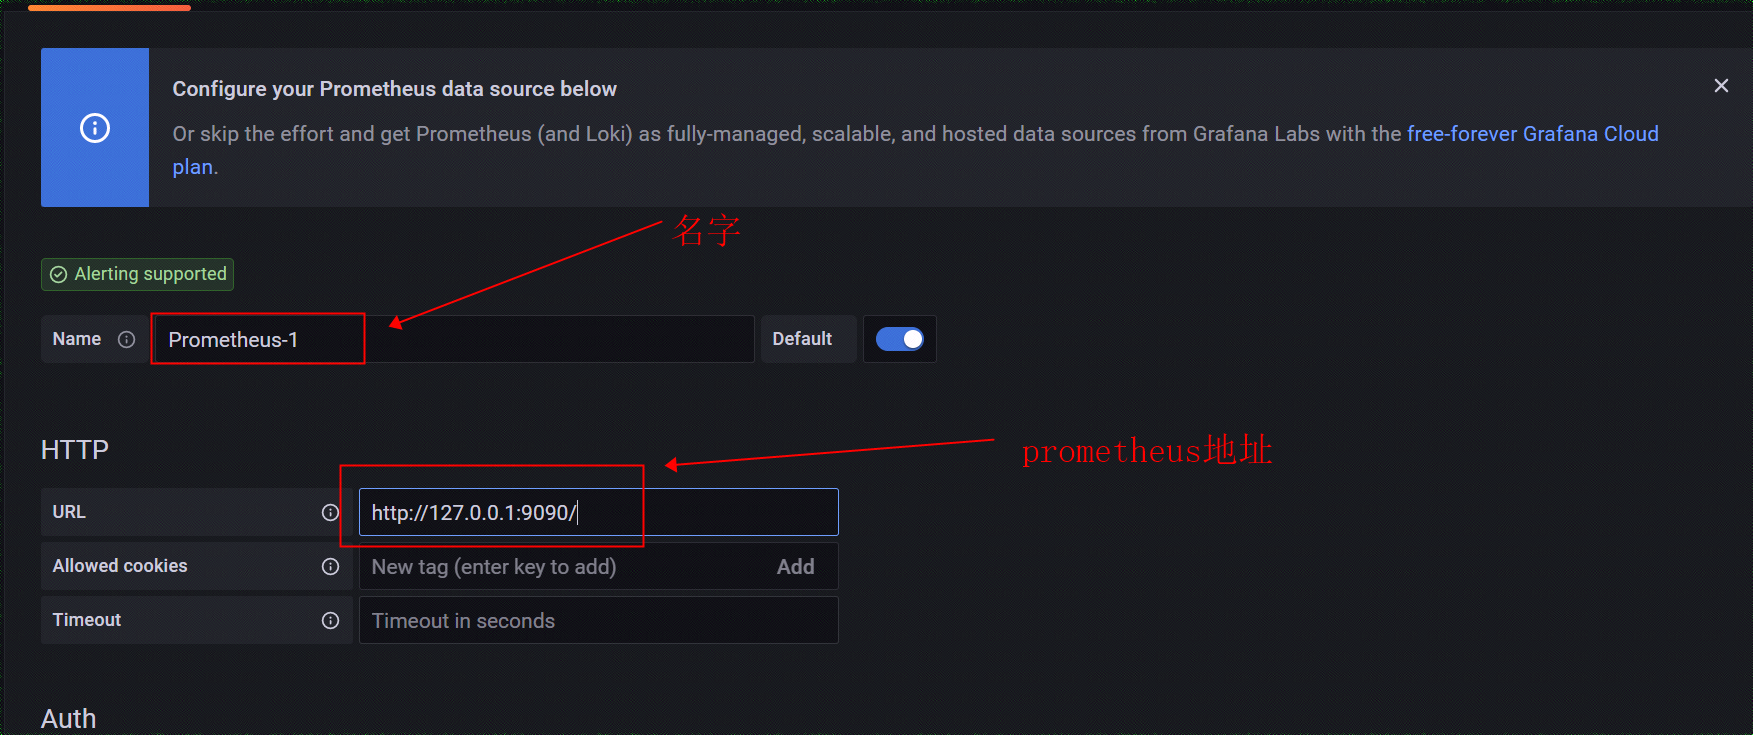
配置数据源
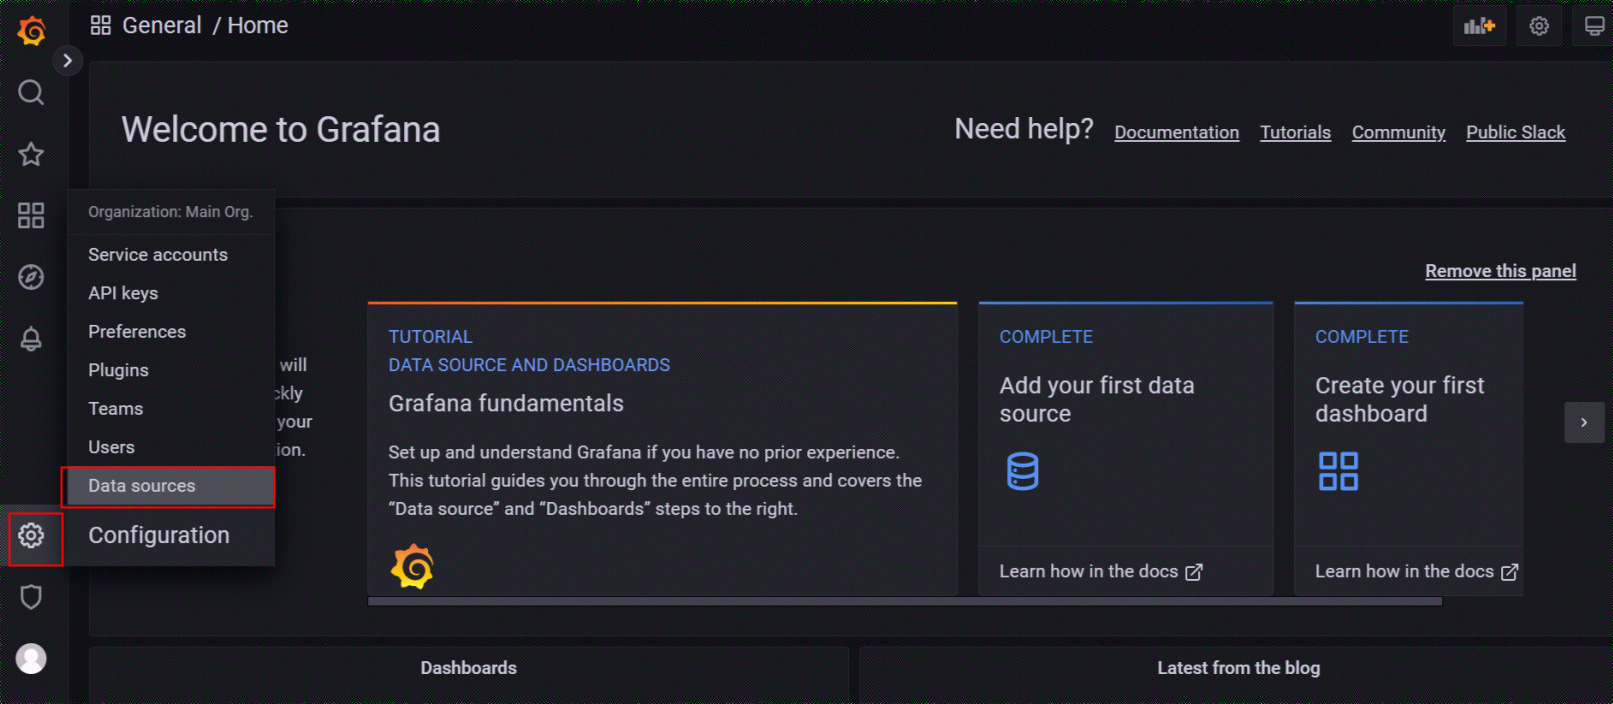
添加一个数据
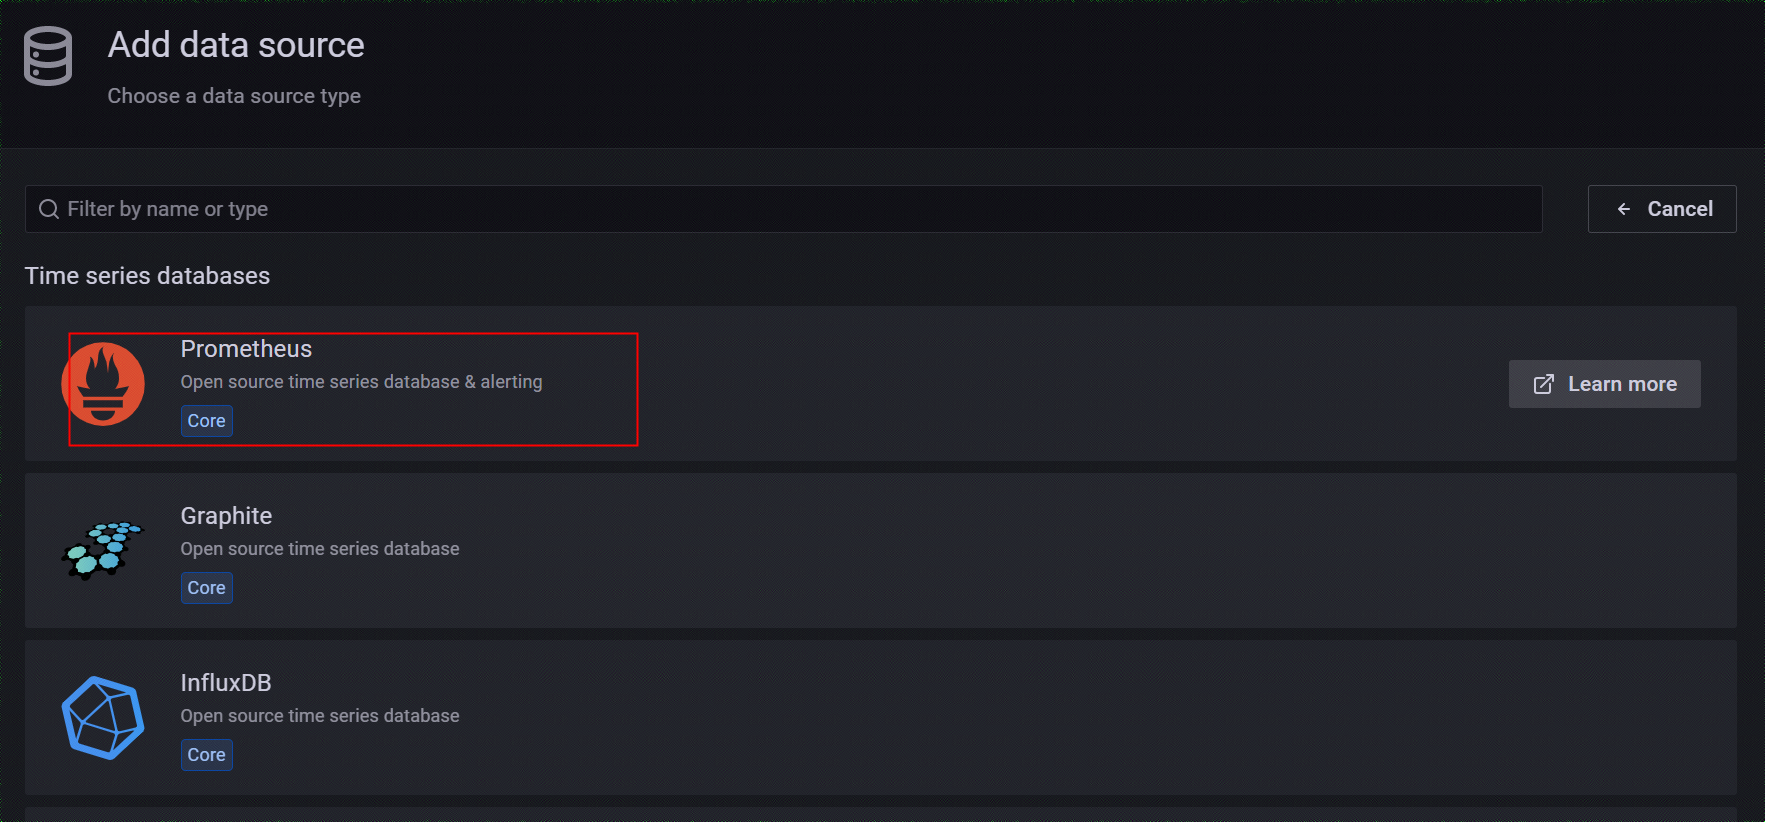
选择prometheus
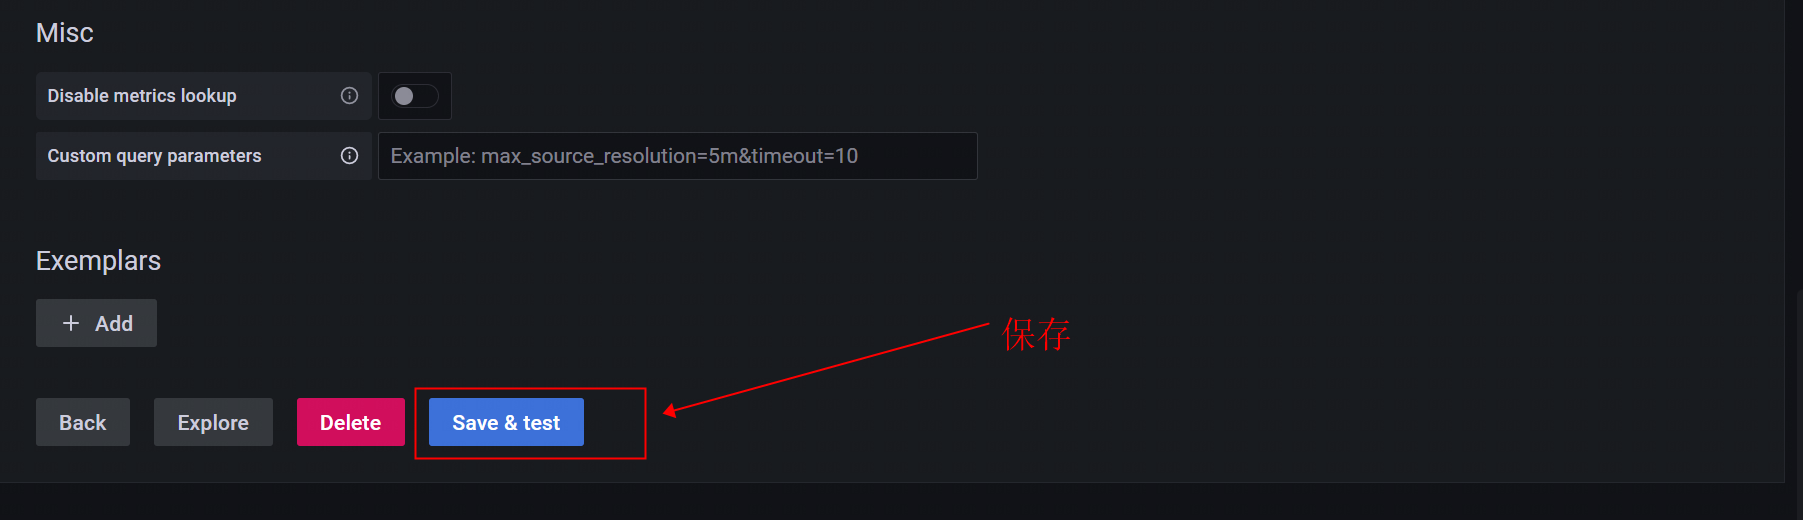
设置名称和prometheus服务地址
4.配置仪表盘
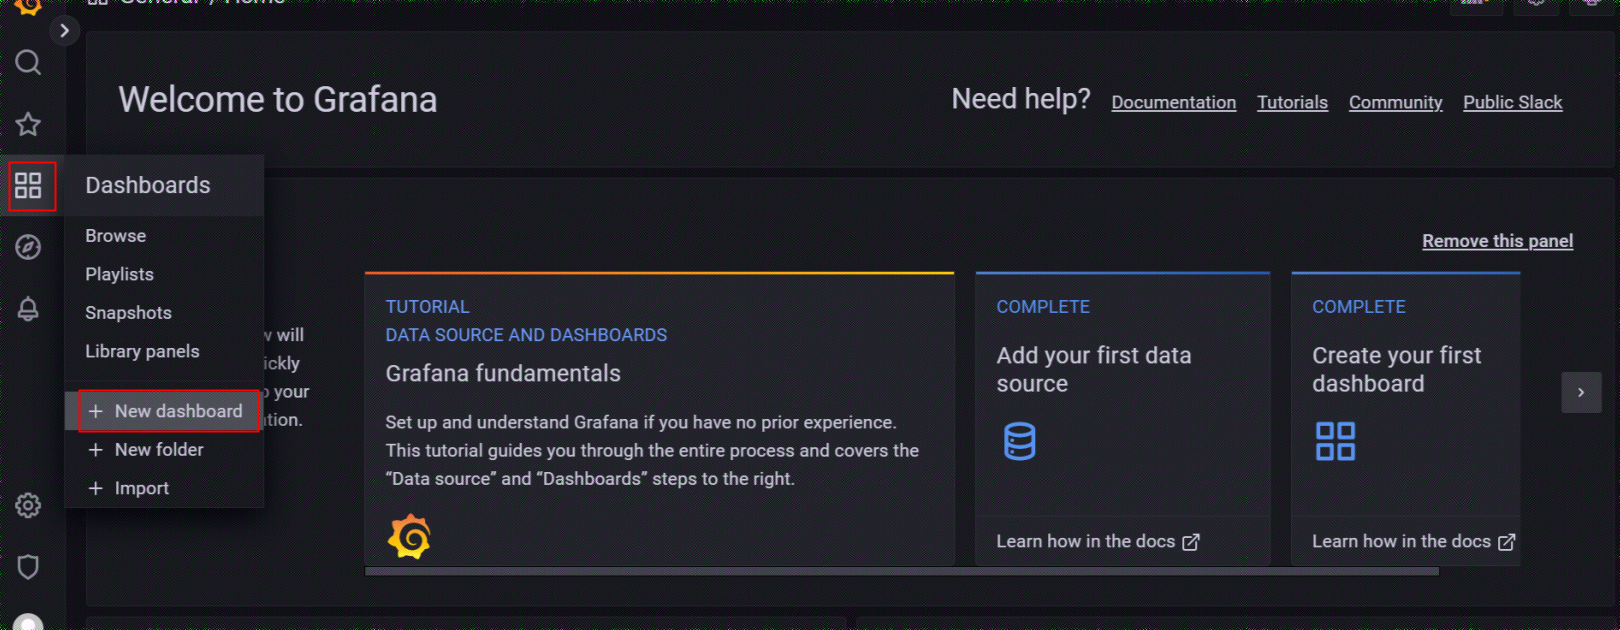
点击Add a new panel;新建一个Panel
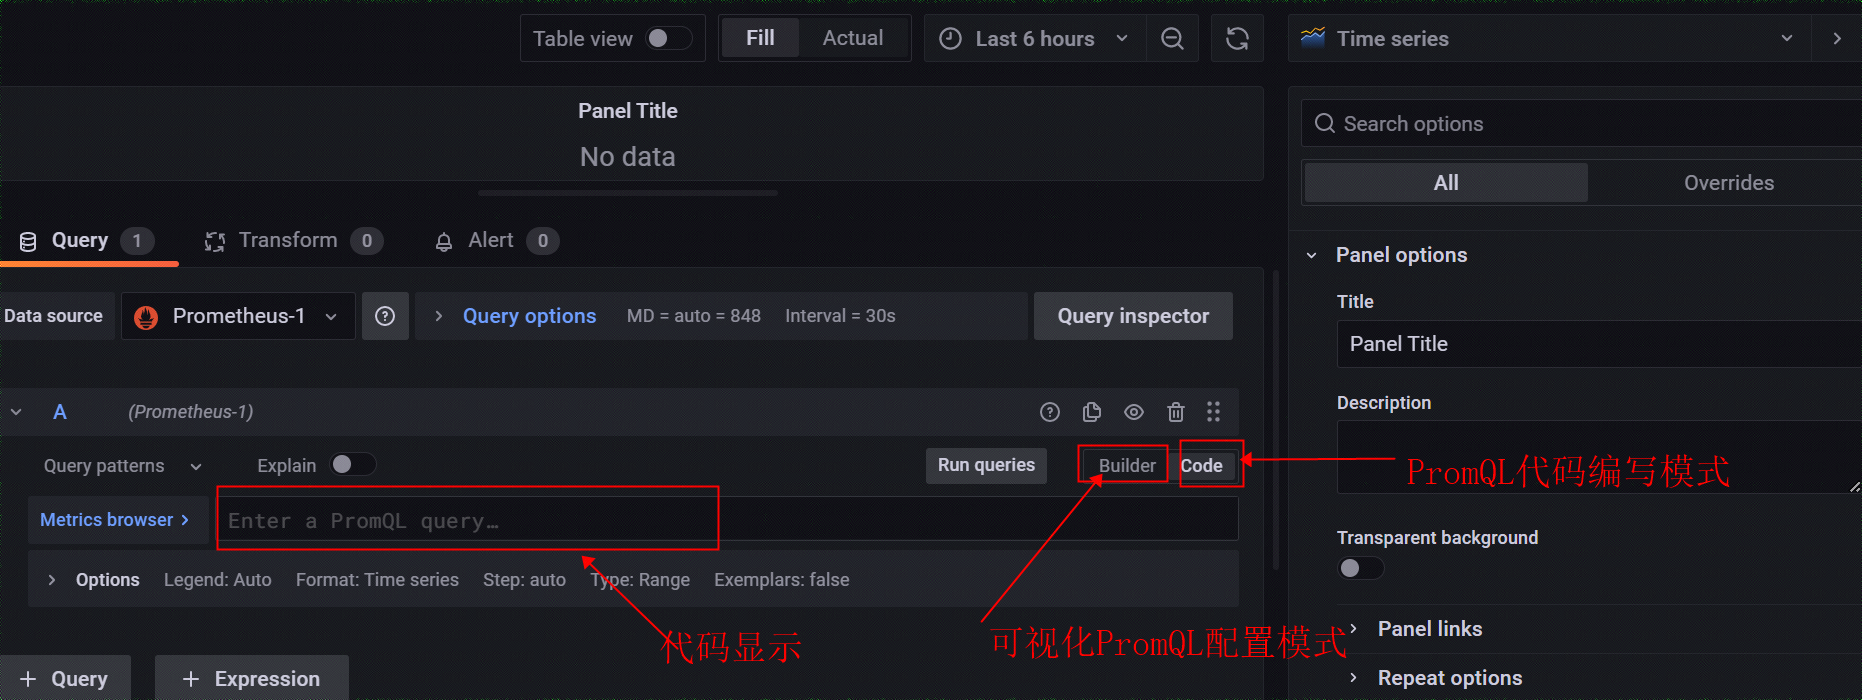
平均时间查询
sum by(api) (rate(custom_http_request_time_seconds_count{job="custom_spring_boot", api="/order"}[5m]))
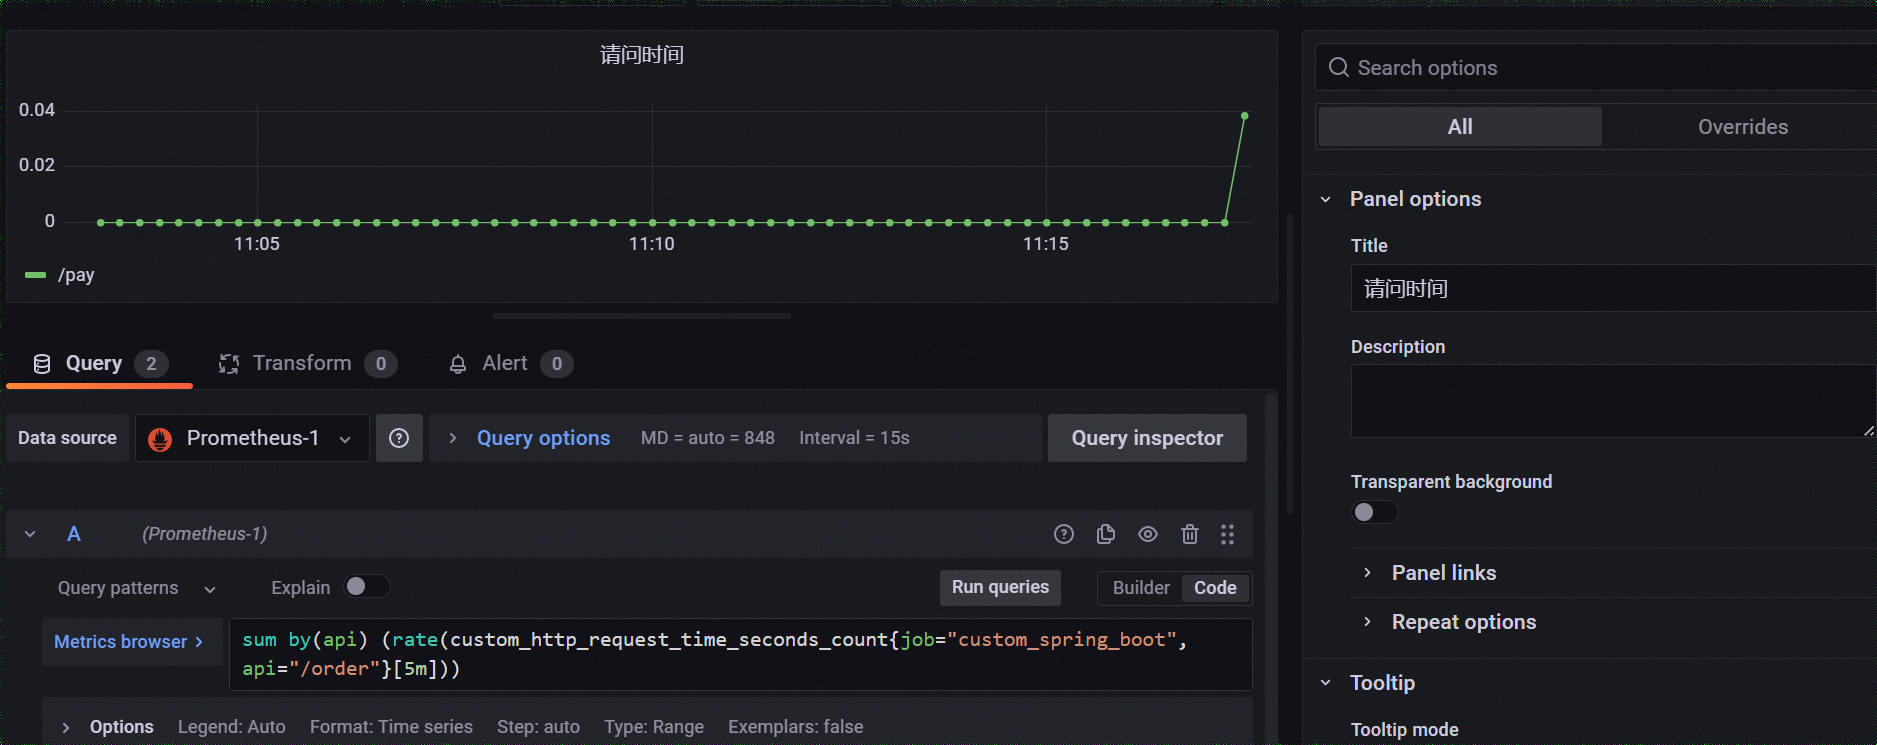
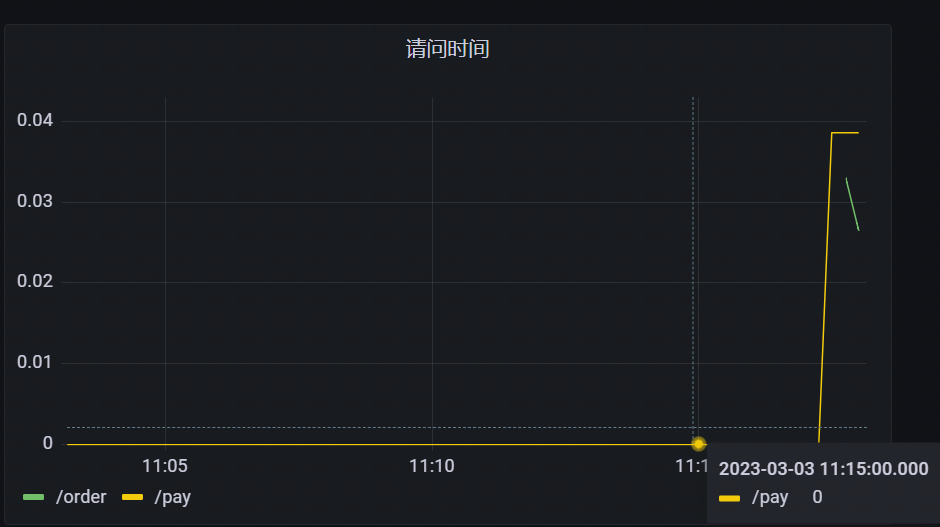
保存,最终显示


【推荐】编程新体验,更懂你的AI,立即体验豆包MarsCode编程助手
【推荐】凌霞软件回馈社区,博客园 & 1Panel & Halo 联合会员上线
【推荐】抖音旗下AI助手豆包,你的智能百科全书,全免费不限次数
【推荐】博客园社区专享云产品让利特惠,阿里云新客6.5折上折
【推荐】轻量又高性能的 SSH 工具 IShell:AI 加持,快人一步
· DeepSeek “源神”启动!「GitHub 热点速览」
· 微软正式发布.NET 10 Preview 1:开启下一代开发框架新篇章
· C# 集成 DeepSeek 模型实现 AI 私有化(本地部署与 API 调用教程)
· DeepSeek R1 简明指南:架构、训练、本地部署及硬件要求
· 2 本地部署DeepSeek模型构建本地知识库+联网搜索详细步骤