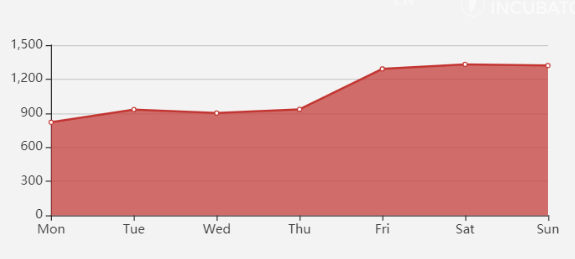
echart series areaStyle 颜色不显示
官方给的案例中,颜色都能正常显示:
https://echarts.apache.org/examples/zh/editor.html?c=area-basic

可我做了一些尝试都不能显示颜色!
// const option = {
//   xAxis: {
//     type: "category",
//     data: ["Mon", "Tue", "Wed", "Thu", "Fri", "Sat", "Sun"]
//   },
//   yAxis: {},
//   series: [{
//     type: "line",
//     smooth:true,
//     areaStyle: {}
//     areaStyle:{
//         color:"red"
//     },
//     // areaStyle:{
//     //                 color: {
//     //                     type: 'linear',
//     //                     x: 0,
//     //                     y: 0,
//     //                     x2: 0,
//     //                     y2: 1,
//     //                     colorStops: [{
//     //                         offset: 0, color: 'red' // 0% 处的颜色
//     //                     }, {
//     //                         offset: 1, color: 'white' // 100% 处的颜色
//     //                     }],
//     //                     global: false // 缺省为 false
//     //                 }
//     //             } ,
// areaStyle: {
// color: new echarts.graphic.LinearGradient(0, 0, 0, 1, [{
// offset: 0,
// color: 'rgb(255, 158, 68)'
// }, {
// offset: 1,
// color: 'rgb(255, 70, 131)'
// }])
// },
//       data: [820, 932, 901, 934, 1290, 1330, 1320],
//   }]
// }
会不会是版本问题?
package.json 查看版本为 "echarts": "^3.8.5",
改为 "echarts": "^4.0.0",操作如下:
npm install echarts@4.0.0
好了,颜色显示出来了!
注意改成版本5.0.0 颜色也显示不出来。
树立目标,保持活力,gogogo!


 浙公网安备 33010602011771号