

iview 表头table 悬浮提示tooltip ;iview 单元格悬浮提示 ;iview table header cell tooltip;
一、批量悬浮提示
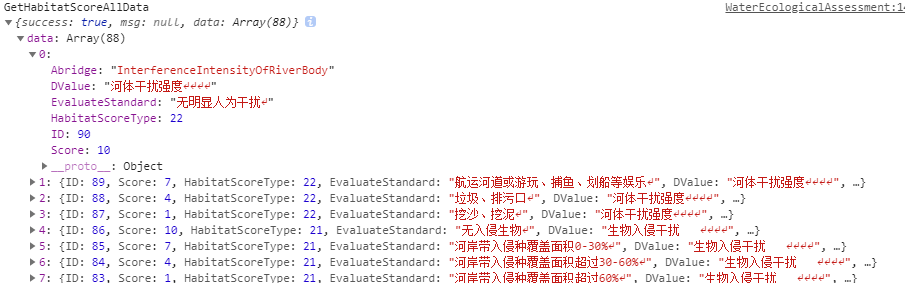
二、提示数据举例
三、核心方法:
1 2 3 4 5 6 7 8 9 10 11 12 13 14 15 16 17 18 19 20 21 22 23 24 25 26 27 28 29 30 31 32 33 34 35 36 37 38 39 40 41 42 43 44 45 46 47 48 49 50 51 52 53 54 55 56 57 58 59 60 61 62 63 64 65 66 67 68 69 70 | //单元格提示 function renderCell(h, params) { //console.log('h', h) //console.log('params', params) var tipsContent = getTips(params.column.key, params.row[params.column.key]) //console.log('tipsContent', tipsContent) var values = formatTwoDecimalPlaces(params.row[params.column.key]) return h('tooltip', { props: { placement: 'top' } }, [ values,//原始数据 h('div', { slot: 'content', style: { whiteSpace: 'normal', wordBreak: 'break-all' } }, tipsContent //提示语句 ) ] ) } //表头提示 function renderHeader1(h, params) { // console.log('h', h) // console.log('params', params) return h('tooltip', { props: { transfer: true, placement: 'bottom-end'//下右 } }, [ //h('span', '优势度'), h('span', params.column.title), h('div', { 'class': { 'custom-tooltip-content': true }, slot: 'content' }, [ h('p', '物种所占优势程度,由物种密度和采样点出现的频次计算所得。') ] ) ] ) }//简单使用举例 { title: '优势度', key: 'DominanceDegree1', minWidth: 60, align: "center", render: renderCell renderHeader: renderHeader1, }, |
1 | renderHeader1方法 加以改造也可以成为批量标题提示方法。 |
四、完整代码
1 2 3 4 5 6 7 8 9 10 11 12 13 14 15 16 17 18 19 20 21 22 23 24 25 26 27 28 29 30 31 32 33 34 35 36 37 38 39 40 41 42 43 44 45 46 47 48 49 50 51 52 53 54 55 56 57 58 59 60 61 62 63 64 65 66 67 68 69 70 71 72 73 74 75 76 77 78 79 80 81 82 83 84 85 86 87 88 89 90 91 92 93 94 95 96 97 98 99 100 101 102 103 104 105 106 107 108 109 110 111 112 113 114 115 116 117 118 119 120 121 122 123 124 125 126 127 128 129 130 131 132 133 134 135 136 137 138 139 140 141 142 143 144 145 146 147 148 149 150 151 152 153 154 155 156 157 158 159 160 161 162 163 164 165 166 167 168 169 170 171 172 173 174 175 176 177 178 179 180 181 182 183 184 185 186 187 188 189 190 191 192 193 194 195 196 197 198 199 200 201 202 203 204 205 206 207 208 209 210 211 212 213 214 215 216 217 218 219 220 221 222 223 224 225 226 227 228 229 230 231 232 233 234 235 236 237 238 239 240 241 242 243 244 245 246 247 248 249 250 251 252 253 254 255 256 257 258 259 260 261 262 263 264 265 266 267 268 269 270 271 272 273 274 275 276 277 278 279 280 281 282 283 284 285 286 287 288 289 290 291 292 293 294 295 296 297 298 299 300 301 302 303 304 305 306 307 308 309 310 311 312 313 314 315 316 317 318 319 320 321 322 323 324 325 326 327 328 329 330 331 332 333 334 335 336 337 338 339 340 341 342 343 344 345 346 347 348 349 350 351 352 353 354 355 356 357 358 359 360 361 362 363 364 365 366 367 368 369 370 371 372 373 374 375 376 377 378 379 380 381 382 383 384 385 386 387 388 389 390 391 392 393 394 395 396 397 398 399 400 401 402 403 404 405 406 407 408 409 410 411 412 413 414 415 416 417 418 419 420 421 422 423 424 425 426 427 428 429 430 431 432 433 434 435 436 437 438 439 440 441 442 443 444 445 446 447 448 449 450 451 452 453 454 455 456 457 458 459 460 461 462 463 464 465 466 467 468 469 470 471 472 473 474 475 476 477 478 479 480 481 482 483 484 485 486 487 488 489 490 491 492 493 494 495 496 497 498 499 500 501 502 503 504 505 506 507 508 509 510 511 512 513 514 515 516 517 518 519 520 521 522 523 524 525 526 527 528 529 530 531 532 533 534 535 536 537 538 539 540 541 542 543 544 545 546 547 548 549 550 551 552 553 554 555 556 557 558 559 560 561 562 563 564 565 566 567 568 569 570 571 572 573 574 575 576 577 578 579 580 581 582 583 584 585 586 587 588 589 590 591 592 593 594 595 596 597 598 599 600 601 602 603 604 605 606 607 608 609 610 611 612 613 614 615 616 617 618 619 620 621 622 623 624 625 626 627 628 629 630 631 632 633 634 635 636 637 638 639 640 641 642 643 644 645 646 647 648 649 650 651 652 653 654 655 656 657 658 659 660 661 662 663 664 665 666 667 668 669 670 671 672 673 674 675 676 677 678 679 680 681 682 683 684 685 686 687 688 689 690 691 692 693 694 695 696 697 698 699 700 701 702 703 704 705 706 707 708 709 710 711 712 713 714 715 716 717 718 719 720 721 722 723 724 725 726 727 728 729 730 731 732 733 734 735 736 737 738 739 740 741 742 743 744 745 746 747 748 749 750 751 752 753 754 755 756 757 758 759 760 761 762 763 764 765 766 767 768 769 770 771 772 773 774 775 776 777 778 779 780 781 782 783 784 785 786 787 788 789 790 791 792 793 794 795 796 797 798 799 800 801 802 803 804 805 806 807 808 809 810 811 812 813 814 815 816 817 818 819 820 821 822 823 824 825 826 827 828 829 830 831 832 833 834 835 836 837 838 839 840 841 842 843 844 845 846 847 848 849 850 851 852 853 854 855 856 857 858 859 860 861 862 863 864 865 866 867 868 869 870 871 872 873 874 875 876 877 878 879 880 881 882 883 884 885 886 887 888 889 890 891 892 893 894 895 896 897 898 899 900 901 902 903 904 905 906 907 908 909 910 911 912 913 914 915 916 917 918 919 920 921 922 923 924 925 926 927 928 929 930 931 932 933 934 935 936 937 938 939 940 941 942 943 944 945 946 947 948 949 950 951 952 953 954 955 956 957 958 959 960 961 962 963 964 965 966 967 968 969 970 971 972 973 974 975 976 977 978 979 980 981 982 983 984 985 986 987 988 989 990 991 992 993 994 995 996 997 998 999 1000 1001 1002 1003 1004 1005 1006 1007 1008 1009 1010 1011 1012 1013 1014 1015 1016 1017 1018 1019 1020 1021 1022 1023 1024 1025 | @{ ViewBag.Title = ""; Layout = "~/Views/Shared/_LayoutNotFooter.cshtml";}<style type="text/css"> .table-header-titleThree { color: #333; font-style: normal; font-weight: bolder; font-family: "Helvetica Neue", Helvetica, "PingFang SC", "Hiragino Sans GB", "Microsoft YaHei", "微软雅黑", Arial, sans-serif; font-size: 20px; text-align: center; vertical-align: auto; line-height: 1.5; width: auto; height: auto; margin-bottom: 0px; } /*custom-tooltip 宽度*/ .ivu-tooltip-inner { max-width: 600px; } .custom-tooltip-content { white-space: normal; width: 500px; } .custom-tooltip-content p { text-indent: 2em; font-size: 14px; text-align: justify; } /*调整table cell间隔和行高*/ .ivu-table-cell { padding-left: 1px; padding-right: 1px; } .ivu-table-small td { height: 36px; } /*echarts 数据视图 单位样式*/ .echart-table-uint{ font-size: 12px; color: #515a6e; float: right; line-height: 23px; padding: 4px 0px; } /*echarts 数据视图 表格样式*/ .echart-table{ width: 100%; text-align: center; border: 1px solid #dddddd; border-collapse: collapse; border-spacing: 0; font-family: "Helvetica Neue",Helvetica,"PingFang SC","Hiragino Sans GB","Microsoft YaHei","微软雅黑",Arial,sans-serif; font-size: 12px; color: #515a6e; } .echart-table tr td{ padding: 4px 0; border: 1px solid #dddddd; line-height: 23px; } .echart-table tr:nth-child(odd) td{ background-color: #FAFAFA; }</style><script type="text/x-template" id="viewTemplate"> <div style="margin:20px 10px 10px 10px"> <Row> <i-Col span="24"> <i-form ref="queryForm" label-position="left" label-width="70px" inline size="small"> <form-item label> <i-select v-model="listQuery.sampleBatch" filterable placeholder="请选择批次" style="width:150px;"> <i-option v-for="item in sampleBatchArr" v-bind:key="item.value" v-bind:label="item.text" v-bind:value="item.value" /> </i-select> </form-item> <form-item label=""> <i-select v-model="listQuery.riverOrReservoirID" clearable filterable placeholder="请选择水域名称" style="width:150px;"> <i-option v-for="item in waterList" v-bind:key="item.id" v-bind:label="item.name" v-bind:value="item.id" /> </i-select> </form-item> </i-form> </i-Col> </Row> <Row> <i-Col span="24"> <header> <div class="table-header-titleThree"> <span v-if="listQuery.riverOrReservoirID!=null">{{ getNameByID(listQuery.riverOrReservoirID,waterList)}}</span><span v-else>深圳市</span>水生态健康综合评价 </div> </header> </i-Col> </Row> <Row> <i-Col span="16"> <div id="barID" style="width:100%;height:500px" /> </i-Col> <i-Col span="8"> <div id="pieID" style="width:100%;height:500px" /> </i-Col> </Row> <br /> <Row> <i-Col span="24"> <header> <div class="table-header-titleThree"> <span v-if="listQuery.riverOrReservoirID!=null">{{ getNameByID(listQuery.riverOrReservoirID,waterList)}}</span><span v-else>深圳市</span>水生态健康评价分项指标表 </div> </header> </i-Col> </Row> <br /> <Row> <i-table v-bind:columns="tableColumns" v-bind:data="list" size="small" v-bind:loading="listLoading" v-bind:showPage="false" border></i-table> </Row> <br /> <Row> <i-Col span="24"> <header> <div class="table-header-titleThree"> <span v-if="listQuery.riverOrReservoirID!=null">{{ getNameByID(listQuery.riverOrReservoirID,waterList)}}</span><span v-else>深圳市</span>水生态健康评价分项指标箱型图 </div> </header> </i-Col> </Row> <Row> <i-Col span="24"> <div id="BoxplotID" style="width:100%;height:600px" /> </i-Col> </Row> <br /> </div> </script> <div id="app"> </div> <script type="text/javascript"> var nameList = ['VelocityOrDepthCombinationCharacteristics', 'WaterQuantityConditions', 'BottomQuality', 'DegreeRiverBend', 'ChangeRiverBend', 'StabilityOfRiverOrLakeBank', 'HabitatComplexity', 'WidthOfRiparianBufferZone', 'HabitatTypeOfRiparianBufferZone', 'VegetationDiversityOfRiparianZone', 'RiparianZoneUseType', 'DissolvedOxygen', 'TotalNitrogen', 'NH3N', 'TP', 'AlgaShannonWiener', 'AlgaBergerParker', 'ZoobenthosShannonWeiner', 'EPT', 'OligochaetaPercent', 'BiologicalInvasion', 'InterferenceIntensityOfRiverBody'] var chineseNameList = ['流速/水深结合特性', '水量状况', '底质', '河道弯曲程度', '河道改变程度', '河岸稳定性', '栖境复杂性', '河岸带缓冲区宽度', '河岸带缓冲区生境类型', '河岸带植被多样性', '河岸带土壤利用类型', '溶解氧(mg/L)', '总氮(mg/L)', 'NH3-N(mg/L)', 'TP(mg/L)', '藻类生物多样性指数', '藻类优势度指数', '大型底栖动物生物多样性指数', 'EPT分类单元数', '寡毛类比例', '生物入侵干扰', '河体干扰强度'] var habitatScoreArr = []; function getTableColumns() { var arr = []; var obj0= { title: '名称', key: 'PointBatchIDLeftName', minWidth: 70, align: "center", } arr.push(obj0); for (let j = 0; j < nameList.length; j++) { let obj1 ={ title: chineseNameList[j], key: nameList[j], minWidth: chineseNameList[j].length*17, align: "center", render: renderCell //render: function (h, params) { // return formatTwoDecimalPlaces(params.row[nameList[j]]); //}, } arr.push(obj1); } /* , 'RiverSum', 'RiverGrade' ,'综合评分','等级' */ var obj2 = { title: '综合评分', key: 'RiverSum', minWidth: 70, align: "center", render: function (h, params) { return formatTwoDecimalPlaces(params.row.RiverSum); }, } var obj3 = { title: '等级', key: 'RiverGrade', minWidth: 60, align: "center", } arr.push(obj2); arr.push(obj3); //console.log('arr', arr) return arr; } var vm = new Vue({ template: "#viewTemplate", el: '#app', data: function () { return { tableHeight2:500, waterList: [], okloading: false, total: null, locationTypeArr: [{ text: '河流', value: 0 }, { text: '水库', value: 1 }], sampleBatchArr: [{ text: '2019年夏季', value: 1 }], list: [], tableKey: 0, listLoading: true, listQuery: { sampleBatch: 1, riverOrReservoirID: null, filters: [] }, filters: [], dictionaryArr: [], riverArr: [], reservoirArr: [], chart: null, chartBar: null, chartPie: null, chartindexBarID: null, tableHeight: '500px', riverName: null, tableColumns: [] } }, watch: { 'listQuery.algaDataType'(newVal, oldVal) { // ////console.log('newtypeId',newVal) this.listQuery.riverOrReservoirID = null // this.listQuery.page = 1 this.getData() }, 'listQuery.sampleBatch'(newVal, oldVal) { // ////console.log('newtypeId',newVal) // this.listQuery.page = 1 this.getData() }, 'listQuery.riverOrReservoirID'(newVal, oldVal) { // ////console.log('newtypeId',newVal) // this.listQuery.page = 1 this.getData() } }, created: function () { this.getHabitatScoreAllData(); this.tableColumns = getTableColumns(); this.getData(); this.getWaterNameList(); }, mounted: function () { this.$nextTick(() => { const that = this // //console.log('that',that); window.addEventListener('resize', function () { const chart = that.chart const chartBar = that.chartBar const chartPie = that.chartPie const chartindexBarID = that.chartindexBarID // console.log('chartBar', chartBar) if (chart) { chart.resize() } if (chartBar) { chartBar.resize() } if (chartPie) { chartPie.resize() } if (chartindexBarID) { chartindexBarID.resize() } }) }) }, methods: { getNameByID(id, array) { let name = null for (let index = 0; index < array.length; index++) { const element = array[index] if (element.id == id) { name = element.name } } return name }, getWaterNameList: function () { var that = this; var url = '@Url.Action("WaterNameList", "Evaluate")'; $.ajax({ url: url, data: { algaDataType:this.listQuery.algaDataType, sampleBatch: this.listQuery.sampleBatch }, type: "get", dataType: "json", success: function (result) { //console.log('WaterNameList', result) if (result != null && result.success > 0) { that.waterList = result.data; } } }) }, getHabitatScoreAllData:function() { var url = '@Url.Action("GetHabitatScoreAllData", "Evaluate")'; $.ajax({ url: url, // data: { algaDataType: this.listQuery.algaDataType, sampleBatch: this.listQuery.sampleBatch }, type: "get", dataType: "json", success: function (result) { console.log('GetHabitatScoreAllData', result) if (result != null && result.success > 0) { habitatScoreArr = result.data; } } }) }, getData: function () { var that = this; that.listLoading = true //const filters = [] //for (const i in that.filters) { // if (that.filters[i].value && that.filters[i].value.length > 0) { // filters.push({ 'field': that.filters[i].row, 'op': that.filters[i].op, 'value': that.filters[i].value }) // } //} //if (filters.length > 0) { // that.listQuery.filters = JSON.stringify(filters) //} else { // that.listQuery.filters = null //} //console.log('that.listQuery', that.listQuery) if (that.listQuery.riverOrReservoirID != null && that.listQuery.riverOrReservoirID != '') { var url = '@Url.Action("GetAllData", "Evaluate")'; $.ajax({ url: url, data: that.listQuery, type: "get", dataType: "json", success: function (result) { console.log('GetAllData', result); if (result != null && result.success > 0) { for (var i = 0; i < result.data.length; i++) { result.data[i].RiverGrade = translateRiverGrade(result.data[i].RiverSum); } //console.log("result.data", result.data); that.initBoxplot(result.data) that.initBar(result.data) that.initPie(result.data) that.list = result.data that.listLoading = false that.tableHeight = '400px' } }, error: function (result2) { console.log("GetList error", result2); } }) } // 柱状图 数据受 this.listQuery.riverOrReservoirID影响 if (that.listQuery.riverOrReservoirID == null || that.listQuery.riverOrReservoirID == '') { var url2 = '@Url.Action("GetAllAverageData", "Evaluate")'; $.ajax({ url: url2, data: that.listQuery, type: "get", dataType: "json", success: function (result) { console.log('GetAllAverageData', result); if (result != null && result.success > 0) { for (var i = 0; i < result.data.length; i++) { result.data[i].RiverGrade = translateRiverGrade(result.data[i].RiverSum); } that.initBoxplot(result.data) that.initBar(result.data) that.initPie(result.data) that.list = result.data //that.total = result.data that.listLoading = false that.tableHeight = '300px' } }, error: function (result2) { console.log("GetAllAverageData error", result2); } }) } }, initBar(dataPms) { const dataTemp = dataPms // console.log('initBar_dataPms', dataPms) if (this.chartBar) { this.chartBar.dispose() } const myChart = echarts.init(document.getElementById('barID')) if (dataTemp) { // var legendName=['重度干扰', '中度干扰', '轻度干扰', '轻微干扰', '无干扰'] var seriesData = [] var titlePart = '' var nameSum = '' var name = '' var xName = 'PointBatchIDLeftName' nameSum = 'RiverSum' titlePart = '河流' //if (this.listQuery.riverOrReservoirID == null || this.listQuery.riverOrReservoirID == '') { // xName = 'WaterName' //} else { // xName='PointName' //} var titleText = '' // if (this.listQuery.riverOrReservoirID != null) { // titlePart = this.getRiverArrNameByID(this.listQuery.riverOrReservoirID) // } // titleText = titlePart + '生境综合评价' // console.log('bar-seriesData',seriesData); // 指定图表的配置项和数据 const option = { title: { left: 'center', text: titleText }, tooltip: { trigger: 'axis' }, xAxis: { data: dataTemp.map(function(item) { return item[xName] }), axisLabel: { interval: 0, // 坐标轴刻度标签的显示间隔.设置成 0 强制显示所有标签。设置为 1,隔一个标签显示一个标签。 rotate: 45, // 倾斜度 -90 至 90 默认为0 textStyle: { fontWeight: 'bold', // 加粗 color: '#000000' // 黑色 } } }, yAxis: { splitLine: { show: false } }, toolbox: { right: '20px', // left: 'right', feature: { dataView: { show: true, title: '数据视图', lang: ['<div class="table-header-title" >' + titleText + '</div>', '关闭'], readOnly: true, // 点击刷新按钮会导致第二列数据消失,此处设置只读是为了隐藏刷新按钮。 optionToContent: function(opt) { // console.log('bar-opt', opt) return ToolboxDataView(opt) } }, saveAsImage: { show: true } } }, // dataZoom: [{ // startValue: '2014-06-01' // }, { // type: 'inside' // }], visualMap: { top: 30, // type:'piecewise', // splitNumber:6, // calculable:true, orient: 'horizontal', // 方向:水平 left: 'center', // itemWidth:10, // itemHeight:5, /* https://www.echartsjs.com/zh/option.html#visualMap-piecewise.pieces lt(小于,little than),gt(大于,greater than),lte(小于等于 lettle than or equals),gte(大于等于,greater than or equals)来表达边界: */ pieces: [ // { // gte: 0, // lt: 60, // label: '重度干扰', // color: '#7e0023' //}, { gt: 0, lte: 40, label: '极差', color: '#cc0033' }, { gt: 40, lte: 60, label: '差', color: '#ff9933' }, { gt: 60, lte: 80, label: '亚健康', color: '#ffde33' }, { gt: 80, lte: 100, label: '健康', color: '#096' }], outOfRange: { color: '#999' } }, series: { name: '得分', type: 'bar', data: dataTemp.map(function(item) { return formatTwoDecimalPlaces(item[nameSum]); }), markLine: { silent: true, data: [{ yAxis: 40 }, { yAxis: 60 }, { yAxis: 80 }, { yAxis: 100 }] } } } // console.log('bar-option',option) // 使用刚指定的配置项和数据显示图表。 myChart.setOption(option) this.chartBar = myChart } else { myChart.clear() } }, initBoxplot(dataPms) { //console.log('initBoxplot', dataPms) const dataTemp = dataPms if (this.chart) { this.chart.dispose() } const myChart = echarts.init(document.getElementById('BoxplotID')) if (dataTemp) { // 动态批量创建局部变量 var objData = {} for (let k = 0; k < nameList.length; k++) { objData[nameList[k]] = [] } for (let i = 0; i < dataTemp.length; i++) { for (let j = 0; j < nameList.length; j++) { objData[nameList[j]].push(dataTemp[i][nameList[j]]) } } // 对象赋值给数组 const dataAll = [] for (let k = 0; k < nameList.length; k++) { dataAll.push(objData[nameList[k]]) } // console.log('objData',objData) //console.log('dataAll',dataAll) // 指定图表的配置项和数据 var data = echarts.dataTool.prepareBoxplotData(dataAll) var titlePart = '' let nameSum = '' let nameGrade = '' nameSum = 'RiverSum' titlePart = '' nameGrade = 'RiverGrade' var titleText = '' // if (this.listQuery.riverOrReservoirID != null) { // titlePart = this.getRiverArrNameByID(this.listQuery.riverOrReservoirID) // } // titlePart + '生境评价分项指标箱型图' // console.log('data',data) var option = { // title: [ // { // text: titleText, // left: 'center' // } // ], toolbox: { right: '20px', // left: 'right', feature: { // dataView: { // show: true, // title: '数据视图', // lang:['<div class="table-header-title" >'+titleText+'</div>','关闭'], // readOnly: true, //点击刷新按钮会导致第二列数据消失,此处设置只读是为了隐藏刷新按钮。 // optionToContent: function (opt) { // //console.log('Boxplot-opt',opt) // return ToolboxDataView(opt); // } // }, saveAsImage: { show: true } } }, tooltip: { trigger: 'item', axisPointer: { type: 'shadow' } }, grid: { backgroundColor: 'rgb(235, 235, 235)', show: true, left: '3%', right: '4%', containLabel: true, bottom: '3%' }, xAxis: { type: 'category', data: chineseNameList, boundaryGap: true, nameGap: 30, splitArea: { show: false }, splitLine: { show: false }, axisLabel: { interval: 0, // 坐标轴刻度标签的显示间隔.设置成 0 强制显示所有标签。设置为 1,隔一个标签显示一个标签。 rotate: 45, // 倾斜度 -90 至 90 默认为0 textStyle: { fontWeight: 'bold', // 加粗 color: '#000000' // 黑色 } } }, yAxis: { type: 'value', name: '' // splitArea: { // show: true // } }, series: [ { name: 'boxplot', type: 'boxplot', data: data.boxData, tooltip: { formatter: function(param) { // // [min, Q1, median (or Q2), Q3, max] return [ '' + param.name + ': ', '上边界: ' + formatTwoDecimalPlaces(param.data[5]), '上四分位数: ' + formatTwoDecimalPlaces(param.data[4]), '中位数: ' + formatTwoDecimalPlaces(param.data[3]), '下四分位数: ' + formatTwoDecimalPlaces(param.data[2]), '下边界: ' + formatTwoDecimalPlaces(param.data[1]) ].join('<br/>') } } }, { name: '异常值', type: 'scatter', data: data.outliers } ] } // 使用刚指定的配置项和数据显示图表。 myChart.setOption(option) this.chart = myChart } else { myChart.clear() } }, initPie(dataPms) { const dataTemp = dataPms if (this.chartPie) { this.chartPie.dispose() } const myChart = echarts.init(document.getElementById('pieID')) if (dataTemp) { const topNum = 30 const nameList = [] const data1 = [] var seriesData = [] var titlePart = '' let nameSum = 'RiverSum' let nameGrade = 'RiverGrade' var titleText = '' const nameObj = { b: '极差', c: '差', d: '亚健康', e: '健康' } var rowLast = { b: 0, c: 0, d: 0, e: 0 } var colorArr = [ '#cc0033', '#ff9933', '#ffde33', '#096'] for (var m = 0; m < dataTemp.length; m++) { switch (dataTemp[m][nameGrade]) { case '极差': rowLast.b++ break case '差': rowLast.c++ break case '亚健康': rowLast.d++ break case '健康': rowLast.e++ break default: break } } // console.log('pie-rowLast', rowLast) for (var c in rowLast) { nameList.push(nameObj[c]) const objC = { value: rowLast[c], name: nameObj[c] }//, color:colorLast[c] data1.push(objC) } // console.log('pie-data1', data1) var option = { color: colorArr, title: { text: titleText, x: 'center' }, toolbox: { right: '20px', // left: 'right', feature: { // dataView: { // show: true, // title: '数据视图', // lang:['<div class="table-header-title" >'+titleText+'</div>','关闭'], // readOnly: true, //点击刷新按钮会导致第二列数据消失,此处设置只读是为了隐藏刷新按钮。 // optionToContent: function (opt) { // //console.log('bar-opt',opt) // return ToolboxDataView(opt); // } // }, saveAsImage: { show: true } } }, tooltip: { trigger: 'item', formatter: function(data) { return (data.seriesName + '<br/>' + data.name + ' : ' + formatTwoDecimalPlaces(data.value) + '个' + ' (' + formatTwoDecimalPlaces(data.percent) + '%' + ')')// } }, legend: { top: topNum, // orient: 'vertical', left: '5px', data: nameList }, series: [ { name: '类型占比', type: 'pie', radius: '55%', // center: ['65%', '30%'], center: ['50%', '60%'], data: data1, itemStyle: { emphasis: { shadowBlur: 10, shadowOffsetX: 0, shadowColor: 'rgba(0, 0, 0, 0.5)' } }, label: { normal: { show: false } } } ] } // console.log('pie-option',option) // 使用刚指定的配置项和数据显示图表。 myChart.setOption(option) this.chartPie = myChart } else { myChart.clear() } } } }); /************** vue外部方法**************************************/ function getTips(name, value) { var data = habitatScoreArr; var value2 = ''; var arr1 = []; for (let i = 0; i < data.length; i++) { if (data[i].Abridge == name) { arr1.push(data[i]); //if (value >= data[i].Score) { // value2 = data[i].EvaluateStandard //} } } //console.log('arr1', arr1); for (let j = 0; j < arr1.length; j++) { if (j < arr1.length - 1) { if (value == arr1[j].Score || value > arr1[j].Score) { value2 = arr1[j].EvaluateStandard; break; } //data是从大到小排序的,当前值value>=大值是,就必须break跳出for循环,否则value也一定>=后面的小值; //if (arr1[j].HabitatScoreType == 5) { // console.log('arr1', arr1) // if (value == arr1[j].Score ) { // console.log(arr1[j].DValue, arr1[j].Score, value, value2) // } // if (value > arr1[j].Score) { // console.log(111,arr1[j].DValue, arr1[j].Score, value, value2) // } //} /* 河道改变程度 1.5 1.5 渠道化出现较少,通常在桥墩周围处出现渠道化,对水生生物影响小 111 "河道改变程度" 1 1.5 "渠道化比较广泛,在两岸有筑堤或桥梁支柱出现,对水生生物有影响 */ } else if (arr1.length - 1 == j && value2 == '') { value2 = arr1[j].EvaluateStandard; } } //console.log(arr1[j].DValue, arr1[j].Score, value, value2) return value2 } function renderCell(h, params) { //console.log('h', h) //console.log('params', params) var tipsContent = getTips(params.column.key, params.row[params.column.key]) //console.log('tipsContent', tipsContent) var values = formatTwoDecimalPlaces(params.row[params.column.key]) return h('tooltip', { props: { placement: 'top' } }, [ values, h('div', { slot: 'content', style: { whiteSpace: 'normal', wordBreak: 'break-all' } }, tipsContent ) ] ) } function renderHeader1(h, params) { // console.log('h', h) // console.log('params', params) return h('tooltip', { props: { transfer: true, placement: 'bottom-end'//下右 } }, [ //h('span', '优势度'), h('span', params.column.title), h('div', { 'class': { 'custom-tooltip-content': true }, slot: 'content' }, [ h('p', '物种所占优势程度,由物种密度和采样点出现的频次计算所得。') ] ) ] ) } function ToolboxDataView(opt) { var unit = '' if (opt.yAxis[0].name != undefined && opt.yAxis[0].name != null && opt.yAxis[0].name != '') { unit = '<div class="echart-table-uint"> ' + opt.yAxis[0].name + ' </div>' } var axisData = opt.xAxis[0].data // 坐标数据 var series = opt.series // 折线图数据 var tdHeads = '<td >名称</td>' // 表头第一列 var tdBodys = '' // 表数据 // 组装表头 for (var i = 0; i < series.length; i++) { tdHeads += '<td >' + series[i].name + '</td>' } var table = '<table class="echart-table" ><tbody><tr>' + tdHeads + ' </tr>' // 组装表数据 // 行数 for (var i = 0; i < axisData.length; i++) { // 列数 for (var j = 0; j < series.length; j++) { var temp = series[j].data[i] if (temp != null && temp != undefined) { tdBodys += '<td>' + formatTwoDecimalPlaces(temp) + '</td>' } else { tdBodys += '<td></td>' } } table += '<tr><td >' + axisData[i] + '</td>' + tdBodys + '</tr>' tdBodys = '' } table += '</tbody></table>' return unit + table } function TooltipFormatter(data) { var seriesNames = [] var formateStrings = [] var formateString = '' if (data.length > 0) { formateStrings.push(data[0].axisValue) for (var i in data) { var item = data[i] seriesNames.push(item.seriesName) if (item.value != undefined) { formateStrings.push(item.marker + item.seriesName + ': ' + formatTwoDecimalPlaces(item.value)) } } formateString = formateStrings.join('<br />') return formateString } } function translateRiverGrade(a) { var value = ""; if (a <= 40) { value = "极差" }else if(a<=60){ value = "差"; }else if(a<=80){ value = "亚健康"; } else if (a <= 100) { value = "健康"; } //console.log("a", a); //console.log("value", value); return value; } </script> |
转载来源:https://blog.csdn.net/qq_32678401/article/details/97802414
iview--table表格title提示和气泡提示
文本不换行,超出显示省略号,两种提示方式,title提示和气泡提示
气泡提示不足:当内容没超过一行,也会出现气泡提示。觉得不如Element-UI的table组件好用。
1 2 3 4 5 6 7 8 9 10 11 12 13 14 15 16 17 18 19 20 21 22 23 24 25 26 27 28 29 30 31 32 33 34 35 36 37 38 39 40 41 42 43 44 45 46 47 48 49 50 51 52 53 54 55 56 | <Table border :columns="tableColumn" :data="tableData"></Table> mounted() { this.initTableColumn('tableColumn')},methods: { initTableColumn(columnName) { // 提示一:title提示 for (let i = 0; i < this[columnName].length; i++) { if (!this[columnName][i].render) { this.$set(this[columnName][i], 'ellipsis', true) this.$set(this[columnName][i], 'render', (h, params) => { return h('span', {attrs: {title: params.row[params.column.key]}}, params.row[params.column.key]) }) } } // title提示 for (let i = 0; i < this[columnName].length; i++) { if (!this[columnName][i].render) { this.$set(this[columnName][i], 'render', (h, params) => { return h('div', [ h('span', { style: { display: 'inline-block', width: '100%', overflow: 'hidden', textOverflow: 'ellipsis', whiteSpace: 'nowrap' }, domProps: { title: params.row[params.column.key] } }, params.row[params.column.key]) ]) }) } } // 提示二:气泡提示 for (let i = 0; i < this[columnName].length; i++) { if (!this[columnName][i].render) { this.$set(this[columnName][i], 'ellipsis', true) this.$set(this[columnName][i], 'render', (h, params) => { return h('Tooltip', { props: { placement: 'top' } }, [ params.row[params.column.key], h('span', { slot: 'content', style: { whiteSpace: 'normal', wordBreak: 'break-all' } }, params.row[params.column.key]) ]) }) } } }} |
树立目标,保持活力,gogogo!
标签:
iView


【推荐】国内首个AI IDE,深度理解中文开发场景,立即下载体验Trae
【推荐】编程新体验,更懂你的AI,立即体验豆包MarsCode编程助手
【推荐】抖音旗下AI助手豆包,你的智能百科全书,全免费不限次数
【推荐】轻量又高性能的 SSH 工具 IShell:AI 加持,快人一步
· 开发者必知的日志记录最佳实践
· SQL Server 2025 AI相关能力初探
· Linux系列:如何用 C#调用 C方法造成内存泄露
· AI与.NET技术实操系列(二):开始使用ML.NET
· 记一次.NET内存居高不下排查解决与启示
· 阿里最新开源QwQ-32B,效果媲美deepseek-r1满血版,部署成本又又又降低了!
· 开源Multi-agent AI智能体框架aevatar.ai,欢迎大家贡献代码
· Manus重磅发布:全球首款通用AI代理技术深度解析与实战指南
· 被坑几百块钱后,我竟然真的恢复了删除的微信聊天记录!
· AI技术革命,工作效率10个最佳AI工具
2017-07-14 数据冗余与外键
2017-07-14 源码网站汇总(转载)
2017-07-14 SQL语句的增删改查(详细)--转载