Matplotlib基本绘图
Matplotlib基本绘图
1.折线图
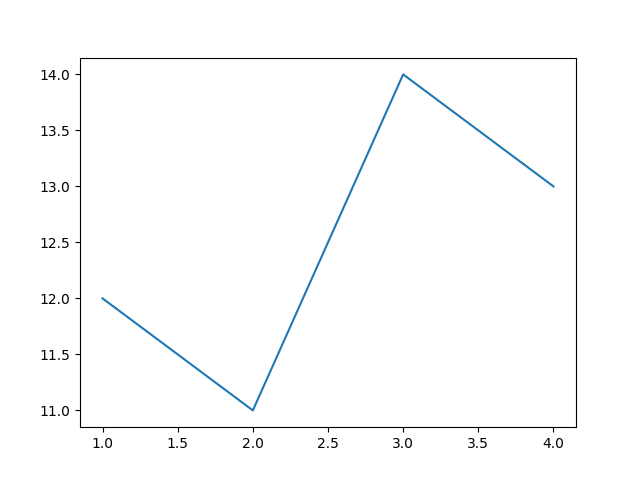
(1)基本绘图
plt.plot(x,y)
import matplotlib.pyplot as plt

x = [1, 2, 3, 4]
y = [12, 11, 14, 13]
plt.plot(x, y)
plt.show()
(2)定义样式
A.线条样式
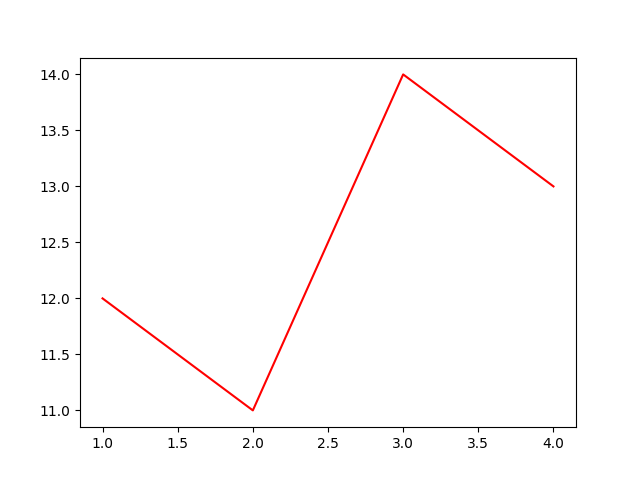
a.线条颜色
plt.plot(x,y,color=颜色)
import matplotlib.pyplot as plt

x = [1, 2, 3, 4]
y = [12, 11, 14, 13]
plt.plot(x, y, color="red")
plt.show()
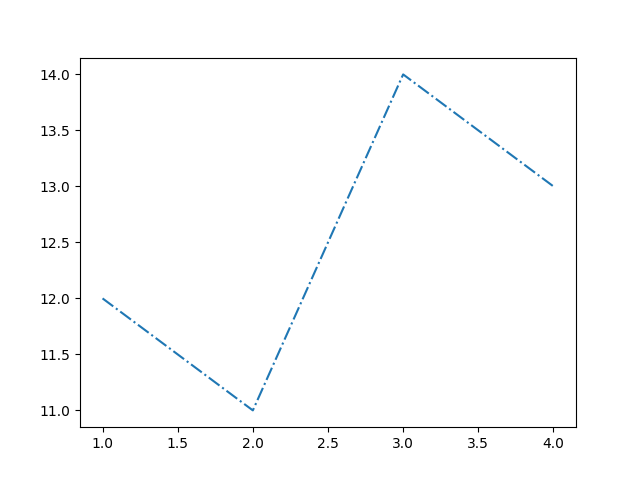
b.线条外观
plt.plot(x,y,linestyle=值)
linestyle的取值如下
| 关键字 | 字符 | 说明 |
|---|---|---|
| solid | - | 实线 |
| dashed | -- | 虚线 |
| dotted | : | 点线 |
| dashdot | -. | 点划线 |
import matplotlib.pyplot as plt

x = [1, 2, 3, 4]
y = [12, 11, 14, 13]
plt.plot(x, y, linestyle="-.")
plt.show()
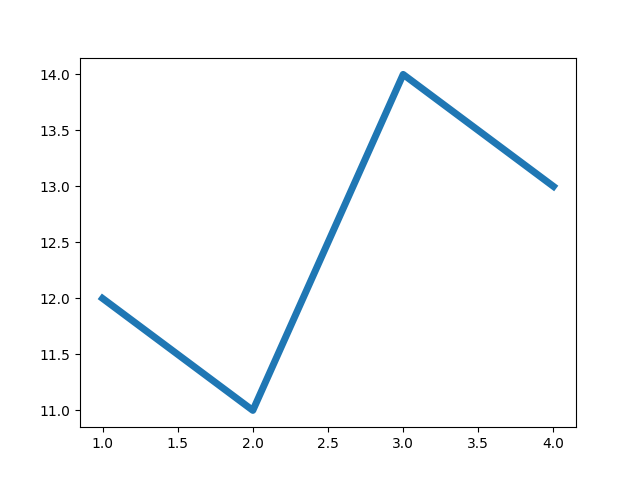
c.线条宽度
plt.plot(x, y, linewidth=值)
import matplotlib.pyplot as plt

x = [1, 2, 3, 4]
y = [12, 11, 14, 13]
plt.plot(x, y, linewidth=5)
plt.show()
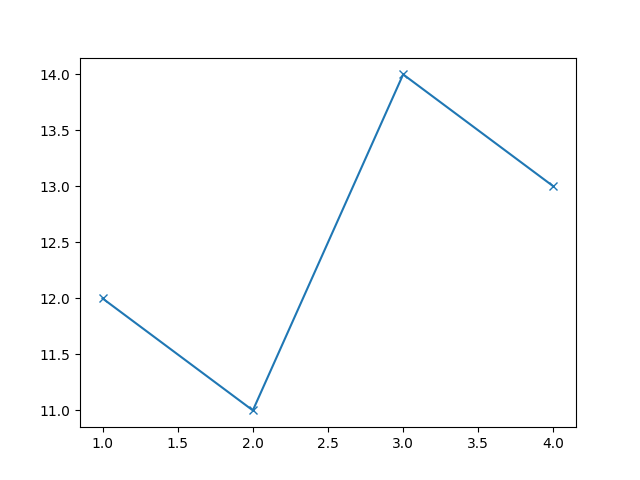
B.节点样式
a.节点外观
plt.plot(x,y,marker=值)
节点样式的取值如下
| 取值 | 说明 |
|---|---|
| . | 点 |
| , | 像素 |
| o | 实心圆 |
| v | 下三角 |
| ^ | 上三角 |
| < | 左三角 |
| > | 右三角 |
| 1 | 下花三角 |
| 2 | 上花三角 |
| 3 | 左花三角 |
| 4 | 右花三角 |
| s | 实心正方形 |
| p | 实心五角星 |
| * | 星型 |
| h | 竖六边形 |
| H | 横六边形 |
| + | 加号 |
| x | 叉号 |
| d | 小菱形 |
| D | 大菱形 |
| | | 垂直线 |
import matplotlib.pyplot as plt

x = [1, 2, 3, 4]
y = [12, 11, 14, 13]
plt.plot(x, y, marker="x")
plt.show()
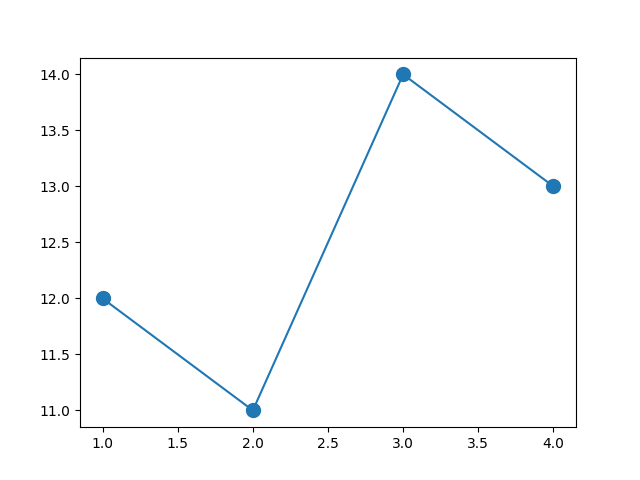
b.节点大小
plt.plot(x,y,markersize=值)
plt.plot(x,y,ms=值)
import matplotlib.pyplot as plt

x = [1, 2, 3, 4]
y = [12, 11, 14, 13]
plt.plot(x, y, ms=10, marker="o")
plt.show()
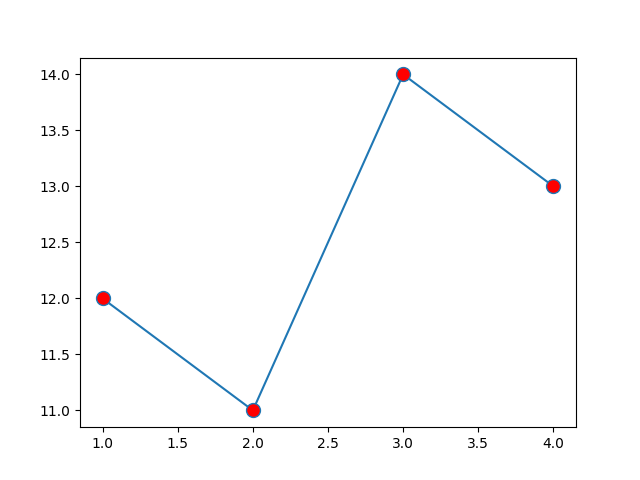
c.节点颜色
plt.plot(x,y,markerfacecolor=值)
plt.plot(x,y,mfc=值)
import matplotlib.pyplot as plt

x = [1, 2, 3, 4]
y = [12, 11, 14, 13]
plt.plot(x, y, ms=10, marker="o",mfc="red")
plt.show()
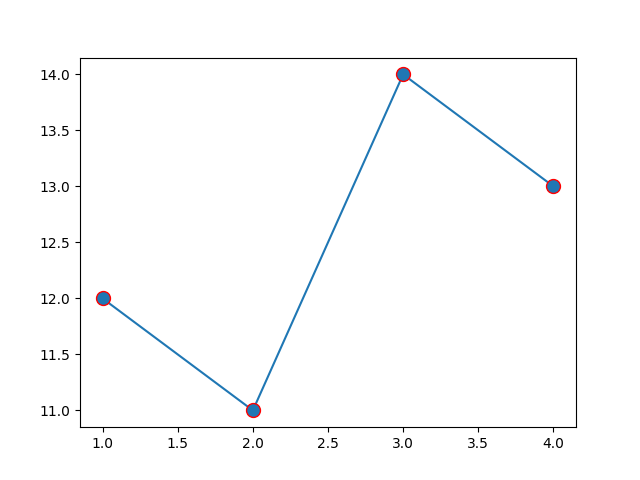
d.边框颜色
plt.plot(x,y,markeredgecolor=值)
plt.plot(x,y,mec=值)
import matplotlib.pyplot as plt

x = [1, 2, 3, 4]
y = [12, 11, 14, 13]
plt.plot(x, y, ms=10, marker="o", mec="red")
plt.show()
(2)通用设置
| 函数 | 说明 |
|---|---|
| figure() | 画布样式 |
| title()、xlabel()、ylabel() | 定义标题 |
| legend() | 定义图例 |
| xticks()、yticks() | 刻度标签 |
| xlim()、ylim() | 刻度范围 |
| grid() | 网格线 |
| axhline()、axvline() | 参考线 |
| axhspan()、axvspan() | 参考区域 |
| annotate() | 注释内容(有指向) |
| text() | 注释内容(无指向) |
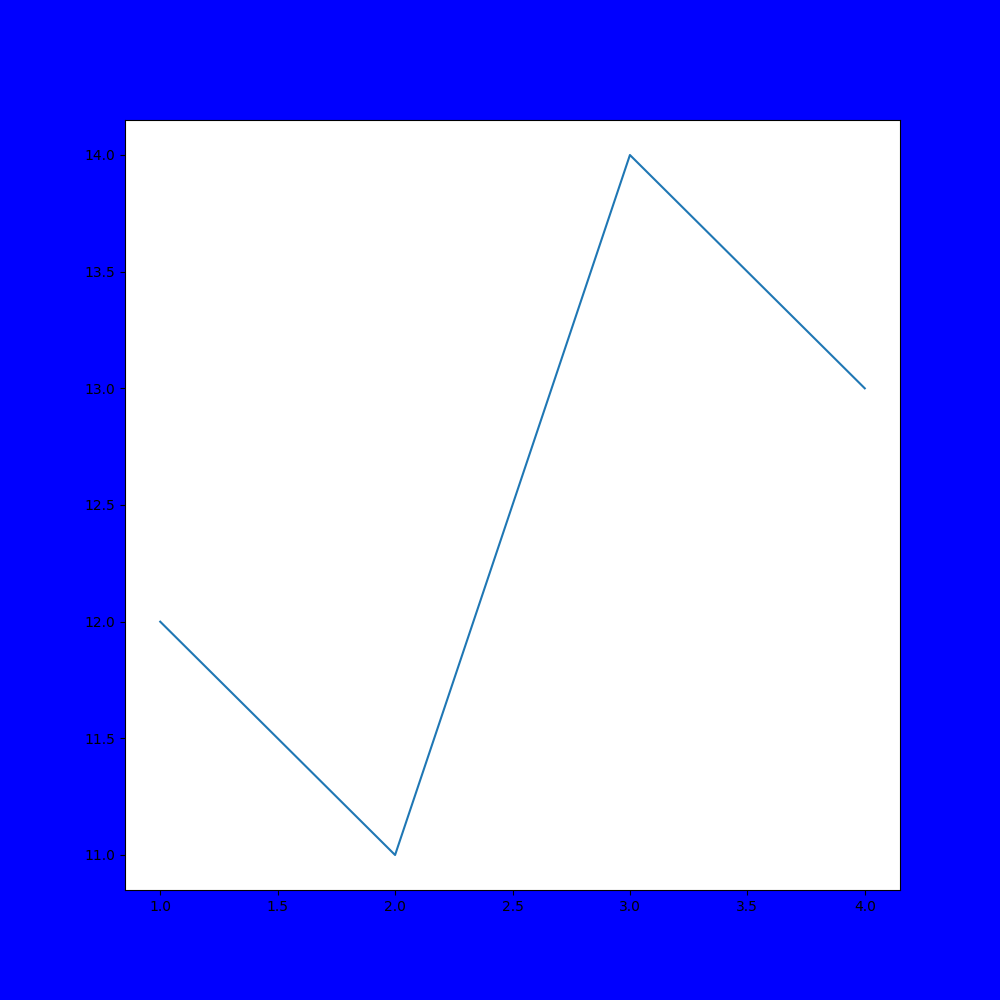
A.画布样式
plt.figure(figsize=元组,facecolor=值,edgecolor=值)
- figsize是一个元组 (宽度,高度) 单位英寸
- facecolor画布颜色
- edgecolor边框颜色
import matplotlib.pyplot as plt

x = [1, 2, 3, 4]
y = [12, 11, 14, 13]
plt.figure(figsize=(10, 10), facecolor="blue", edgecolor="red")
plt.plot(x, y)
plt.show()
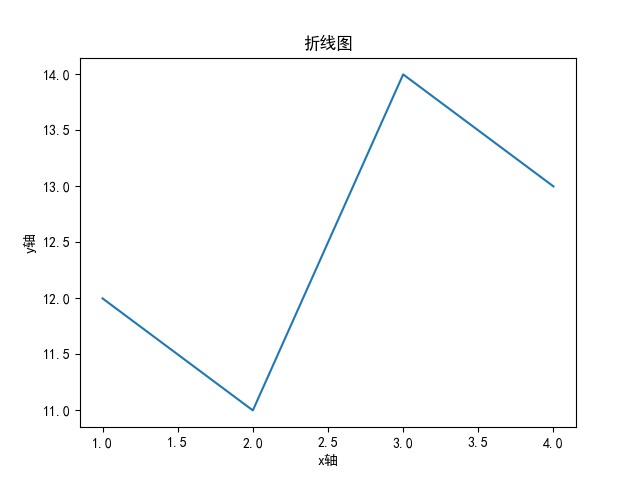
B.定义标题
# 定义主标题
plt.title(label=值,loc=left、center、right)
# 定义x轴标题
plt.xlabel(xlabel=值,loc=left、center、right)
# 定义y轴标题
plt.ylabel(ylabel=值,loc=top、center、bottom)
label为要显示的内容
import matplotlib.pyplot as plt

x = [1, 2, 3, 4]
y = [12, 11, 14, 13]
# 显示中文
plt.rcParams["font.family"] = ["SimHei"]
plt.title(label="折线图", loc="center")
plt.xlabel(xlabel="x轴", loc="center")
plt.ylabel(ylabel="y轴", loc="center")
plt.plot(x, y)
plt.show()
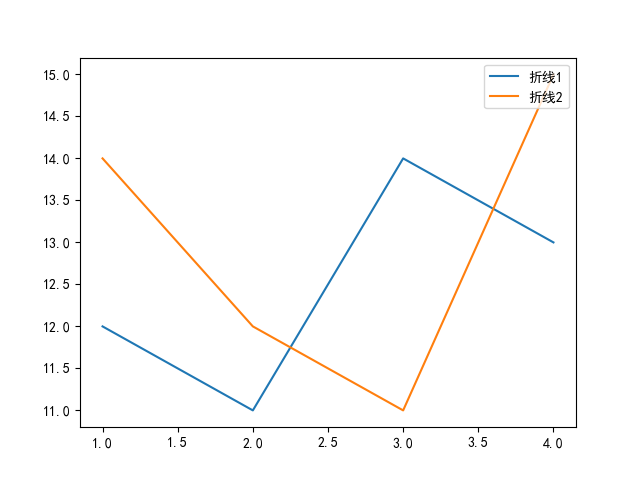
C.定义图例
plt.legend(loc)
loc的值如下
| 取值 | 说明 |
|---|---|
| upper left | 左上 |
| upper center | 靠上居中 |
| upper right | 右上 |
| center left | 居中靠左 |
| center | 正中 |
| center right | 居中靠右 |
| lower left | 左下 |
| lower center | 靠下居中 |
| lower right | 右下 |
示意图如下
| upper left | upper center | upper right |
| center left | center | center right |
| lower left | lower center | lower right |
import matplotlib.pyplot as plt

x1 = [1, 2, 3, 4]
y1 = [12, 11, 14, 13]
x2 = [1, 2, 3, 4]
y2 = [14, 12, 11, 15]
# 显示中文
plt.rcParams["font.family"] = ["SimHei"]
plt.plot(x1, y1, label="折线1")
plt.plot(x2, y2, label="折线2")
plt.legend(loc="upper right")
plt.show()
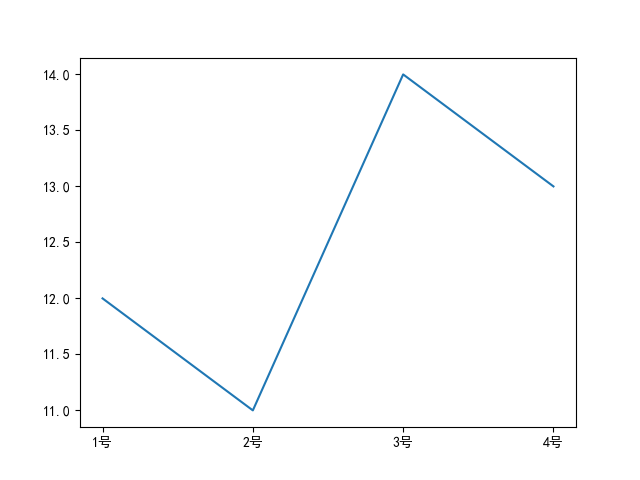
D.刻度标签
# x轴刻度标签
plt.xticks(ticks=range对象,labels=列表)
# y轴刻度标签
plt.yticks(ticks=range对象,labels=列表)
import matplotlib.pyplot as plt

x = [1, 2, 3, 4]
y = [12, 11, 14, 13]

# 显示中文
plt.rcParams["font.family"] = ["SimHei"]
plt.plot(x, y)
plt.xticks(ticks=range(1, 5), labels=["1号", "2号", "3号", "4号"])
plt.show()
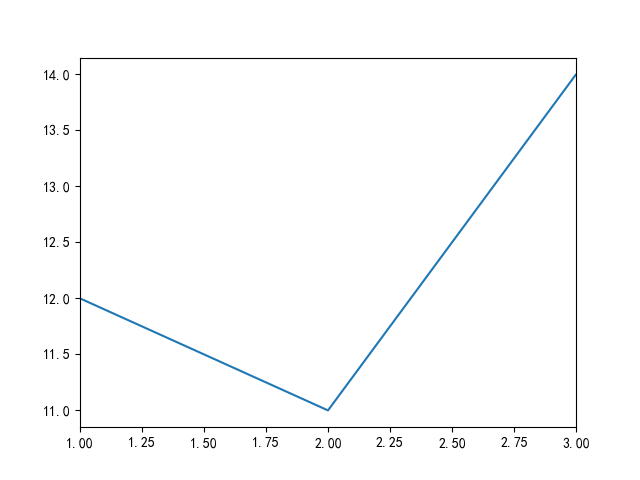
E.刻度范围
plt.xlim(left=值,right=值)
plt.ylim(left=值,right=值)
刻度的取值范围为[left,right]
import matplotlib.pyplot as plt

x = [1, 2, 3, 4]
y = [12, 11, 14, 13]

# 显示中文
plt.rcParams["font.family"] = ["SimHei"]
plt.plot(x, y)
plt.xlim(left=1, right=3)
plt.show()
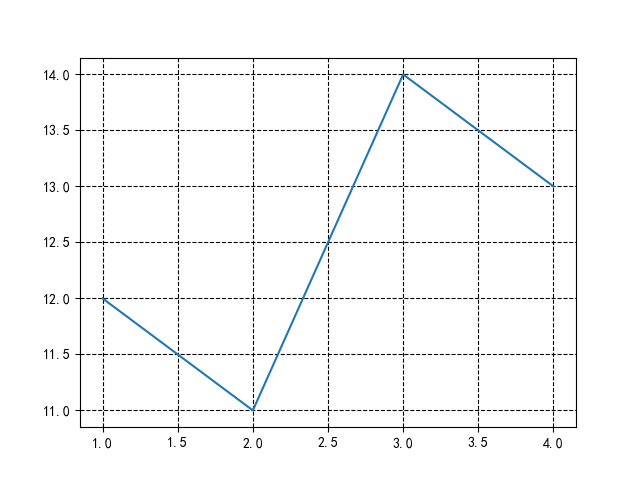
F.网格线
plt.grid(axis=值,linestyle=值,color=值)
axis的取值如下
| 取值 | 说明 |
|---|---|
| both | 显示两个方向的网格(默认值) |
| x | 显示水平网格 |
| y | 显示垂直网格 |
linestyle的取值
| 关键字 | 字符 | 说明 |
|---|---|---|
| solid | - | 实线(默认值) |
| dashed | -- | 虚线 |
| dotted | : | 点线 |
| dashdot | -. | 点划线 |
import matplotlib.pyplot as plt

x = [1, 2, 3, 4]
y = [12, 11, 14, 13]

# 显示中文
plt.rcParams["font.family"] = ["SimHei"]
plt.plot(x, y)
plt.grid(axis="both", linestyle="dashed", color="black")
plt.show()
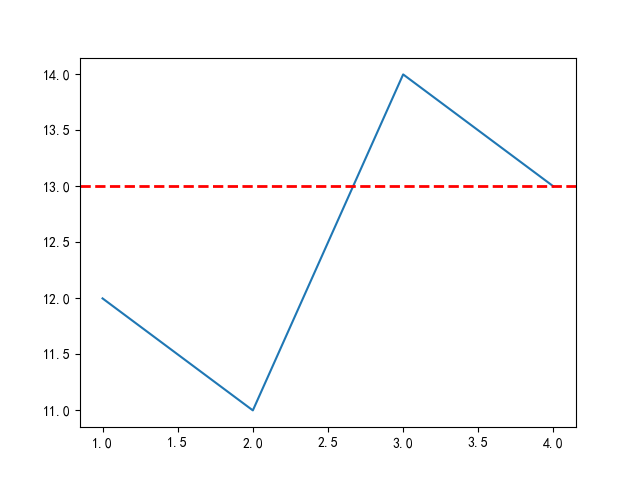
G.参考线
plt.axhline(y=值,color=值,linestyle=值,linewidth=值)
plt.axvline(x=值,color=值,linestyle=值,linewidth=值)
import matplotlib.pyplot as plt

x = [1, 2, 3, 4]
y = [12, 11, 14, 13]

# 显示中文
plt.rcParams["font.family"] = ["SimHei"]
plt.plot(x, y)
plt.axhline(y=13, color="red", linestyle="dashed", linewidth=2)
plt.show()
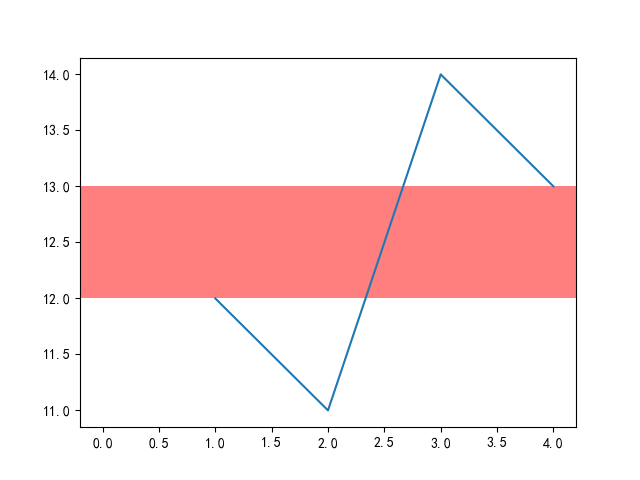
H.参考区域
plt.axhspan(ymin=值,ymax=值,facecolor=值,alpha=值)
plt.axvspan(xmin=值,xmax=值,facecolor=值,alpha=值)
alpha为透明度取值为(0,1)
import matplotlib.pyplot as plt

x = [1, 2, 3, 4]
y = [12, 11, 14, 13]

# 显示中文
plt.rcParams["font.family"] = ["SimHei"]
plt.plot(x, y)
plt.axhspan(ymin=12, ymax=13, facecolor="red", alpha=0.5)
plt.show()
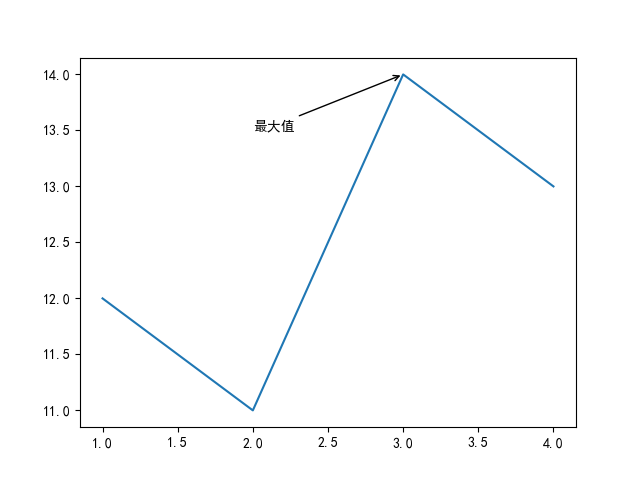
I.注释文本(有指向)
plt.annotate(text=值,xy=元组,xytext=元组,arrowprops=字典)
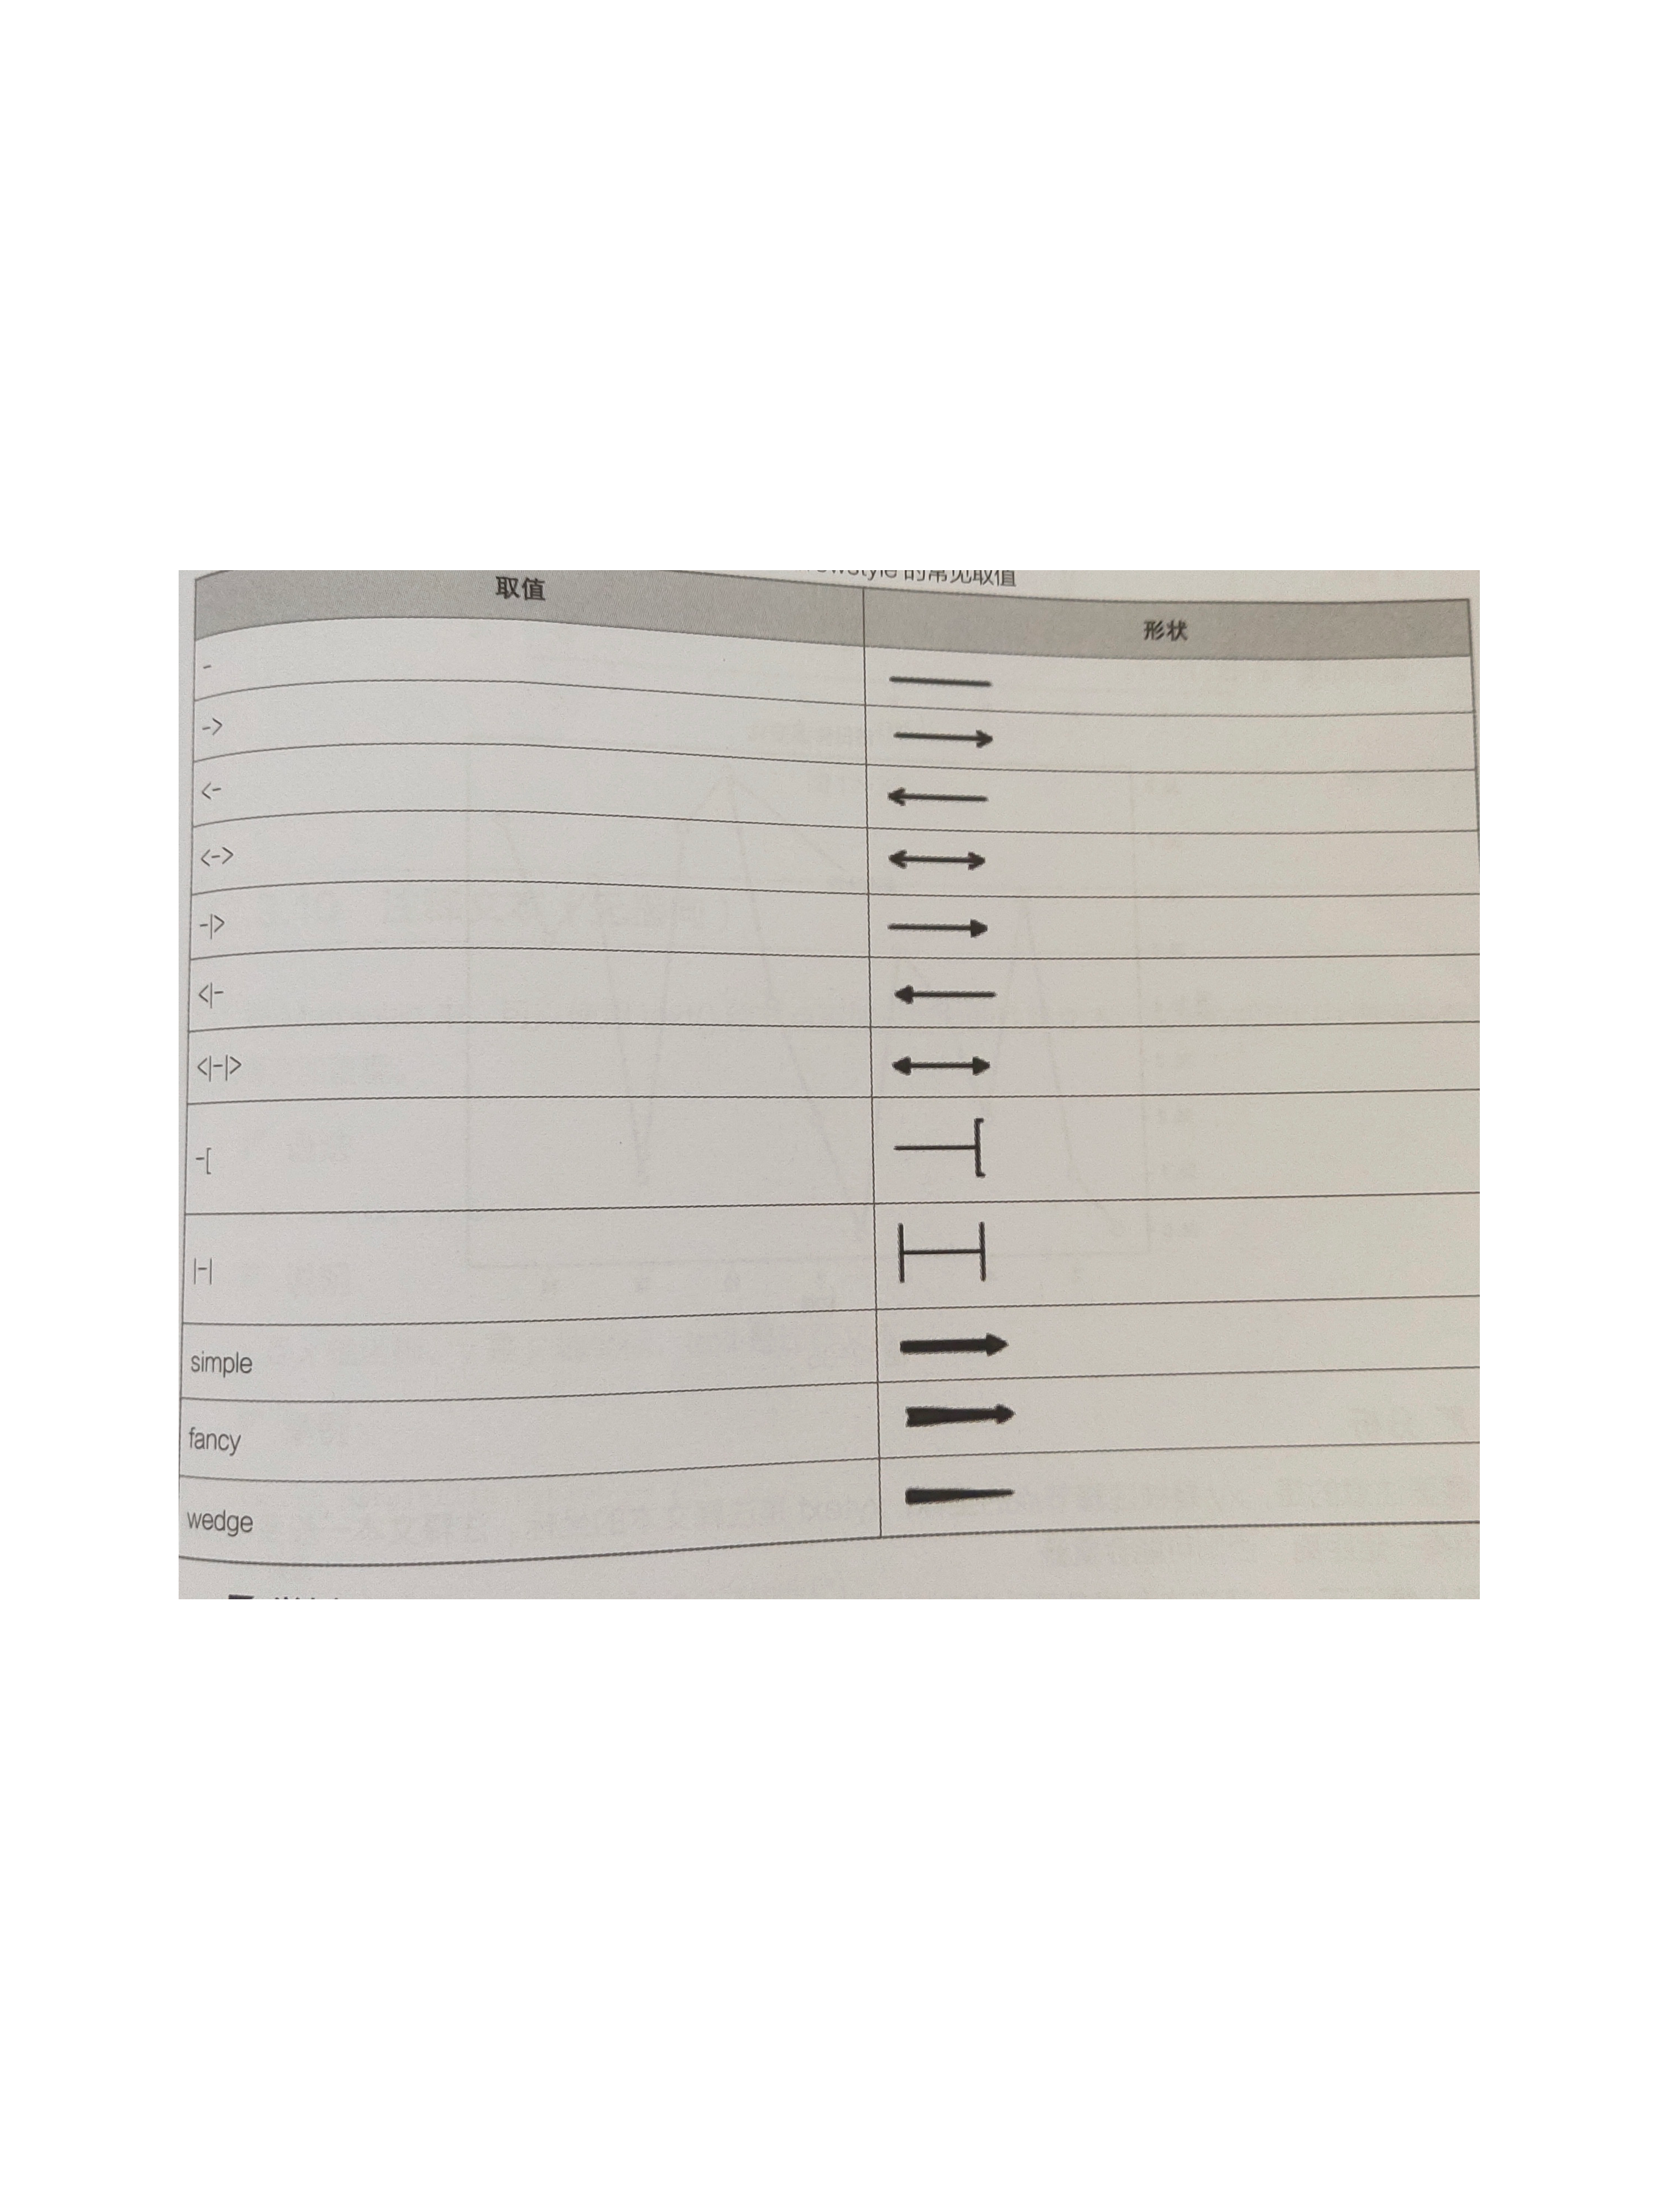
arrowprops的常用键包括color、width、headwidth、headlength、shrink、arrowstyle
arrowstyle的取值如下
import matplotlib.pyplot as plt

x = [1, 2, 3, 4]
y = [12, 11, 14, 13]

# 显示中文
plt.rcParams["font.family"] = ["SimHei"]
plt.plot(x, y)
plt.annotate(text="最大值", xy=(3, 14), xytext=(2, 13.5), arrowprops={"arrowstyle": "->"})
plt.show()
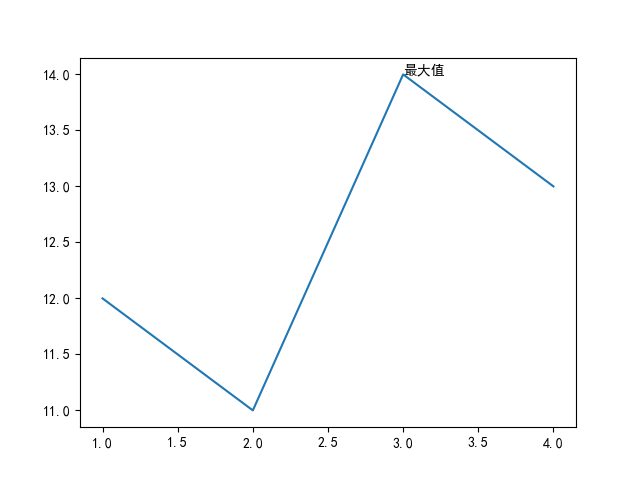
J.注释文本(无指向)
plt.text(x=值,y=值,s=值)
import matplotlib.pyplot as plt

x = [1, 2, 3, 4]
y = [12, 11, 14, 13]

# 显示中文
plt.rcParams["font.family"] = ["SimHei"]
plt.plot(x, y)
plt.text(x=3, y=14, s="最大值")
plt.show()
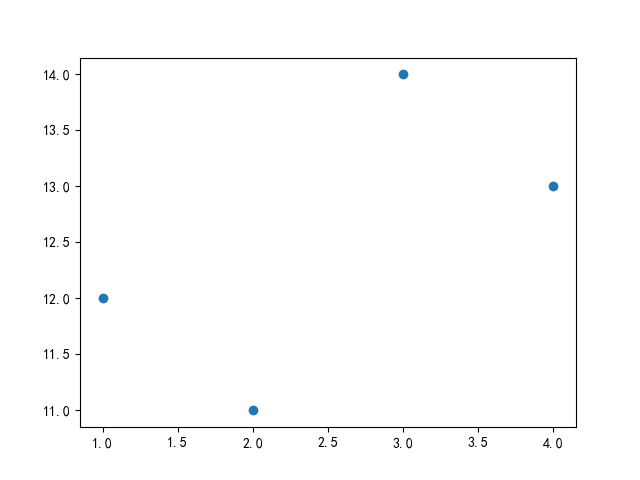
2.散点图
plt.scatter(x,y,marker=值,s=散点的大小,color=值,alpha=值)
- marker:散点的形状
- s:散点的大小
- color:散点的颜色
- alpha:散点的透明度
import matplotlib.pyplot as plt

x = [1, 2, 3, 4]
y = [12, 11, 14, 13]

# 显示中文
plt.rcParams["font.family"] = ["SimHei"]
plt.scatter(x, y)
plt.show()
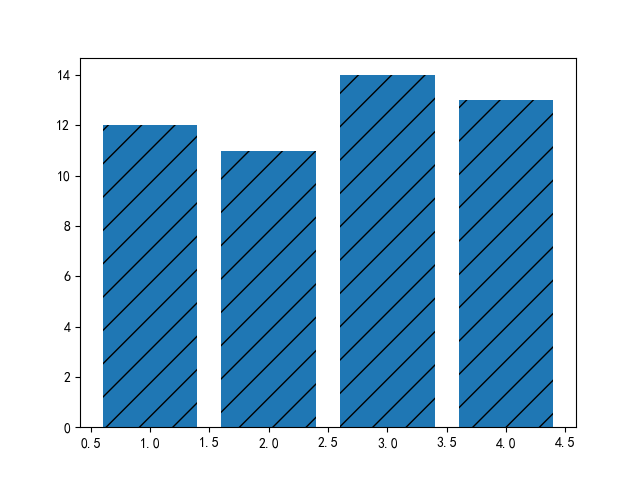
3.柱状图
plt.bar(x,y,hatch)
hatch为装饰线,有以下的值:/ | - \
import matplotlib.pyplot as plt

x = [1, 2, 3, 4]
y = [12, 11, 14, 13]

# 显示中文
plt.rcParams["font.family"] = ["SimHei"]
plt.bar(x, y, hatch="/")
plt.show()
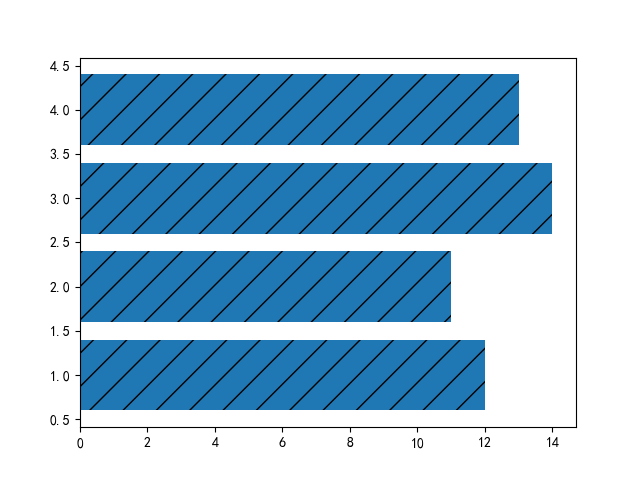
4.条形图
plt.barh(x,y,hatch)
import matplotlib.pyplot as plt

x = [1, 2, 3, 4]
y = [12, 11, 14, 13]

# 显示中文
plt.rcParams["font.family"] = ["SimHei"]
plt.barh(x, y, hatch="/")
plt.show()
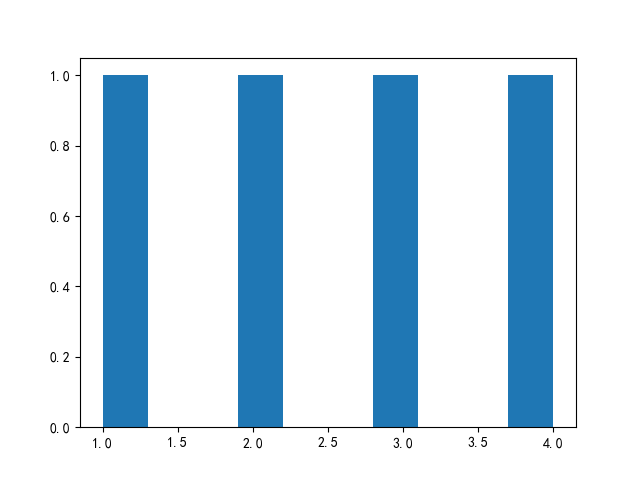
5.直方图
plt.hist(x,bins=整数或列表)
bins为整数时表示柱条有几条,为列表定义每一根柱条的范围
import matplotlib.pyplot as plt

x = [1, 2, 3, 4]
y = [12, 11, 14, 13]

# 显示中文
plt.rcParams["font.family"] = ["SimHei"]
plt.hist(x)
plt.show()
6.饼状图
plt.pie(x)
import matplotlib.pyplot as plt

x = [1, 2, 3, 4]
y = [12, 11, 14, 13]

# 显示中文
plt.rcParams["font.family"] = ["SimHei"]
plt.pie(x)
plt.show()