


prometheus 统计MySQL 自增主键的剩余可用百分比
mysqld_exporter自带的这个功能,下面是我使用的启动参数:
nohup ./mysqld_exporter --config.my-cnf="./my.cnf" --web.listen-address=":9104" --collect.heartbeat --collect.auto_increment.columns --collect.binlog_size --collect.engine_innodb_status --collect.engine_tokudb_status --collect.slave_hosts --collect.slave_status --collect.info_schema.processlist --collect.info_schema.innodb_metrics > /dev/null 2>&1 &
红色高亮的参数,就是用来采集到自增id的使用情况的。
实际上执行的类似这个SQL:
SELECT
table_schema,
table_name,
column_name,
AUTO_INCREMENT,
c.COLUMN_TYPE,
POW(2, CASE data_type
WHEN 'tinyint' THEN 7
WHEN 'smallint' THEN 15
WHEN 'mediumint' THEN 23
WHEN 'int' THEN 31
WHEN 'bigint' THEN 63
END+(column_type LIKE '% unsigned'))-1 AS max_int
FROM information_schema.tables t
JOIN information_schema.columns c USING (table_schema,table_name)
WHERE
c.extra = 'auto_increment'
AND
t.TABLE_SCHEMA NOT IN ('information_schema','mysql', 'sys','test','performance_schema')
AND
t.auto_increment IS NOT NULL ;
在prometheus的web界面,我们可以测试编写如下的promql, 找出剩余自增id可以率少于40%的实例的库+表名
(mysql_info_schema_auto_increment_column_max{schema!~'test|mysql'} - mysql_info_schema_auto_increment_column{schema!~'test|mysql'})/mysql_info_schema_auto_increment_column_max{schema!~'test|mysql'}*100 < 40
或
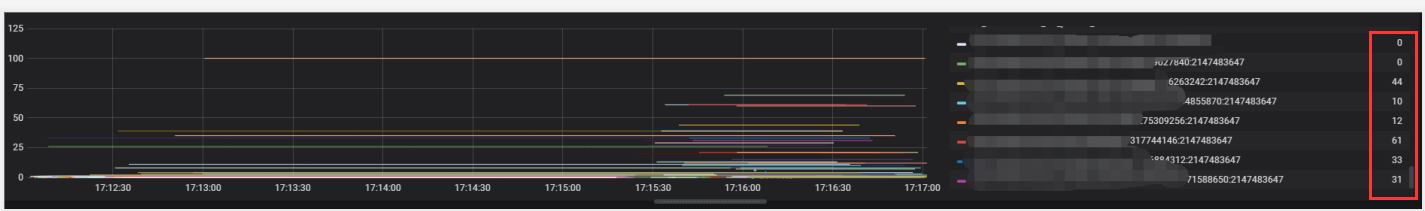
在zabbix取值,用当时id/最大值的占比,然后通过grafana去取值,红色框里的值是每个表对应的自增ID值占比


【推荐】国内首个AI IDE,深度理解中文开发场景,立即下载体验Trae
【推荐】编程新体验,更懂你的AI,立即体验豆包MarsCode编程助手
【推荐】抖音旗下AI助手豆包,你的智能百科全书,全免费不限次数
【推荐】轻量又高性能的 SSH 工具 IShell:AI 加持,快人一步
· 从 HTTP 原因短语缺失研究 HTTP/2 和 HTTP/3 的设计差异
· AI与.NET技术实操系列:向量存储与相似性搜索在 .NET 中的实现
· 基于Microsoft.Extensions.AI核心库实现RAG应用
· Linux系列:如何用heaptrack跟踪.NET程序的非托管内存泄露
· 开发者必知的日志记录最佳实践
· winform 绘制太阳,地球,月球 运作规律
· AI与.NET技术实操系列(五):向量存储与相似性搜索在 .NET 中的实现
· 超详细:普通电脑也行Windows部署deepseek R1训练数据并当服务器共享给他人
· 上周热点回顾(3.3-3.9)
· AI 智能体引爆开源社区「GitHub 热点速览」