cesium 图层构建的那些事 (十三)
我们来构建echart 图层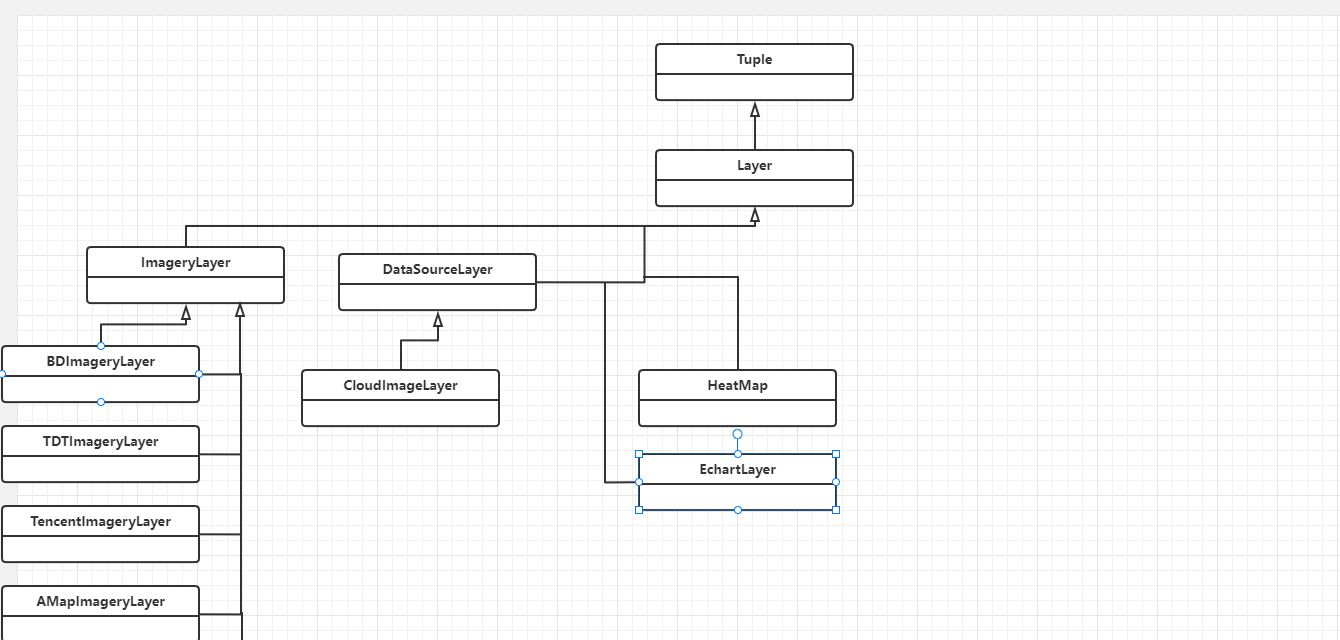
```javascript
import {Layer} from "./Layer";
import echarts from 'echarts';
class E3CoordinateSystem {
_viewer: any;
_mapOffset = [0, 0];
dimensions = ["x", "y"]
-
constructor(viewer: any) {
-
this._viewer = viewer;
-
}
-
-
create(t: any, api: any) {
-
var coordinateSystem: any = new E3CoordinateSystem(this._viewer);
-
t.eachComponent("cesium", (t: any) => {
-
coordinateSystem.setMapOffset(t.__mapOffset || [0, 0]);
-
t.coordinateSystem = coordinateSystem;
-
});
-
t.eachSeries(function (e: any) {
-
"cesium" === e.get("coordinateSystem") && (e.coordinateSystem = coordinateSystem)
-
})
-
}
-
-
getDimensionsInfo = function () {
-
return ["x", "y"]
-
}
-
-
setMapOffset(mapOffset: any) {
-
this._mapOffset = mapOffset
-
}
-
-
dataToPoint(data: any) {
-
var scene = this._viewer.scene
-
var defaultPoint = [0, 0];
-
var point = Cesium.Cartesian3.fromDegrees(data[0], data[1]);
-
if (!point) {
-
return defaultPoint;
-
}
-
if (scene.mode === Cesium.SceneMode.SCENE3D && Cesium.Cartesian3.angleBetween(scene.camera.position, point) > Cesium.Math.toRadians(80)) {
-
return false;
-
}
-
var cesiumPoint = scene.cartesianToCanvasCoordinates(point);
-
if (!cesiumPoint) {
-
return defaultPoint;
-
}
-
return [cesiumPoint.x - this._mapOffset[0], cesiumPoint.y - this._mapOffset[1]]
-
}
-
-
pointToData(point: any) {
-
var mapOffset = this._mapOffset;
-
var ellipsoid = this._viewer.scene.globe.ellipsoid;
-
var cartesian3 = new Cesium.cartesian3(point[1] + mapOffset[1], point[2] + mapOffset[2], 0);
-
var p = ellipsoid.cartesianToCartographic(cartesian3);
-
return [p.lng, p.lat]
-
}
-
-
getviewerRect() {
-
var canvas = this._viewer.canvas;
-
return new echarts.graphic.BoundingRect(0, 0, canvas.width, canvas.height)
-
}
-
-
getRoamTransform() {
-
return echarts.matrix.create()
-
}
}
export class EchartLayer extends Layer {
private visible: boolean = true;
chartOption: any;//echart的option参数
chart: any;//echart对象
cesiumHandler: any;//cesium事件
extent: any;//外包围盒
constructor(option: any) {
super(option.name)
// console.log(option);
option.tooltip = {
trigger: 'item'
}
option.animation = false;
this.chartOption = option;
this.isAdd2LoadCesium = true;
}
-
set show(visible: boolean) {
-
if (this.cesiumObj && this.visible !== visible) {
-
this.cesiumObj.hidden = !visible;
-
this.visible = visible,
-
visible && this.setCharts()
-
}
-
}
-
-
get show(): boolean {
-
return this.visible;
-
}
-
-
protected _addToMap(map: any) {
-
this.init(map);
-
}
-
-
protected _removeByMap(destroy?: boolean) {
-
this.map.container.removeChild(this.cesiumObj);
-
this.cesiumObj = null;
-
this.chart = null;
-
this.chartOption = null;
更多参考 https://xiaozhuanlan.com/topic/7623980154

 浙公网安备 33010602011771号