
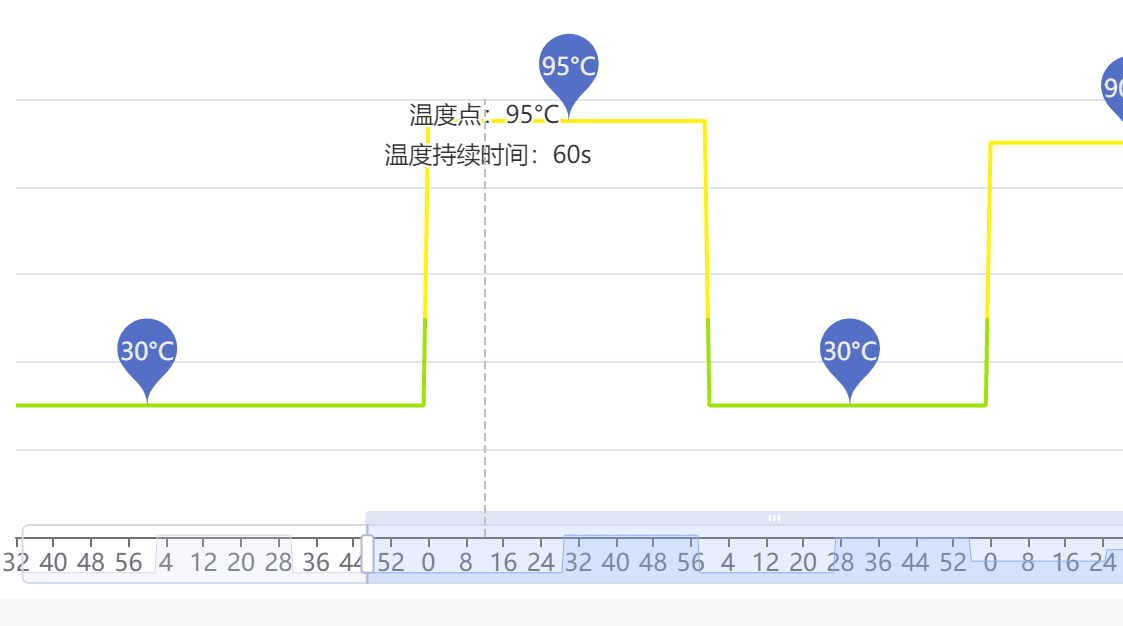
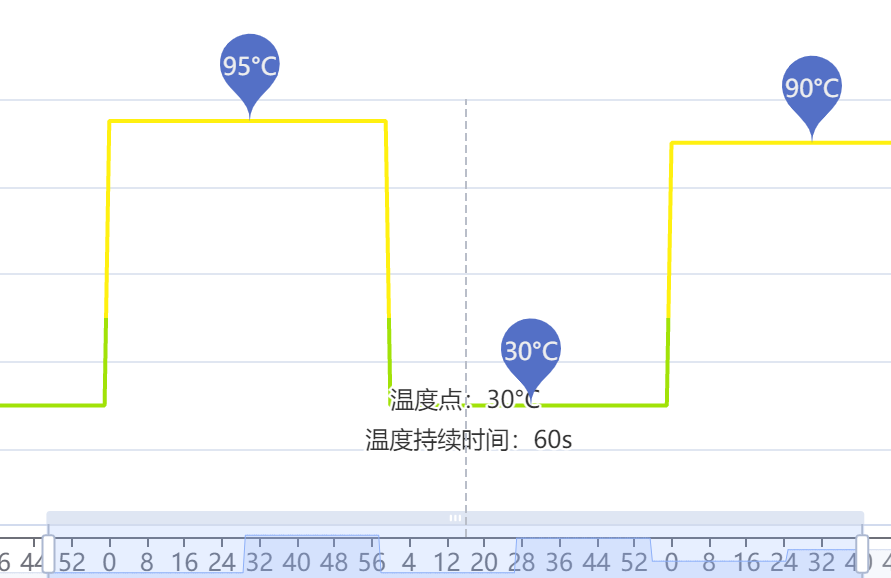
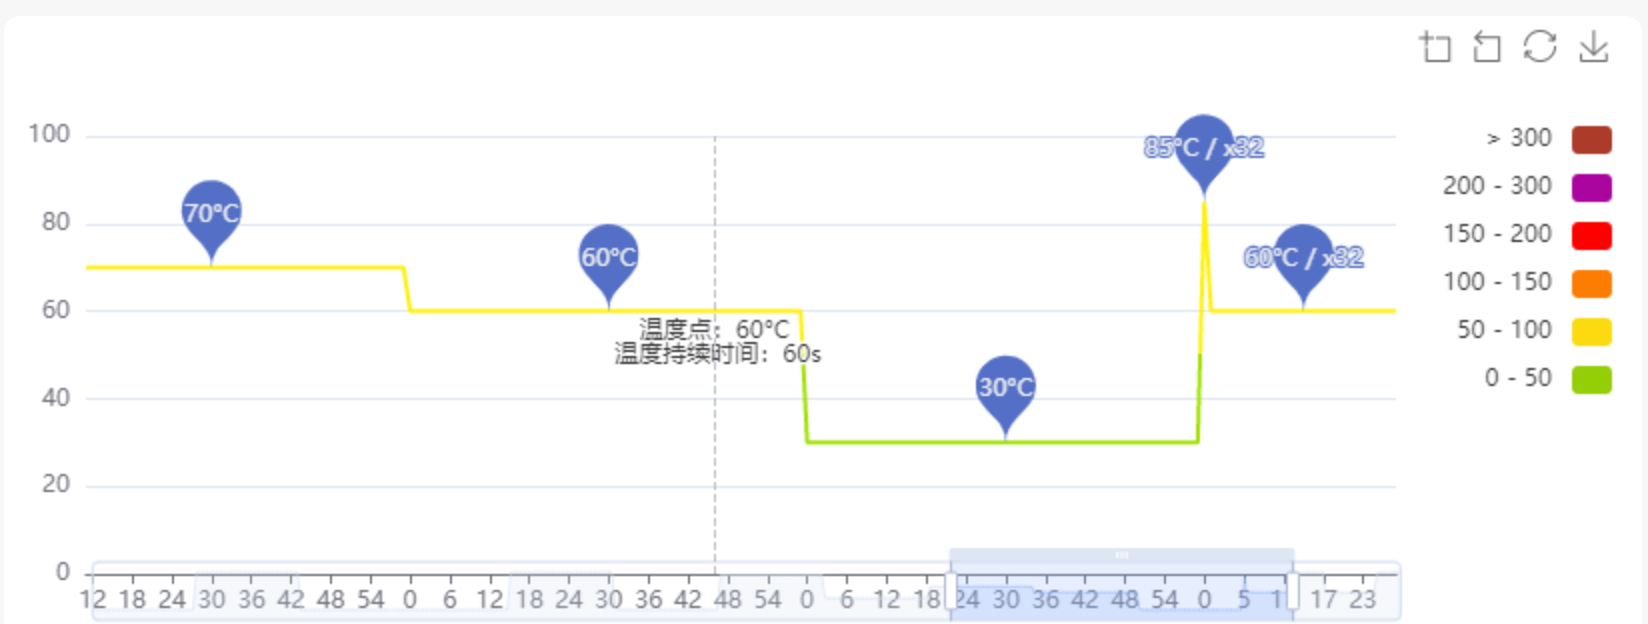
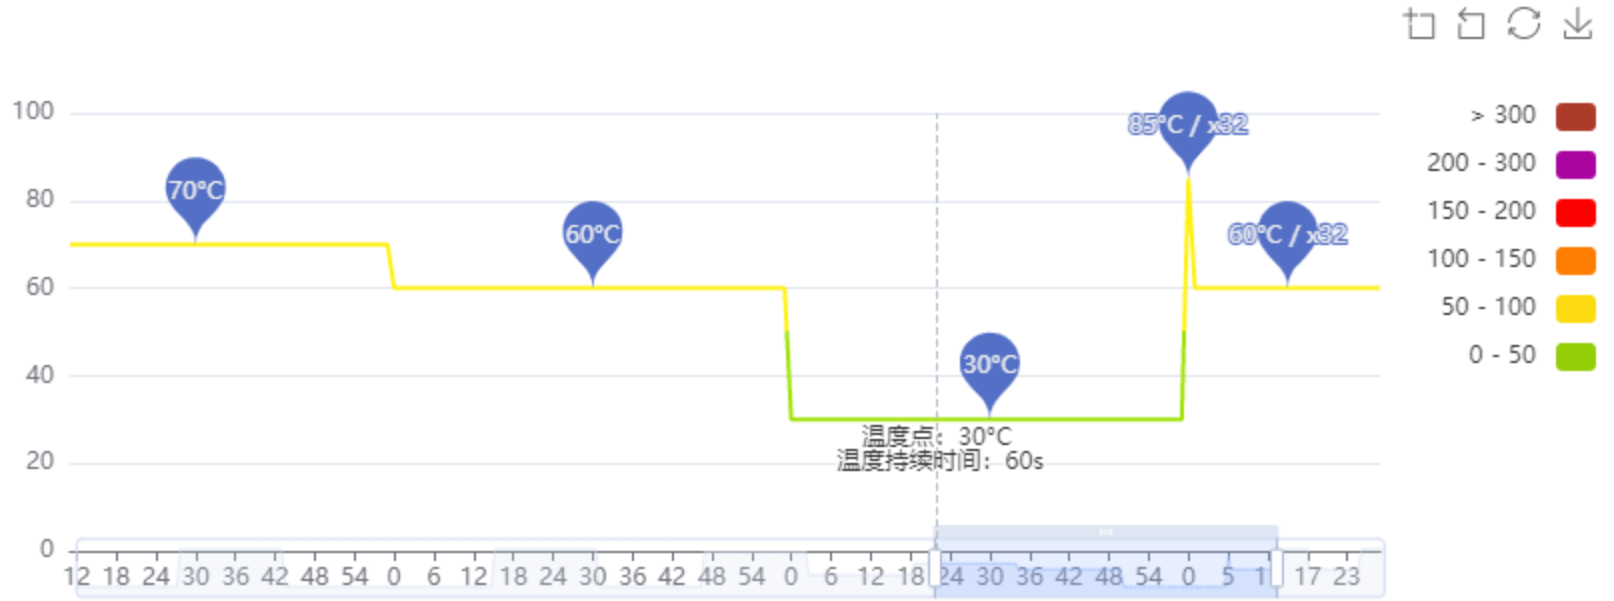
echarts 温度持续时间梯形折线图
效果图:
html:
<ChartDom :chart-option="option" :chart-style="chartStyle" />
js:

option: {
        tooltip: {
          trigger: 'axis',
          // show: false,
          formatter() {
            // let text = '';
            // text +=
            //       '<div  style="padding: 0 10px;">'+
            //         '<div> <span>温度值:</span>'+ params[0].value+' °C </div>'+
            //         '<div> <span>时间:</span>'+ params[0].axisValue+' s </div>'
            //       '</div>'
            // return text;
            return ''
          }
        },
        grid: {
          left: '5%',
          right: '15%',
          bottom: '10%'
        },
        xAxis: {
          boundaryGap: false,
          data: []
        },
        yAxis: {},
        toolbox: {
          right: 10,
          feature: {
            dataZoom: {
              yAxisIndex: 'none'
            },
            restore: {},
            saveAsImage: {}
          }
        },
        dataZoom: [
          {
            startValue: '2014-06-01'
          },
          {
            type: 'inside'
          }
        ],
        visualMap: {
          top: 50,
          right: 10,
          pieces: [
            {
              gt: 0,
              lte: 50,
              color: '#93CE07'
            },
            {
              gt: 50,
              lte: 100,
              color: '#FBDB0F'
            },
            {
              gt: 100,
              lte: 150,
              color: '#FC7D02'
            },
            {
              gt: 150,
              lte: 200,
              color: '#FD0100'
            },
            {
              gt: 200,
              lte: 300,
              color: '#AA069F'
            },
            {
              gt: 300,
              color: '#AC3B2A'
            }
          ],
          outOfRange: {
            color: '#999'
          }
        },
        series: {
          symbol: "none",
          type: 'line',
          data: [],
          label: {
            show: true,
            position: 'top',
            distance: -28,
            formatter: function(value) {
              if (value.data.type === '光学扩增程序') {
                return '温度点:'+ value.data.value + '°C / x32' + '\n 温度持续时间:' + value.data.time + 's';
              }
              return '温度点:'+ value.data.value + '°C' + '\n 温度持续时间:' + value.data.time + 's';
            },
          },
          markPoint: {
            symbol: 'pin',
            data: [
              { value: 30, xAxis: 30, yAxis: 30, type: '预热程序' },
              { value: 95, xAxis: 90, yAxis: 95, type: '预热程序' },
              { value: 30, xAxis: 180, yAxis: 30, type: '预热程序' },
              { value: 95, xAxis: 270, yAxis: 95, type: '温度控制程序' },
              { value: 30, xAxis: 330, yAxis: 30, type: '温度控制程序' },
              { value: 90, xAxis: 390, yAxis: 90, type: '温度控制程序' },
              { value: 50, xAxis: 450, yAxis: 50, type: '温度控制程序' },
              { value: 70, xAxis: 510, yAxis: 70, type: '温度控制程序' },
              { value: 60, xAxis: 570, yAxis: 60, type: '温度控制程序' },
              { value: 30, xAxis: 630, yAxis: 30, type: '温度控制程序' },
              { value: 85, xAxis: 660, yAxis: 85, type: '光学扩增程序' },
              { value: 60, xAxis: 675, yAxis: 60, type: '光学扩增程序' },
              { value: 95, xAxis: 697.5, yAxis: 95, type: '溶解曲线控制程序' },
              { value: 60, xAxis: 719.5, yAxis: 60, type: '溶解曲线控制程序' },
              { value: 95, xAxis: 741.5, yAxis: 95, type: '溶解曲线控制程序' }
            ],
            label: {
              // formatter: '{c}°C'
              formatter: function(value) {
                if (value.data.type === '光学扩增程序') {
                  return value.data.value + '°C / x32'
                  // let txt = '温度点:' + value.data.value + ' °C / x32 \n' + '温度持续时间:' + 77;
                  // return txt;
                }
                return value.data.value + '°C'
              }
            }
          }
        }
      },
      chartStyle: {
        width: '100%',
        height: `calc(100vh - 450px)`,
        backgroundColor: '#fff',
        borderRadius: '8px'
      },
methods:
generateData() {
      const dataList = [
        { time: 60, value: 30, type: '预热程序' },
        { time: 60, value: 95, type: '预热程序' },
        { time: 60, value: 30, type: '预热程序' },
        { time: 60, value: 30, type: '温度控制程序' },
        { time: 60, value: 95, type: '温度控制程序' },
        { time: 60, value: 30, type: '温度控制程序' },
        { time: 60, value: 90, type: '温度控制程序' },
        { time: 60, value: 50, type: '温度控制程序' },
        { time: 60, value: 70, type: '温度控制程序' },
        { time: 60, value: 60, type: '温度控制程序' },
        { time: 60, value: 30, type: '温度控制程序' },

        { time: 1, value: 85, type: '光学扩增程序' },
        { time: 30, value: 60, type: '光学扩增程序' },
        { time: 15, value: 95, type: '溶解曲线控制程序' },
        { time: 30, value: 60, type: '溶解曲线控制程序' },
        { time: 15, value: 95, type: '溶解曲线控制程序' },
      ];
      const data =[];
      dataList.map(({ time, value, type }) => {
        for(let i = 0; i < time; i++) {
          data.push([
            i,
            value,
            type,
            time
          ])
        }
      });
      this.option.xAxis.data = data.map(item => item[0])
      this.option.series.data = data.map(item => {
        return {
          value: item[1],
          type: item[2],
          time: item[3]
        }
      })
    },
展示效果:
echart参考:https://echarts.apache.org/examples/en/editor.html?c=line-aqi
记录自己的采坑之路,需要时方便查找

【推荐】编程新体验,更懂你的AI,立即体验豆包MarsCode编程助手
【推荐】凌霞软件回馈社区,博客园 & 1Panel & Halo 联合会员上线
【推荐】抖音旗下AI助手豆包,你的智能百科全书,全免费不限次数
【推荐】博客园社区专享云产品让利特惠,阿里云新客6.5折上折
【推荐】轻量又高性能的 SSH 工具 IShell:AI 加持,快人一步