吴恩达机器学习课后作业ex1
题目大体意思就是输入的是某地的人口,输出的是某地方的收益。
题目及数据集下载:
https://wwa.lanzous.com/b054sprza 密码:ba3w
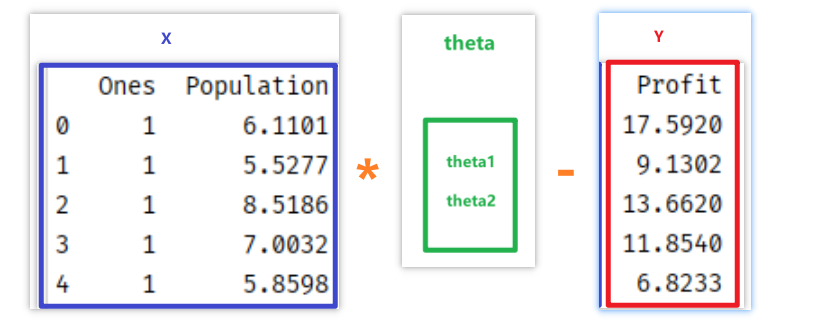
大体模型如下图:现在X前边加一列值为1的列,然后求解两个参数theta1和theta2,这样求解和y=kx+b,求k与b一样,只不过是通过下边这种方法求解,模型更有适应性,可以更适应其他相似的模型。

1.计算损失
1.1计算损失的公式:
\[loss={(X_{i1}\theta1+X_{i2}\theta2-Y_{i1})}^{2}
\]
# 计算损失
def computeLoss(x, y, theta):
    error=np.power(x.dot(theta) - y, 2)
    # print(error)
    return np.sum(error)/(2*len(X))
2.多变量梯度下降
2.1根据上边计算损失的公式求导得计算梯度的公式:
\[\frac{\partial{loss}}{\partial{\theta1}}=\frac{1}{N}\sum_{i=1}^{n}{(X_{i1}\theta1+X_{i2}\theta2-Y_{i1})}*X_{i1}
\]
\[\frac{\partial{loss}}{\partial{\theta2}}=\frac{1}{N}\sum_{i=1}^{n}{(X_{i1}\theta1+X_{i2}\theta2-Y_{i1})}*X_{i2}
\]
代码里边各个元素的含义:

error:红框
xj:蓝框
term:绿框
temp:紫框
# 多变量梯度下降
def gradient(x,y,theta,learningrate,iters):
    temp = np.zeros(theta.shape)    # [2,1]
    param = theta.size      # 要学习参数的个数,2

    for i in range(iters):
        error =  x @ theta - y  # 数学矩阵相乘,[97,2]@[2,1]=[97,1]
        for j in range(param):
            xj=x[:,j].reshape(np.shape(x)[0],1)    # 取X的第j列,[97,1]
            term = error*xj                        # 对应元素相乘,[97,1]*[97,1]=[97,1]
            temp[j,0]=theta[j,0]-learningrate*np.sum(term)/len(x)   # 计算所有的损失和
        theta = temp
    return theta
最后的总代码:
import numpy as np
import pandas as pd
import matplotlib.pyplot as plt


lr=0.01         # 训练速率
Iters = 5000    # 训练次数

# 计算损失
def computeLoss(x, y, theta):
    loss=np.power(x.dot(theta) - y, 2)
    return np.sum(loss)/(2*len(X))

# 多变量梯度下降
def gradient(x,y,theta,learningrate,iters):
    temp = np.zeros(theta.shape)    # [2,1]
    param = theta.size      # 要学习参数的个数,2

    for i in range(iters):
        error =  x @ theta - y  # 数学矩阵相乘,[97,2]@[2,1]=[97,1]
        for j in range(param):
            xj=x[:,j].reshape(np.shape(x)[0],1)    # 取X的第j列,[97,1]
            term = error*xj                        # 对应元素相乘,[97,1]*[97,1]=[97,1]
            temp[j,0]=theta[j,0]-learningrate*np.sum(term)/len(x)   # 计算所有的损失和
        theta = temp
    return theta


if __name__ == '__main__':
    # 1.1先拿到数据
    path='ex1data1.txt'
    data=pd.read_csv(path,header=None,names=['Population','Profit'])

    # 1.2看一下数据大体什么样子
    print(data.head())
    print(data.describe())

    # 1.3进行数据处理,在数据第0列前边加一列
    data.insert(0,'Ones',1)
    print(data.head())

    # 1.4将X和Y分开,
    cols=data.shape[1]
    X=data.iloc[:,0:cols-1]
    Y=data.iloc[:,cols-1:]
    print(X.head())
    print(Y.head())

    # 1.5将数据转换成numpy格式
    X=np.array(X)
    Y=np.array(Y)
    # 创建要训练的参数,并设置成两行一列向量
    theta=np.array([1,1]).reshape([2,1])

    # 1.6再看一下数据的各个形状
    print(X.shape,Y.shape,theta.shape)
    print(theta)


    # 2.计算损失
    print(computeLoss(X,Y,theta))

    # 3.优化损失
    theta=gradient(X,Y,theta,lr,Iters)
    print(theta)
    print(computeLoss(X,Y,theta))
    # 求得最后的损失为4.476971407448775
    # 求得theta1和theta2为[-3.8951929 , 1.19297458]

    # 4.用plt绘制一下最后的图形
    # 绘制直线
    x = np.arange(5, 22.5)
    y = theta[0]+x*theta[1]
    plt.plot(x, y)
    # 绘制散点
    plt.scatter(X[:,1], Y)
    plt.show()

