二进制安装promethues+节点监控+网站监控+邮件报警+监控拓展
一,二进制安装prometheus
官方下载二进制
https://prometheus.io/download/
1,prometheus-2.30.3.linux-amd64.tar.gz
root@pro182:/apps# ln -sv /apps/prometheus-2.30.3.linux-amd64 /apps/prometheus
root@pro182:/apps/prometheus# cat /lib/systemd/system/prometheus.service
[Unit]
Description=Monitoring system and time series database
Documentation=https://prometheus.io/docs/introduction/overview/

[Service]
Restart=always
WorkingDirectory=/apps/prometheus
ExecStart=/apps/prometheus/prometheus
--config.file=/apps/prometheus/prometheus.yml

[Install]
WantedBy=multi-user.target
systemctl status prometheus.service
192.168.192.182:9090/metrics
root@pro182:/apps/prometheus# du -sh data/ #数据目录
process_max_fds
二,节点监控
node_exporter-1.2.2.linux-amd64.tar.gz
root@master001:/apps# ln -sv node_exporter-1.2.2.linux-amd64 node_exporter
root@master001:/apps/node_exporter# cat /lib/systemd/system/node_exporter.service
[Unit]
Description=node_exporter
After=network.target

[Service]
ExecStart=/apps/node_exporter/node_exporter --web.listen-address=":9100"

[Install]
WantedBy=multi-user.target
root@slave002:/apps/node_exporter# systemctl start node_exporter.service
root@slave002:/apps/node_exporter# systemctl enable node_exporter.service
192.168.192.153:9100/metrics
root@pro182:/apps/prometheus# ./promtool check config prometheus.yml
Checking prometheus.yml
  SUCCESS: 0 rule files found
root@pro182:/apps/prometheus# cat prometheus.yml
  - job_name: "node_exporter"

    # metrics_path defaults to '/metrics'
    # scheme defaults to 'http'.

    static_configs:
      - targets: ["192.168.192.151:9100","192.168.192.152:9100","192.168.192.153:9100"]

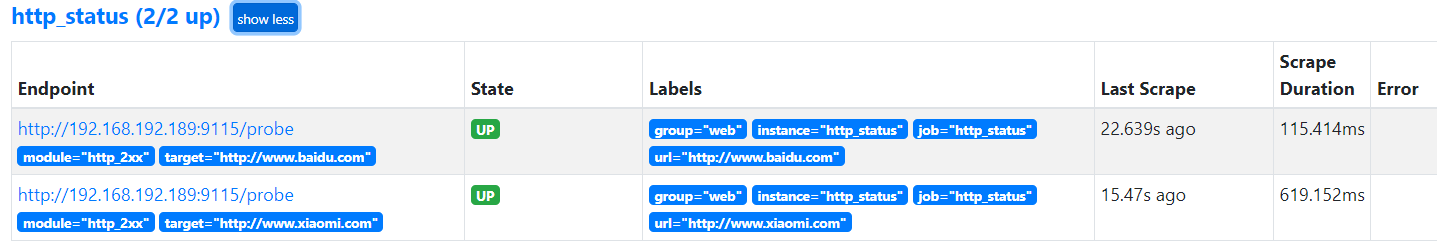
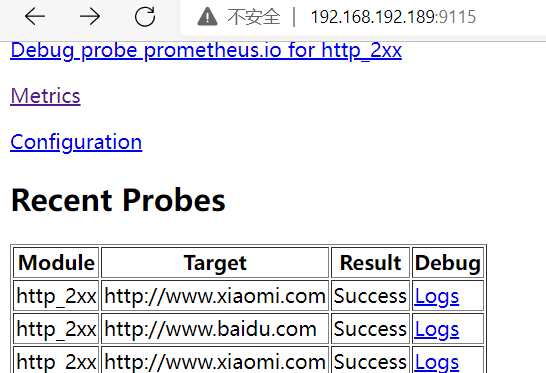
三,blackbox_exporter监控网站
root@ceph-teamplate:/apps/blackbox_exporter# cat  /lib/systemd/system/blackbox_exporter.service
[Unit]
Description=blackbox_exporter
After=network.target

[Service]
Type=simple
user=root
group=root
ExecStart=/apps/blackbox_exporter/blackbox_exporter \
    --config.file=/apps/blackbox_exporter/blackbox.yml \
    --web.listen-address=:9115
Restart=on-failure

[Install]
WantedBy=multi-user.target
root@189:/apps/blackbox_exporter# systemctl daemon-reload
root@189:/apps/blackbox_exporter# systemctl restart blackbox_exporter.service
root@pro182:/apps/prometheus# cat  prometheus.yml
#网站监控
  - job_name: 'http_status'
    metrics_path: /probe
    params:
      module: [http_2xx]
    static_configs:
      - targets: ['http://www.baidu.com', 'http://www.xiaomi.com']
        labels:
          instance: http_status
          group: web
    relabel_configs:
      - source_labels: [__address__]
        target_label: __param_target
      - source_labels: [__param_target]
        target_label: url
      - target_label: __address__
        replacement: 192.168.192.189:9115
    relabel_configs:
      - source_labels: [__address__]    #relabel通过__address__(当前目标地址)写入__param_target标签来创建一个label
        target_label: __param_target    #监控目标与www.baidu.com,作为__address__的value
      - source_labels: [__param_target] #监控目标
        target_label: url               #将监控目标与url创建一个label
#端口监控
  - job_name: 'port_status'
    metrics_path: /probe
    params:
      module: [tcp_connect]
    static_configs:
      - targets: ['192.168.192.151:6443', '192.168.192.152:6443']
        labels:
          instance: port_status
          group: port
    relabel_configs:
      - source_labels: [__address__]
        target_label: __param_target
      - source_labels: [__param_target]
        target_label: url
      - target_label: __address__
        replacement: 192.168.192.189:9115
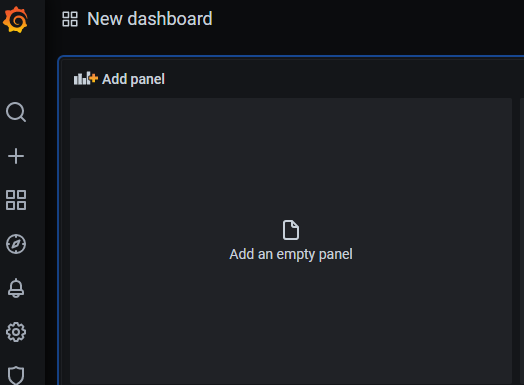
4,grafana展示
https://grafana.com/grafana/download/7.5.11?edition=oss
root@pro182:~# sudo dpkg -i grafana_7.5.11_amd64.deb
root@pro182:~# systemctl status grafana-server.service
root@pro182:~# lsof -i:3000
root@pro182:~# vi /etc/grafana/grafana.ini


8919
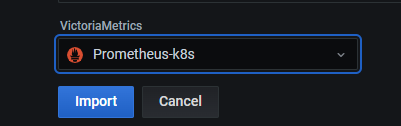

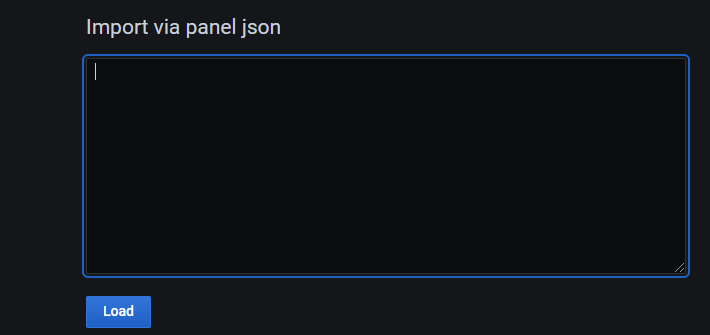
下载到本地
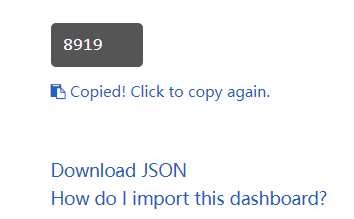
复制json文件内容导入
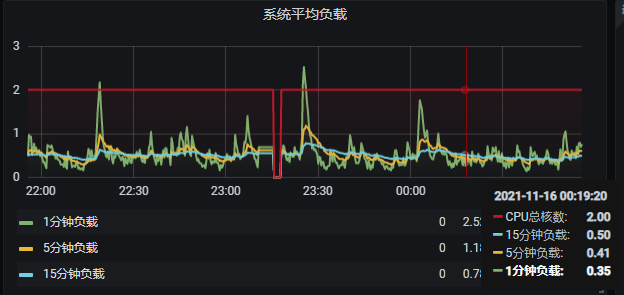
5,PromQl+展示一个指标
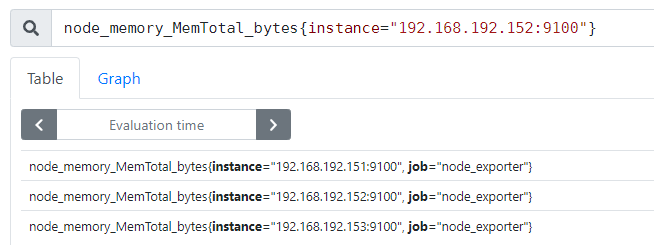
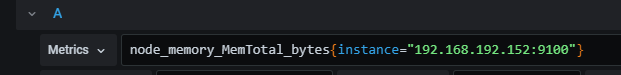
node_filesystem_free_bytes{instance="192.168.192.152:9100",device="/dev/sda2"}
node_load15
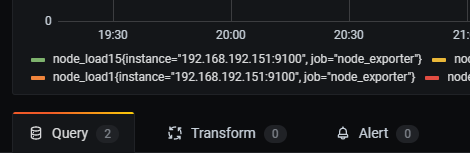
选中一台点击展示想看那一台的负载
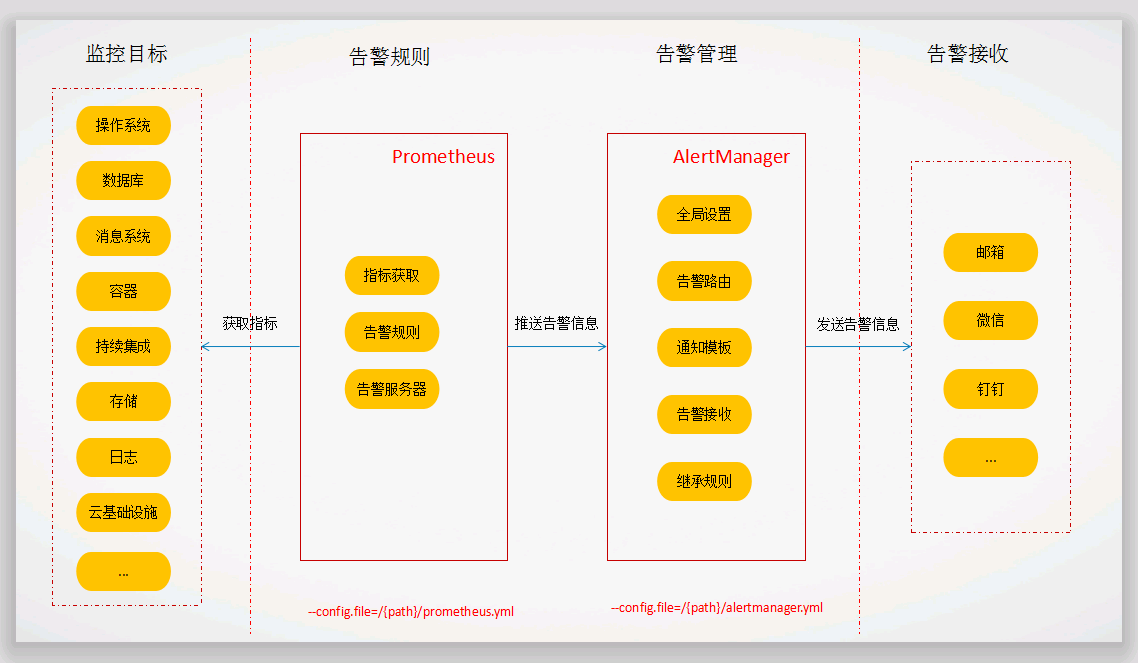
四,Prometheus+alertmanage配置邮件报警
官方下载编译安装
https://github.com/prometheus/alertmanager/releases/download/v0.23.0/alertmanager-0.23.0.linux-amd64.tar.gz
root@ceph-teamplate:/apps# cat /lib/systemd/system/alertmanager.service
[Unit]
Description=alertmanager
After=network.target

[Service]
ExecStart=/apps/alertmanager/alertmanager
WorkingDirectory=/apps/alertmanager
Restart=on-failure

[Install]
WantedBy=multi-user.target
进入解压后的alertmanager文件夹,修改alertmanager.yml文件,配置报警信息,alertmanager.yml 内容如下:
root@blackbox_exporter-189:/apps/alertmanager# cat alertmanager.yml
global:
  resolve_timeout: 5m
  smtp_from: '8147x@qq.com'   #用于发送邮件的邮箱
  smtp_smarthost: 'smtp.qq.com:465'
  smtp_auth_username: '8147x@qq.com'   #邮箱地址
  smtp_auth_password: 'xxxx'    #邮箱授权密码
  smtp_require_tls: false
  smtp_hello: 'qq.com'
route:   #设置报警分发策略
  group_by: ['alertname']  #分组标签
  group_wait: 8s    #告警等待时间,告警产生后等待8s,如果有相同告警一起发出
  group_interval: 3s  #两组告警间隔时间
  repeat_interval: 2m  #重复告警的间隔时间,减少相同邮件发送频率,此处测试设置为2分钟
  receiver: 'email'    #默认接收者  #routes: #指定哪些组可以接受消息  #- receiver: mail
receivers:
- name: 'email'
  email_configs:
  - to: '8147x@qq.com'  接受报警邮箱地址
    send_resolved: true
#inhibit_rules:
#  - source_match:
#      severity: 'critical'
#    target_match:
#      severity: 'warning'
#    equal: ['alertname', 'dev', 'instance']
检查alertmanager.yml 配置是否正确
root@blackbox_exporter-189:/apps/alertmanager# ./amtool check-config alertmanager.yml
Checking 'alertmanager.yml'  SUCCESS
Found:
 - global config
 - route
 - 0 inhibit rules
 - 1 receivers
 - 0 templates
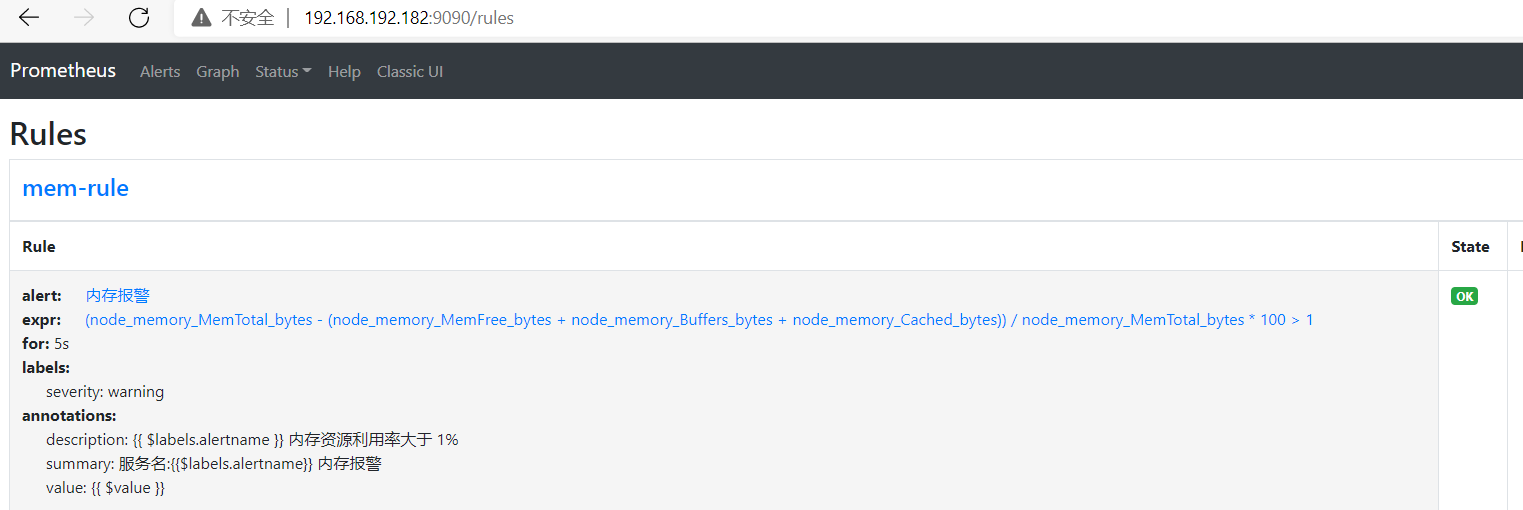
浏览器访问: http://192.168.192.182:9090/rules:9093 (IP:9093)
进入Prometheus的安装目录下修改Prometheus配置,取消alertmanager有关注释
root@pro182:/apps/prometheus# cat prometheus.yml
# Alertmanager configuration
alerting:
  alertmanagers:
    - static_configs:
        - targets:
          - 192.168.192.189:9093

# Load rules once and periodically evaluate them according to the global 'evaluation_interval'.
rule_files:
  - "/apps/prometheus/*.yaml"  #配置告警规则
  # - "first_rules.yml"
  # - "second_rules.yml"
编写告警规则文件rule.yml
(此处用于测试,设置为当内存占用高于1%时,就会告警)
root@pro182:/apps/prometheus# cat neicun.yaml
groups:
- name: mem-rule
  rules:
  - alert: "内存报警"
    expr: (node_memory_MemTotal_bytes - (node_memory_MemFree_bytes+node_memory_Buffers_bytes+node_memory_Cached_bytes )) / node_memory_MemTotal_bytes * 100 > 1
    for: 5s
    labels:
      severity: warning
    annotations:
      summary: "服务名:{{$labels.alertname}} 内存报警"
      description: "{{ $labels.alertname }} 内存资源利用率大于 1%"
      value: "{{ $value }}"
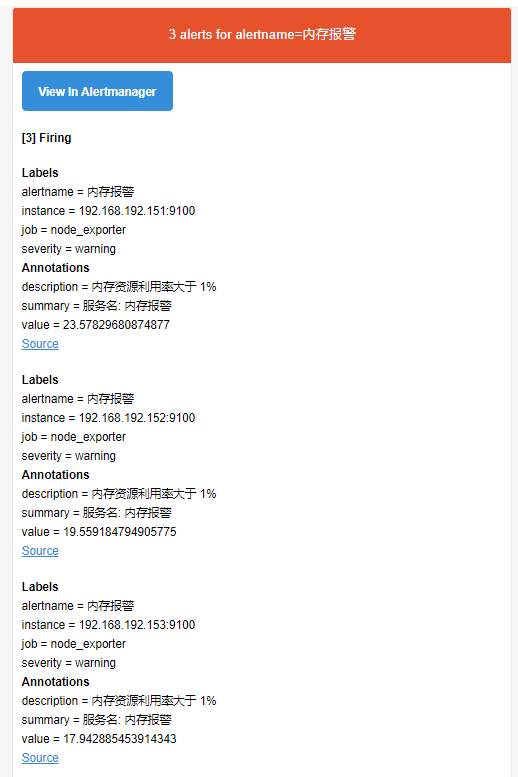
浏览器访问 http://192.168.192.189:9093/#/alerts ,也能看到告警信息
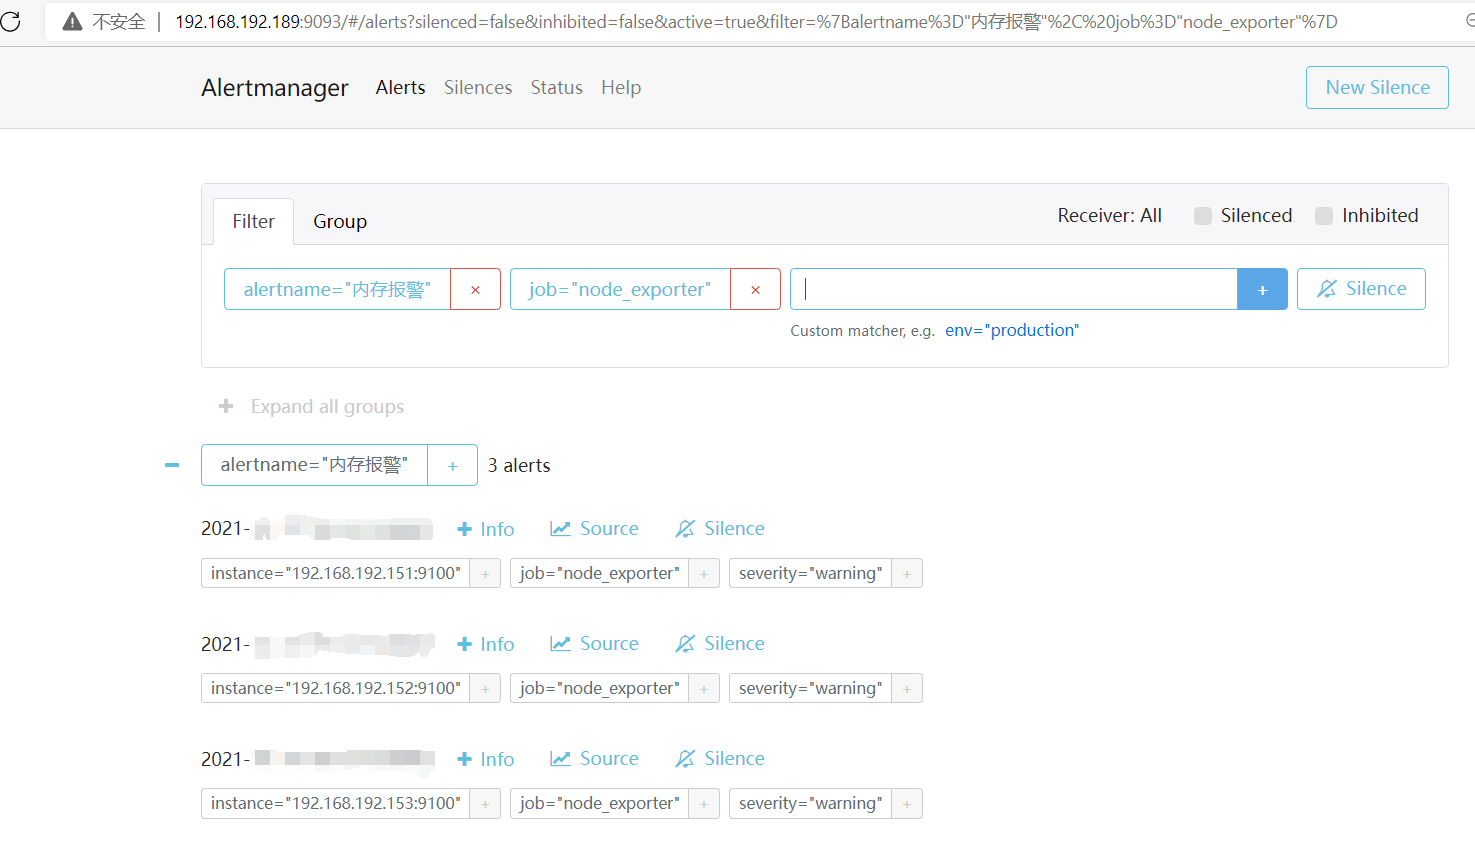
root@pro182:/apps/prometheus# cat neicun.yaml
groups:
- name: mem-rule
  rules:
  - alert: "内存报警"
    expr: (node_memory_MemTotal_bytes - (node_memory_MemFree_bytes+node_memory_Buffers_bytes+node_memory_Cached_bytes )) / node_memory_MemTotal_bytes * 100 > 1
    for: 2m
    labels:
      severity: warning
    annotations:
      summary: "服务名:{{$labels.alertname}} 内存报警"
      description: "{{ $labels.alertname }} 内存资源利用率大于 1%"
      value: "{{ $value }}"
  - alert: Pod_all_cpu_usage
    expr: (sum by(name)(rate(container_cpu_usage_seconds_total{image!=""}[5m]))*100) > 1
    for: 2m
    labels:
      severity: critical
      service: pods
    annotations:
      description: 容器 {{ $labels.name }} CPU 资源利用率大于 10% , (current value is {{ $value }})
      summary: Dev CPU 负载告警
  - alert: Pod_all_memory_usage
    expr: sort_desc(avg by(name)(irate(container_memory_usage_bytes{name!=""}[5m]))*100) > 10  #pod
    for: 2m
    labels:
      severity: critical
    annotations:
      description: 容器 {{ $labels.name }} Memory 资源利用率大于 2G , (current value is {{ $value }})
      summary: Dev Memory 负载告警
  - alert: Pod_all_network_receive_usage
    expr: sum by (name)(irate(container_network_receive_bytes_total{container_name="POD"}[1m])) > 1024*1024*50
    for: 2m
    labels:
      severity: critical
    annotations:
      description: 容器 {{ $labels.name }} network_receive 资源利用率大于 50M , (current value is {{ $value }})
五,监控mysql8.0
mysql单库搭建
https://downloads.mysql.com/archives/community/mysql-8.0.20-linux-glibc2.12-x86_64.tar.xz
https://downloads.mysql.com/archives/shell/mysql-shell-8.0.20-linux-glibc2.12-x86-64bit.tar.gz
MySQL的安装配置
上传并解压软件
cd /usr/local
[root@mysql-132]# tar xf mysql-8.0.20-linux-glibc2.12-x86_64.ta
软连接
ln -sv mysql-8.0.20-linux-glibc2.12-x86_64 mysql
[root@db01 local]# mv mysql-8.0.20-linux-glibc2.12-x86_64 mysq
环境变量
[root@db01 bin]# vim /etc/profile
export PATH=/usr/local/mysql/bin:$PATH
生效配置
source /etc/profile
[root@db01 bin]# mysql -V
mysql Ver 8.0.20 for Linux on x86_64 (MySQL Community Server - GPL)
创建用户
[root@db01 bin]# useradd mysql
创建所需目录
[root@db01 ~]# mkdir -p /data/3306/data
[root@db01 ~]# chown -R mysql.mysql /data
数据初始化
[root@db01 ~]# mv /etc/my.cnf /tmp
[root@db01 ~]# mysqld --initialize-insecure --user=mysql --basedir=/usr/local/mysql --datadir=/data/3306/data
配置文件
[root@mysql-191 ~]# vim /etc/my.cnf

[mysql]
socket=/tmp/mysql.sock
[mysqld]
server_id=100
port=3306
user=mysql
basedir=/usr/local/mysql
datadir=/data/3306/data
socket=/tmp/mysql.sock
准备启动脚本
[root@db01 ~]# cd /usr/local/mysql/support-files/
[root@db01 support-files]# cp mysql.server /etc/init.d/mysqld
[root@db01 support-files]# /etc/init.d/mysqld start
Starting MySQL.Logging to '/data/3306/data/db01.err'.
. SUCCESS!
修改root密码
mysql> alter user root@'localhost' identified with mysql_native_password by '123';
使用mysqld_exporter监控
mysqld_exporter-0.13.0.linux-amd64.tar.gz
192.168.192.182 prometheus
192.168.192.132 mysql mysqld_exporter
在132 MySQL里配置MySQL监控账号
CREATE USER 'mysql_monitor'@'localhost' identified by 'mysql_monitor';
mysql> GRANT REPLICATION CLIENT, PROCESS ON *.* TO 'mysql_monitor'@'localhost';
Query OK, 0 rows affected (0.00 sec)

mysql> GRANT SELECT ON performance_schema.* TO 'mysql_monitor'@'localhost';
Query OK, 0 rows affected (0.00 sec)
[root@mysql-132 mysqld_exporter]# cat my.cnf
[client]
port=3306
user=mysql_monitor
password=mysql_monitor
[root@mysql-132 mysqld_exporter]# nohup ./mysqld_exporter --config.my-cnf=my.cnf &
182节点
#mysql监控
  - job_name: 'mysql'
    static_configs:
    - targets: ['192.168.192.132:9104']
      labels:
          instance: '192.168.192.132'
Grafana id= 7362
https://grafana.com/grafana/dashboards/7362
下载mysql模板并导入
mysql监控页面

六 监控tomcat
root@master001:~/prometheus/prometheus-case-files/prometheus-files/case/app-monitor-case/tomcat/tomcat-image# cat Dockerfile
FROM tomcat:8.5.73
ADD server.xml /usr/local/tomcat/conf/server.xml
RUN mkdir /data/tomcat/webapps -p
ADD myapp /data/tomcat/webapps/myapp
ADD metrics.war /data/tomcat/webapps
ADD simpleclient-0.8.0.jar  /usr/local/tomcat/lib/
ADD simpleclient_common-0.8.0.jar /usr/local/tomcat/lib/
ADD simpleclient_hotspot-0.8.0.jar /usr/local/tomcat/lib/
ADD simpleclient_servlet-0.8.0.jar /usr/local/tomcat/lib/
ADD tomcat_exporter_client-0.0.12.jar /usr/local/tomcat/lib/
#ADD run_tomcat.sh /apps/tomcat/bin/
EXPOSE 8080 8443 8009
#CMD ["/apps/tomcat/bin/catalina.sh","run"]
#CMD ["/apps/tomcat/bin/run_tomcat.sh"]
root@master001:~/prometheus/prometheus-case-files/prometheus-files/case/app-monitor-case/tomcat/yaml# cat tomcat-deploy.yaml
apiVersion: apps/v1
kind: Deployment
metadata:
  name: tomcat-deployment
  namespace: default
spec:
  selector:
    matchLabels:
     app: tomcat
  replicas: 1 # tells deployment to run 2 pods matching the template
  template: # create pods using pod definition in this template
    metadata:
      labels:
        app: tomcat
      annotations:
        prometheus.io/scrape: 'true'
    spec:
      containers:
      - name: tomcat
        image: 192.168.192.155:80/magedu/tomcat-app1:v33
        ports:
        - containerPort: 8080
        securityContext:
          privileged: true
root@master001:~/prometheus/prometheus-case-files/prometheus-files/case/app-monitor-case/tomcat/yaml# cat tomcat-svc.yaml
kind: Service  #service 类型
apiVersion: v1
metadata:
#  annotations:
#    prometheus.io/scrape: 'true'
  name: tomcat-service
spec:
  selector:
    app: tomcat
  ports:
  - nodePort: 31080
    port: 80
    protocol: TCP
    targetPort: 8080
  type: NodePort
root@master001:~/prometheus/prometheus-case-files/prometheus-files/case/app-monitor-case/tomcat/tomcat-image# cat server.xml <?xml version="1.0" encoding="UTF-8"?> <!-- Licensed to the Apache Software Foundation (ASF) under one or more contributor license agreements. See the NOTICE file distributed with this work for additional information regarding copyright ownership. The ASF licenses this file to You under the Apache License, Version 2.0 (the "License"); you may not use this file except in compliance with the License. You may obtain a copy of the License at http://www.apache.org/licenses/LICENSE-2.0 Unless required by applicable law or agreed to in writing, software distributed under the License is distributed on an "AS IS" BASIS, WITHOUT WARRANTIES OR CONDITIONS OF ANY KIND, either express or implied. See the License for the specific language governing permissions and limitations under the License. --> <!-- Note: A "Server" is not itself a "Container", so you may not define subcomponents such as "Valves" at this level. Documentation at /docs/config/server.html --> <Server port="8005" shutdown="SHUTDOWN"> <Listener className="org.apache.catalina.startup.VersionLoggerListener" /> <!-- Security listener. Documentation at /docs/config/listeners.html <Listener className="org.apache.catalina.security.SecurityListener" /> --> <!--APR library loader. Documentation at /docs/apr.html --> <Listener className="org.apache.catalina.core.AprLifecycleListener" SSLEngine="on" /> <!-- Prevent memory leaks due to use of particular java/javax APIs--> <Listener className="org.apache.catalina.core.JreMemoryLeakPreventionListener" /> <Listener className="org.apache.catalina.mbeans.GlobalResourcesLifecycleListener" /> <Listener className="org.apache.catalina.core.ThreadLocalLeakPreventionListener" /> <!-- Global JNDI resources Documentation at /docs/jndi-resources-howto.html --> <GlobalNamingResources> <!-- Editable user database that can also be used by UserDatabaseRealm to authenticate users --> <Resource name="UserDatabase" auth="Container" type="org.apache.catalina.UserDatabase" description="User database that can be updated and saved" factory="org.apache.catalina.users.MemoryUserDatabaseFactory" pathname="conf/tomcat-users.xml" /> </GlobalNamingResources> <!-- A "Service" is a collection of one or more "Connectors" that share a single "Container" Note: A "Service" is not itself a "Container", so you may not define subcomponents such as "Valves" at this level. Documentation at /docs/config/service.html --> <Service name="Catalina"> <!--The connectors can use a shared executor, you can define one or more named thread pools--> <!-- <Executor name="tomcatThreadPool" namePrefix="catalina-exec-" maxThreads="150" minSpareThreads="4"/> --> <!-- A "Connector" represents an endpoint by which requests are received and responses are returned. Documentation at : Java HTTP Connector: /docs/config/http.html Java AJP Connector: /docs/config/ajp.html APR (HTTP/AJP) Connector: /docs/apr.html Define a non-SSL/TLS HTTP/1.1 Connector on port 8080 --> <Connector port="8080" protocol="HTTP/1.1" connectionTimeout="20000" redirectPort="8443" /> <!-- A "Connector" using the shared thread pool--> <!-- <Connector executor="tomcatThreadPool" port="8080" protocol="HTTP/1.1" connectionTimeout="20000" redirectPort="8443" /> --> <!-- Define an SSL/TLS HTTP/1.1 Connector on port 8443 This connector uses the NIO implementation. The default SSLImplementation will depend on the presence of the APR/native library and the useOpenSSL attribute of the AprLifecycleListener. Either JSSE or OpenSSL style configuration may be used regardless of the SSLImplementation selected. JSSE style configuration is used below. --> <!-- <Connector port="8443" protocol="org.apache.coyote.http11.Http11NioProtocol" maxThreads="150" SSLEnabled="true"> <SSLHostConfig> <Certificate certificateKeystoreFile="conf/localhost-rsa.jks" type="RSA" /> </SSLHostConfig> </Connector> --> <!-- Define an SSL/TLS HTTP/1.1 Connector on port 8443 with HTTP/2 This connector uses the APR/native implementation which always uses OpenSSL for TLS. Either JSSE or OpenSSL style configuration may be used. OpenSSL style configuration is used below. --> <!-- <Connector port="8443" protocol="org.apache.coyote.http11.Http11AprProtocol" maxThreads="150" SSLEnabled="true" > <UpgradeProtocol className="org.apache.coyote.http2.Http2Protocol" /> <SSLHostConfig> <Certificate certificateKeyFile="conf/localhost-rsa-key.pem" certificateFile="conf/localhost-rsa-cert.pem" certificateChainFile="conf/localhost-rsa-chain.pem" type="RSA" /> </SSLHostConfig> </Connector> --> <!-- Define an AJP 1.3 Connector on port 8009 --> <!-- <Connector protocol="AJP/1.3" address="::1" port="8009" redirectPort="8443" /> --> <!-- An Engine represents the entry point (within Catalina) that processes every request. The Engine implementation for Tomcat stand alone analyzes the HTTP headers included with the request, and passes them on to the appropriate Host (virtual host). Documentation at /docs/config/engine.html --> <!-- You should set jvmRoute to support load-balancing via AJP ie : <Engine name="Catalina" defaultHost="localhost" jvmRoute="jvm1"> --> <Engine name="Catalina" defaultHost="localhost"> <!--For clustering, please take a look at documentation at: /docs/cluster-howto.html (simple how to) /docs/config/cluster.html (reference documentation) --> <!-- <Cluster className="org.apache.catalina.ha.tcp.SimpleTcpCluster"/> --> <!-- Use the LockOutRealm to prevent attempts to guess user passwords via a brute-force attack --> <Realm className="org.apache.catalina.realm.LockOutRealm"> <!-- This Realm uses the UserDatabase configured in the global JNDI resources under the key "UserDatabase". Any edits that are performed against this UserDatabase are immediately available for use by the Realm. --> <Realm className="org.apache.catalina.realm.UserDatabaseRealm" resourceName="UserDatabase"/> </Realm> <Host name="localhost" appBase="/data/tomcat/webapps" unpackWARs="false" autoDeploy="false"> <!-- SingleSignOn valve, share authentication between web applications Documentation at: /docs/config/valve.html --> <!-- <Valve className="org.apache.catalina.authenticator.SingleSignOn" /> --> <!-- Access log processes all example. Documentation at: /docs/config/valve.html Note: The pattern used is equivalent to using pattern="common" --> <Valve className="org.apache.catalina.valves.AccessLogValve" directory="logs" prefix="localhost_access_log" suffix=".txt" pattern="%h %l %u %t "%r" %s %b" /> </Host> </Engine> </Service> </Server>
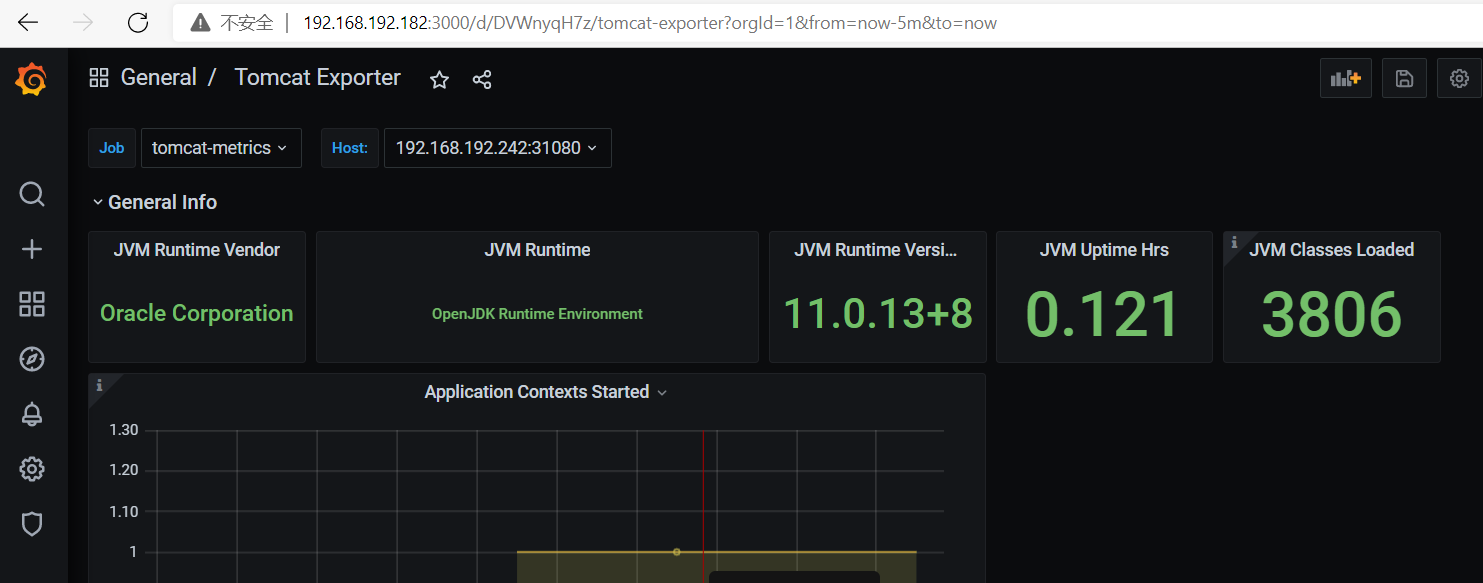
监控活跃连接数,堆栈内存 192.168.192.241:31080/metrics/
tomcat_connections_active_total{name="http-nio-8080",} 3.0
jvm_memory_bytes_used{area="heap",} 1.415424E7
  - job_name: "tomcat"
    static_configs:
      - targets: ["192.168.192.241:31080"]
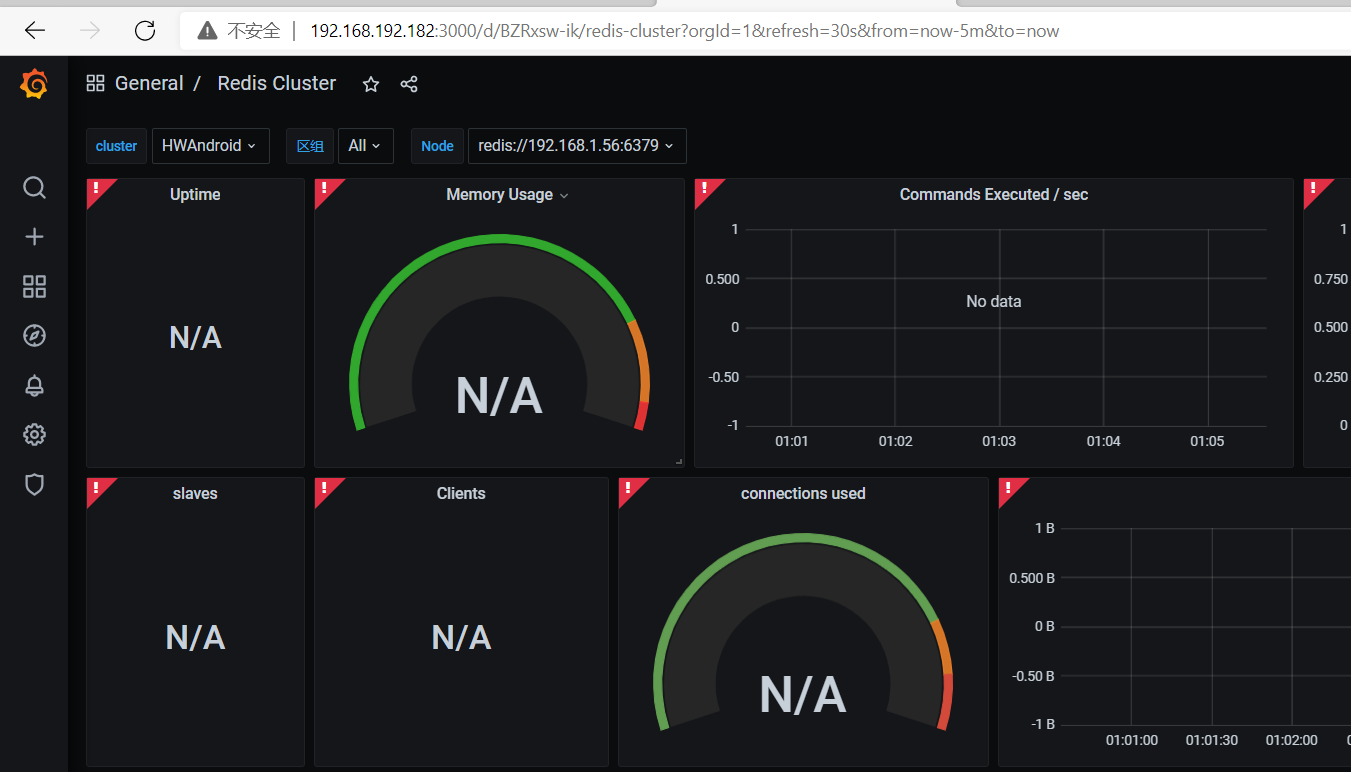
监控redis
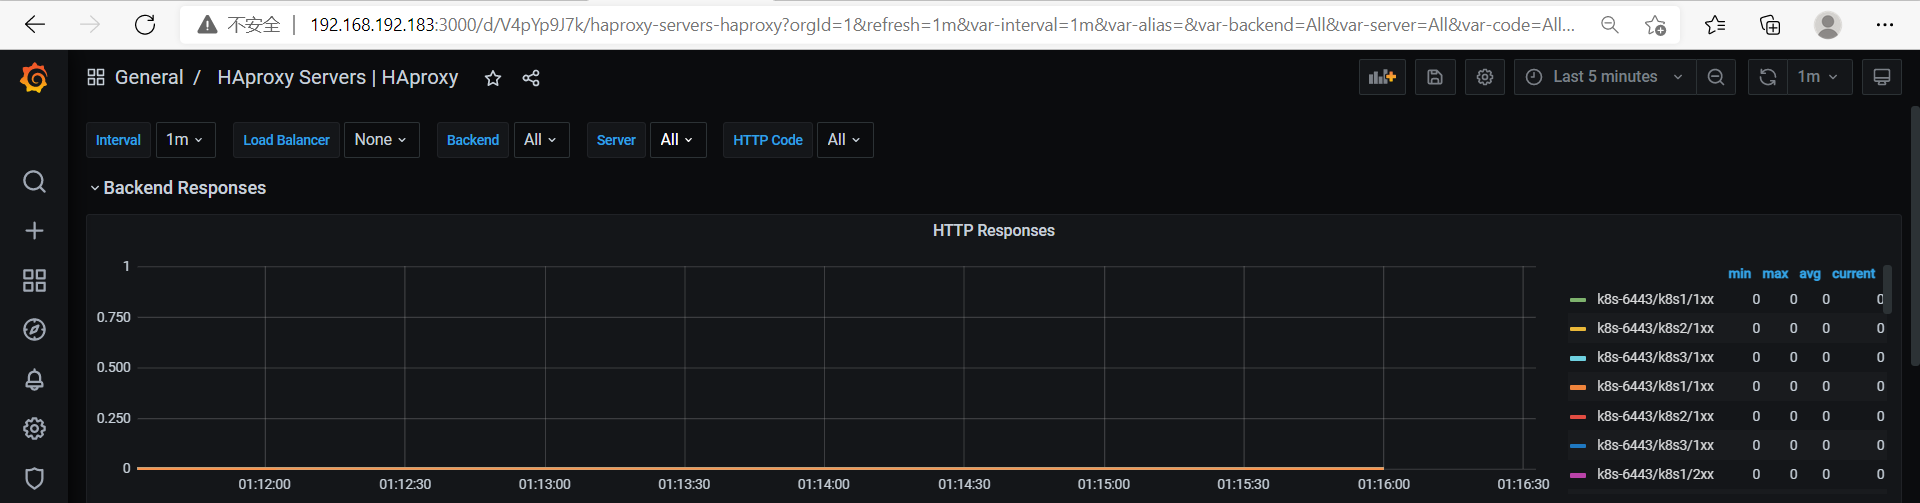
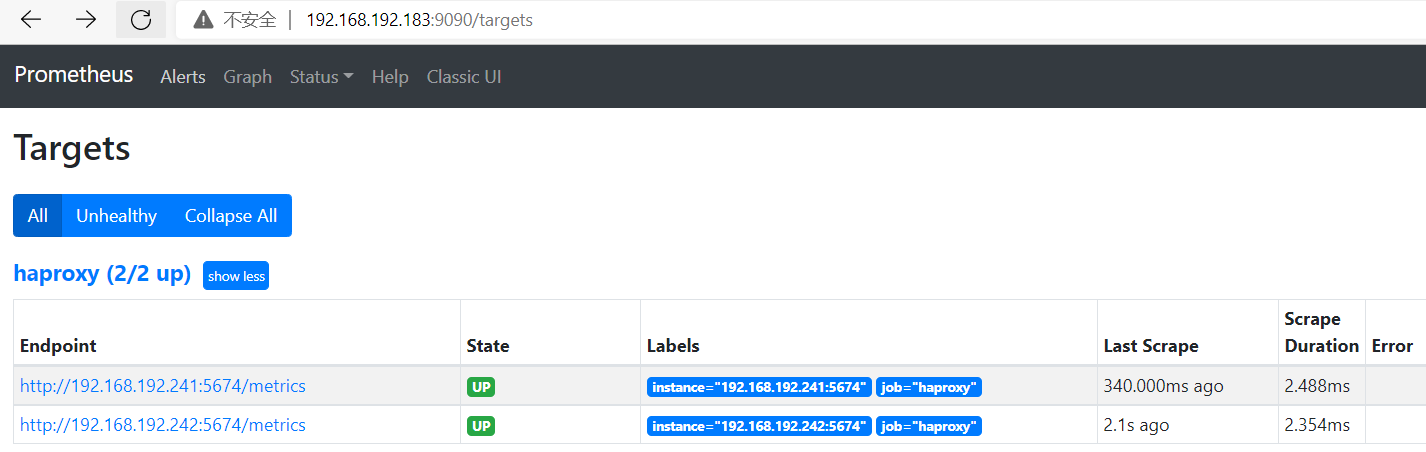
监控haproxy
开启状态页
listen  admin_stat
        #haproxy的web管理端口 8888,自行设置
        bind 0.0.0.0:8888
        mode    http
        stats   refresh 30s
        #haproxy web管理url,自行设置
        stats uri /haproxy_stats
        stats realm Haproxy\ Statistics
        #haproxy web管理用户名密码,自行设置
        stats auth admin:admin
        stats hide-version

root@master001:/apps/haproxy_exporter-0.12.0.linux-amd64# ## ./haproxy_exporter --web.listen-address=":5674" --haproxy.scrape-uri="http://admin:admin@ipaddress:8888/haproxy_stats;csv" &
  - job_name: 'haproxy'
    static_configs:
     - targets: ['192.168.192.241:5674']
367 2428