

《机器学习实战》第5章——Logistic回归(笔记)
1. 概述
Logistic回归分析也用于研究影响关系,即X对于Y的影响情况。Y为定量数据,X可以是定量数据或定类数据。主要是研究二分类观察结果与一些影响因素之间关系的一种多变量分析方法。因变量可以是二分类的,也可以是多分类的。主要在流行病学中应用较多,比较常用的情形是探索某疾病的危险因素,根据危险因素预测某疾病发生的概率等等,常用于数据挖掘,疾病自动诊断,经济预测等领域。
在书中使用Logistic回归来预测患疝气病的马的存活问题是一个典型的案例,项目数据集包含了医院检测马疝病的368个样本和28个特征,有的指标比较主观,有的指标难以测量。
Logistic回归和线性回归最大的区别在于,Y的数据类型。线性回归分析的因变量Y属于定量数据,而Logistic回归分析的因变量Y属于分类数据。
2. 算法
线性回归中,主要是采用最小二乘法进行参数估计,使其残差平方和最小。同时在线性回归中最大似然估计和最小二乘法估计结果是一致的,但不同的是最大似然估计可以用于非线性模型,又因为逻辑回归是非线性模型,所以逻辑回归最常用的估计方法是最大似然法。
最大似然法基本思想:
当从模型总体随机抽取n组样本观测值后,最合理的参数估计量应该使得从模型中抽取该n组样本观测值的概率最大,而不是像最小二乘估计法旨在得到使得模型能最好地拟合样本数据的参数估计量。
3. 分类
Logistic回归在进一步细分,又可分为二元Logit(Logistic)回归、多分类Logit(Logistic)回归,有序Logit(Logistic)回归。
4. 抛砖
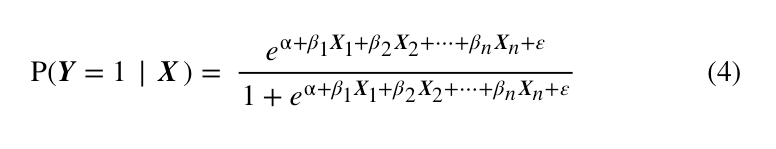
至此,我们回归方程构建的任务算是完成了。下面就是找到一个更简单的方式来表示上式,使公式看起来更像一个回归方程。
事实上,这一步很简单,只需要经过简单的变换,则可以得到下式:
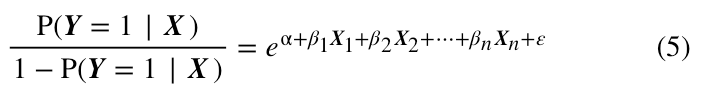
再将上式的左右两边同时取对数,则得到:
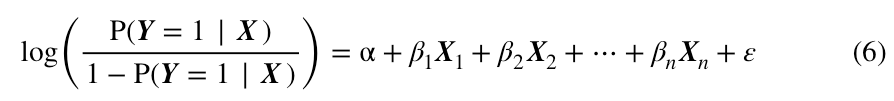
如你所见,上式中,至少右边已经完全是普通回归方程的结构了,至于左边,我们再来解释。
在等式左边,是Y出现阳性结果的概率,自然的,就是Y出现阴性结果的概率,两者的比值被叫做“比率”(odds),取对数后,自然就被叫做对数比率。所以,logistic回归在机器学习领域通常被叫做对数比率回归。
5.代码
使用Pyton3实现

'''
Created on Oct 27, 2010
Logistic Regression Working Module
@author: Peter
'''
from numpy import *
from numpy.core._multiarray_umath import exp


def loadDataSet():
    dataMat = []; labelMat = []
    fr = open('testSet.txt')
    for line in fr.readlines():
        lineArr = line.strip().split()
        dataMat.append([1.0, float(lineArr[0]), float(lineArr[1])])
        labelMat.append(int(lineArr[2]))
    return dataMat,labelMat

def sigmoid(inX):
    return 1.0/(1+exp(-inX))

def gradAscent(dataMatIn, classLabels):
    dataMatrix = mat(dataMatIn)             #convert to NumPy matrix
    labelMat = mat(classLabels).transpose() #convert to NumPy matrix
    m,n = shape(dataMatrix)
    alpha = 0.001
    maxCycles = 500
    weights = ones((n,1))
    for k in range(maxCycles):              #heavy on matrix operations
        h = sigmoid(dataMatrix*weights)     #matrix mult
        error = (labelMat - h)              #vector subtraction
        weights = weights + alpha * dataMatrix.transpose()* error #matrix mult
    return weights

def plotBestFit(weights):
    import matplotlib.pyplot as plt
    dataMat,labelMat=loadDataSet()
    dataArr = array(dataMat)
    n = shape(dataArr)[0]
    xcord1 = []; ycord1 = []
    xcord2 = []; ycord2 = []
    for i in range(n):
        if int(labelMat[i])== 1:
            xcord1.append(dataArr[i,1]); ycord1.append(dataArr[i,2])
        else:
            xcord2.append(dataArr[i,1]); ycord2.append(dataArr[i,2])
    fig = plt.figure()
    ax = fig.add_subplot(111)
    ax.scatter(xcord1, ycord1, s=30, c='red', marker='s')
    ax.scatter(xcord2, ycord2, s=30, c='green')
    x = arange(-3.0, 3.0, 0.1)
    y = (-weights[0]-weights[1]*x)/weights[2]
    ax.plot(x, y)
    plt.xlabel('X1'); plt.ylabel('X2');
    plt.show()

def stocGradAscent0(dataMatrix, classLabels):
    m,n = shape(dataMatrix)
    alpha = 0.01
    weights = ones(n)   #initialize to all ones
    for i in range(m):
        h = sigmoid(sum(dataMatrix[i]*weights))
        error = classLabels[i] - h
        weights = weights + alpha * error * dataMatrix[i]
    return weights

def stocGradAscent1(dataMatrix, classLabels, numIter=150):
    m,n = shape(dataMatrix)
    weights = ones(n)   #initialize to all ones
    for j in range(numIter): # 对数据重复进行150次的整体读取,即迭代150次
        dataIndex = list(range(m)) # 每一次迭代,都会遍历所有的数据
        for i in range(m):
            alpha = 4/(1.0+j+i)+0.0001    #apha decreases with iteration, does not
            randIndex = int(random.uniform(0,len(dataIndex)))#go to 0 because of the constant
            h = sigmoid(sum(dataMatrix[randIndex]*weights))
            error = classLabels[randIndex] - h
            weights = weights + alpha * error * dataMatrix[randIndex]
            del(dataIndex[randIndex])
    return weights

def classifyVector(inX, weights):
    prob = sigmoid(sum(inX*weights))
    if prob > 0.5: return 1.0
    else: return 0.0

def colicTest():
    frTrain = open('horseColicTraining.txt'); frTest = open('horseColicTest.txt')
    trainingSet = []; trainingLabels = []
    for line in frTrain.readlines():
        currLine = line.strip().split('\t')
        lineArr =[]
        for i in range(21):
            lineArr.append(float(currLine[i]))
        trainingSet.append(lineArr)
        trainingLabels.append(float(currLine[21]))
    trainWeights = stocGradAscent1(array(trainingSet), trainingLabels, 1000) # list->array
    errorCount = 0; numTestVec = 0.0
    for line in frTest.readlines():
        numTestVec += 1.0
        currLine = line.strip().split('\t')
        lineArr =[]
        for i in range(21):
            lineArr.append(float(currLine[i]))
        if int(classifyVector(array(lineArr), trainWeights))!= int(currLine[21]):
            errorCount += 1
    errorRate = (float(errorCount)/numTestVec)
    print ("the error rate of this test is: %f" % errorRate)
    return errorRate

def multiTest():
    numTests = 10; errorSum=0.0
    for k in range(numTests):
        errorSum += colicTest()
    print ("after %d iterations the average error rate is: %f" % (numTests, errorSum/float(numTests)))


if __name__ == '__main__':
    multiTest()
https://blog.csdn.net/weixin_44568780/article/details/103435101
https://www.cnblogs.com/pursued-deer/p/7819539.html
以下两行代码
        h = sigmoid(sum(dataMatrix[i]*weights))
        error = classLabels[i] - h
的公式推导,可以参考:


【推荐】国内首个AI IDE,深度理解中文开发场景,立即下载体验Trae
【推荐】编程新体验,更懂你的AI,立即体验豆包MarsCode编程助手
【推荐】抖音旗下AI助手豆包,你的智能百科全书,全免费不限次数
【推荐】轻量又高性能的 SSH 工具 IShell:AI 加持,快人一步
· AI与.NET技术实操系列(二):开始使用ML.NET
· 记一次.NET内存居高不下排查解决与启示
· 探究高空视频全景AR技术的实现原理
· 理解Rust引用及其生命周期标识(上)
· 浏览器原生「磁吸」效果!Anchor Positioning 锚点定位神器解析
· DeepSeek 开源周回顾「GitHub 热点速览」
· 物流快递公司核心技术能力-地址解析分单基础技术分享
· .NET 10首个预览版发布:重大改进与新特性概览!
· AI与.NET技术实操系列(二):开始使用ML.NET
· 单线程的Redis速度为什么快?