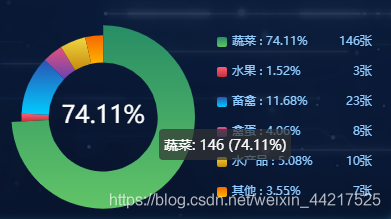
//图例组件
        legend: {
          top: 'center',
          right: 30,
          data: data,
          width: "auto",
          itemWidth: 10,  // 小方块尺寸
          itemHeight: 10,
          textStyle: {
            color:'#90CCFF',
            lineHeight:20,
            // 通过rich自定义尺寸,加宽度使百分比及数值各自对齐
            rich:{
              a:{
                width:100,
                align:'left'
              },
              b:{
                width:40,
                align:'right'
              }
            }
          },
          orient: 'vertical',      // 竖向排列
          // 通过formatte自定义格式
          // 因为formatter的参数里只有name一个参数,所以需要通过获取的数据匹配显示
          // 这里的optionData是获取到的数据,格式为
          // optionData:[
          //  { value: 47.01, name: "水果" },
          //  { value: 31.67, name: "蔬菜" },
          //  { value: 12.51, name: "禽畜" },
          //  { value: 8.24, name: "禽蛋" },
          //  { value: 7.27, name: "水产品" },
          //  { value: 6.32, name: "其他" }
          // ],
          formatter: (name) => {
            var total = 0;
            var tarValue;
            data.forEach((item,i) => {
              total += Number(item.value)
              if (item.name == name) {
                tarValue = Number(item.value ? item.value : 0)
              }
            });
            var percent = ((tarValue / total) * 100).toFixed(2)
            let arr = [
              '{a|'+name+" : "+percent+'%}'+'{b|'+tarValue+'张}'
            ]
            return arr
          }
        }


_______________________
https://blog.csdn.net/weixin_44217525/article/details/108280145?utm_medium=distribute.pc_relevant_t0.none-task-blog-BlogCommendFromMachineLearnPai2-1.control&depth_1-utm_source=distribute.pc_relevant_t0.none-task-blog-BlogCommendFromMachineLearnPai2-1.control


