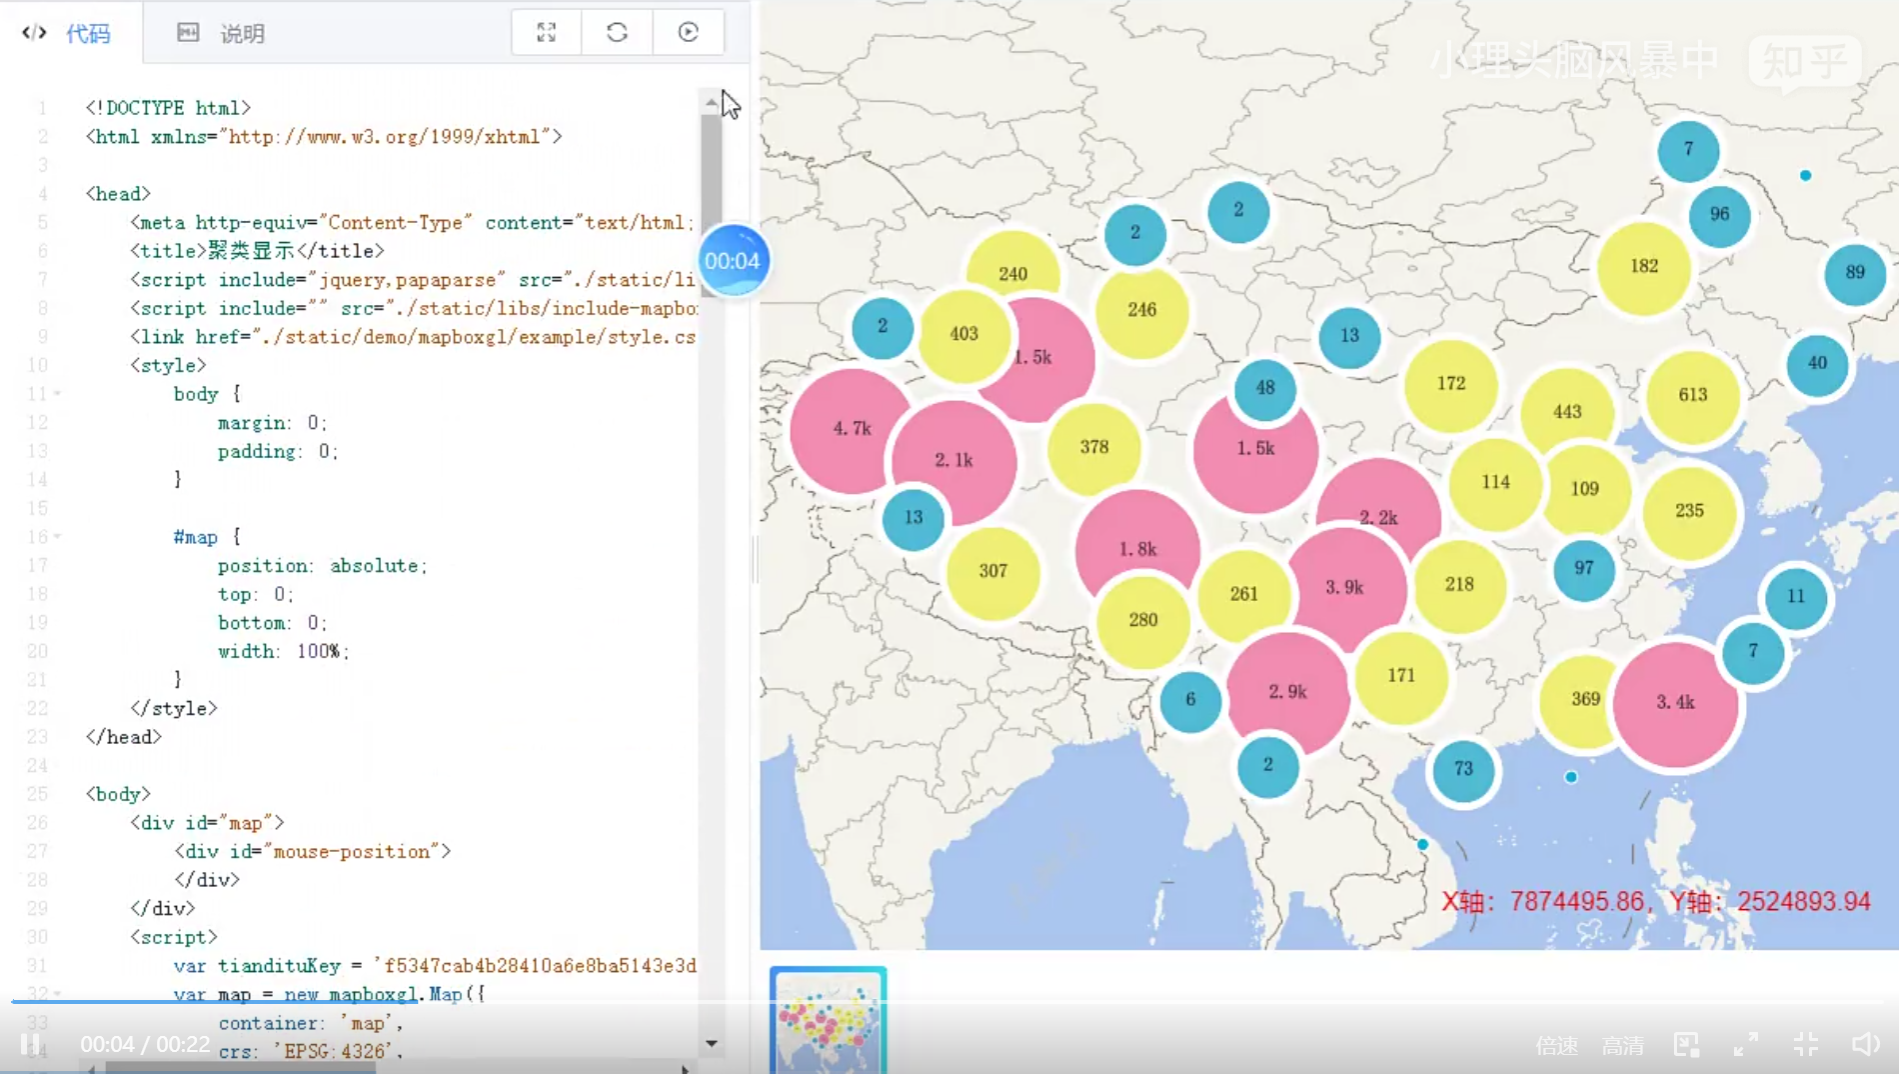
mapbox大数据展示
Mapbox 是一个强大的地图引擎,可以用来展示大数据。以下是使用 Mapbox 展示大数据的基本步骤和示例代码:
-
注册 Mapbox 账号并获取访问令牌(Access Token)。
-
在 HTML 中引入 Mapbox GL JS 库。
-
初始化地图并设置样式。
-
使用 GeoJSON 或者其他格式加载数据。
-
根据加载的数据添加图层到地图上。
 1 <!DOCTYPE html>
 2 <html>
 3 <head>
 4     <meta charset="utf-8">
 5     <title>Mapbox 大数据展示</title>
 6     <meta name="viewport" content="initial-scale=1,maximum-scale=1,user-scalable=no">
 7     <script src="https://api.mapbox.com/mapbox-gl-js/v2.3.1/mapbox-gl.js"></script>
 8     <link href="https://api.mapbox.com/mapbox-gl-js/v2.3.1/mapbox-gl.css" rel="stylesheet">
 9     <style>
10         body { margin: 0; padding: 0; }
11         #map { position: absolute; top: 0; bottom: 0; width: 100%; }
12     </style>
13 </head>
14 <body>
15 <div id="map"></div>
16 <script>
17     mapboxgl.accessToken = 'YOUR_ACCESS_TOKEN'; // 替换为你的访问令牌
18     var map = new mapboxgl.Map({
19         container: 'map',
20         style: 'mapbox://styles/mapbox/streets-v11',
21         center: [-74.5, 40], // 设置中心点
22         zoom: 9 // 设置缩放级别
23     });
24
25     // 加载大数据
26     map.on('load', function() {
27         // 添加数据源
28         map.addSource('large-data-source', {
29             type: 'geojson',
30             data: 'https://example.com/path/to/large-data.geojson' // 大数据的 GeoJSON URL
31         });
32
33         // 添加图层
34         map.addLayer({
35             'id': 'large-data-layer',
36             'type': 'circle',
37             'source': 'large-data-source',
38             'paint': {
39                 'circle-color': '#f00',
40                 'circle-radius': 5
41             }
42         });
43     });
44 </script>
45 </body>
46 </html>
在上述代码中,你需要替换
'YOUR_ACCESS_TOKEN'为你的 Mapbox 访问令牌,并且将'https://example.com/path/to/large-data.geojson'替换为你的大数据 GeoJSON 文件的 URL。请注意,处理大量数据时,确保 GeoJSON 文件是切片的,或者使用 Mapbox Datasets,这样 Mapbox GL JS 可以优化数据加载和渲染。如果数据量非常大,还可以考虑使用 Mapbox GL JS 的分层数据和视图管理来提高性能。
 1 mapboxgl.accessToken = 'YOUR_MAPBOX_ACCESS_TOKEN'; // 替换为你的Mapbox访问令牌
 2 var map = new mapboxgl.Map({
 3   container: 'map',
 4   style: 'mapbox://styles/mapbox/streets-v11',
 5   center: [0, 0], // 初始中心点坐标
 6   zoom: 1 // 初始缩放级别
 7 });
 8
 9 // 当地图加载完成后
10 map.on('load', function() {
11   // 从后端接口获取数据
12   fetch('YOUR_BACKEND_ENDPOINT') // 替换为你的后端接口URL
13     .then(response => response.json())
14     .then(data => {
15       // 添加GeoJSON数据源
16       map.addSource('points-source', {
17         'type': 'geojson',
18         'data': data // 假设你的后端返回的是GeoJSON格式的点数据
19       });
20
21       // 添加图层来展示数据
22       map.addLayer({
23         'id': 'points',
24         'type': 'circle',
25         'source': 'points-source',
26         'paint': {
27           'circle-radius': 5, // 点的半径大小
28           'circle-color': '#007cbf' // 点的颜色
29         }
30       });
31     });
32 });
33 </script>
34 </body>
35 </html>

  1 <!DOCTYPE html>
  2 <html xmlns="http://www.w3.org/1999/xhtml">
  3
  4 <head>
  5     <meta http-equiv="Content-Type" content="text/html; charset=utf-8" />
  6     <title>聚类显示</title>
  7     <script include="jquery,papaparse" src="./static/libs/include-lib-local.js"></script>
  8     <script include="" src="./static/libs/include-mapboxgl-local.js"></script>
  9     <link href="./static/demo/mapboxgl/example/style.css" rel="stylesheet" type="text/css" />
 10     <style>
 11         body {
 12             margin: 0;
 13             padding: 0;
 14         }
 15
 16         #map {
 17             position: absolute;
 18             top: 0;
 19             bottom: 0;
 20             width: 100%;
 21         }
 22     </style>
 23 </head>
 24
 25 <body>
 26     <div id="map">
 27         <div id="mouse-position">
 28         </div>
 29     </div>
 30     <script>
 31         var tiandituKey = 'f5347cab4b28410a6e8ba5143e3d5a35';
 32         var map = new mapboxgl.Map({
 33             container: 'map',
 34             crs: 'EPSG:4326',
 35             maxBounds: [[-180, -90], [180, 90]],
 36             style: {
 37                 version: 8,
 38                 sources: {
 39                     'tianditu-3857-image': {
 40                         //来源类型为栅格瓦片
 41                         type: 'raster',
 42                         tiles: [
 43                             //来源请求地址,请求天地图提供的全球矢量地图WMTS服务
 44                             'http://t' +
 45                             Math.round(Math.random() * 7) +
 46                             '.tianditu.gov.cn/vec_c/wmts?SERVICE=WMTS&REQUEST=GetTile&VERSION=1.0.0' +
 47                             '&LAYER=vec&STYLE=default&TILEMATRIXSET=c&FORMAT=tiles' +
 48                             '&TILECOL={x}&TILEROW={y}&TILEMATRIX={z}' +
 49                             '&tk=' +
 50                             tiandituKey
 51                         ],
 52                         //栅格瓦片的分辨率
 53                         tileSize: 256
 54                     }
 55                 },
 56                 layers: [
 57                     {
 58                         id: 'tianditu-3857-image',
 59                         type: 'raster',
 60                         source: 'tianditu-3857-image',
 61                         minzoom: 0,
 62                         maxzoom: 22
 63                     }
 64                 ],
 65                 glyphs: 'http://develop.smaryun.com:6163/igs/rest/mrms/vtiles/fonts/{fontstack}/{range}.pbf'
 66             },
 67             center: [108.95, 34.25],
 68             zoom: 3
 69         });
 70          79         map.on('load', () => {
 80             $.get('../../static/data/geojson/chinaEarthquake.csv', function (response) {
 81                 var dataObj = Papa.parse(response, {
 82                     skipEmptyLines: true,
 83                     header: true
 84                 });
 85
 86                 var data = dataObj.data;
 87
 88                 var geojson = {
 89                     type: 'FeatureCollection',
 90                     features: []
 91                 };
 92
 93                 for (var i = 0; i < data.length; i++) {
 94                     var item = data[i];
 95                     var date = new Date(item.date);
 96                     var year = date.getFullYear();
 97
 98                     //2w+地震数据
 99                     if (year > 2000 && year < 2015) {
100                         var feature = {
101                             type: 'feature',
102                             geometry: {
103                                 type: 'Point',
104                                 coordinates: []
105                             },
106                             properties: {
107                                 value: parseFloat(item.level)
108                             }
109                         };
110                         feature.geometry.coordinates = [parseFloat(item.X), parseFloat(item.Y)];
111
112                         geojson.features.push(feature);
113                     }
114                 }
115                 addCluster(geojson);
116             });
117         });
118
119         function addCluster(geojson) {
120             // map.add
121             map.addSource('earthquakes', {
122                 type: 'geojson',
123                 data: geojson,
124                 cluster: true,
125                 clusterMaxZoom: 14, // 聚合最大级别
126                 clusterRadius: 50 // 聚合半径
127             });
128
129             map.addLayer({
130                 id: 'clusters',
131                 type: 'circle',
132                 source: 'earthquakes',
133                 filter: ['has', 'point_count'],
134                 paint: {
135                     'circle-color': ['step', ['get', 'point_count'], '#51bbd6', 100, '#f1f075', 750, '#f28cb1'],
136                     'circle-radius': ['step', ['get', 'point_count'], 20, 100, 30, 750, 40],
137                     'circle-stroke-color': '#FFFFFF',
138                     'circle-stroke-width': 5
139                 }
140             });
141
142             map.addLayer({
143                 id: 'cluster-count',
144                 type: 'symbol',
145                 source: 'earthquakes',
146                 filter: ['has', 'point_count'],
147                 layout: {
148                     'text-field': '{point_count_abbreviated}',
149                     'text-font': ['宋体', '宋体'],
150                     'text-size': 12
151                 }
152             });
153
154             map.addLayer({
155                 id: 'unclustered-point',
156                 type: 'circle',
157                 source: 'earthquakes',
158                 filter: ['!', ['has', 'point_count']],
159                 paint: {
160                     'circle-color': '#11b4da',
161                     'circle-radius': 4,
162                     'circle-stroke-width': 1,
163                     'circle-stroke-color': '#fff'
164                 }
165             });
166         }
167     </script>
168 </body>
169
170 </html>
https://zhuanlan.zhihu.com/p/577015814


