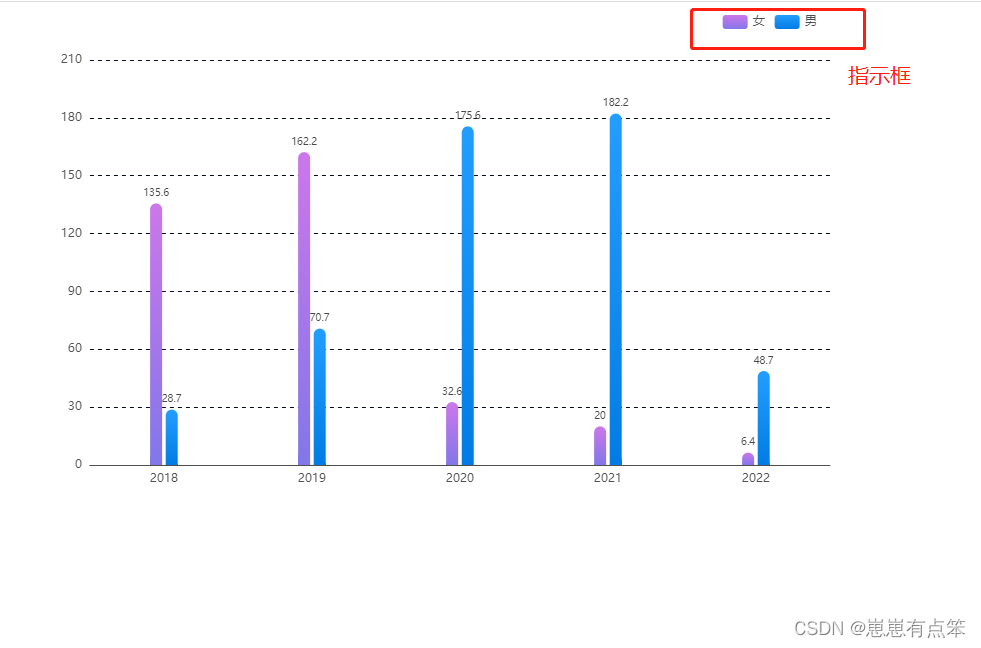
echarts柱状图 双柱状图基本用法

1
 
1
2
3
4
5
6
7
8
9
10
11
12
13
14
15
16
17
18
19
20
21
22
23
24
25
26
27
28
29
30
31
32
33
34
35
36
37
38
39
40
41
42
43
44
45
46
47
48
49
50
51
52
53
54
55
56
57
58
59
60
61
62
63
64
65
66
67
68
69
70
71
72
73
74
75
76
77
78
79
80
81
82
83
84
85
86
87
88
89
90
91
92
93
94
95
96
97
98
99
100
101
102
103
104
105
106
107
108
109
110
111
112
113
114
115
116
117
118
119
120
121
122
123
124
125
126
127
128
129
130
131
132
133
134
135
136
137
138
139
140
141
142
143
144
145
146
147
148
149
150
151
152
153
154
155
156
157
158
159
160
161
162
163
164
165
166
167
168
169
170
171
172
173
174
175
176
177
178
179
180
181
182
183
184
185
186
187
188
189
190
191
192
193
194
195
196
197
198
199
200
201
202
203
204
205
206
207
208
209
210
211
212
213
214
215
216
217
218
219
220
221
222
223
224
225
226
227
<script>
    echarts_1()
    function echarts_1() {
        var myChart = echarts.init(document.getElementById('echart'));
        option = {
            calculable: true,
            legend: {
                //   指示框名字  注意!要和下方series中的name一起改
                data: ['女', '男'],
                // 指示框位置  距离上下左右多少
                right: '5%',
                // top: '50%',
                textStyle: {
                    color: '#4F4F4F'   //字体颜色
                }
            },
       
                title: {
                        text: '对象编号',
                        textStyle: {
                            color: '#5DC3FF',
                            fontSize: 14,
                            fontWeight: 'normal'
                        },
                        left: 10,
                        top: 39
                    },
                    tooltip: {
                        trigger: 'axis',
                        textStyle: {
                            fontSize: 14 // 文字字体大小
                        },
                        axisPointer: {
                            type: 'shadow',
                            shadowStyle: {
                                color: 'rgba(25, 114, 162, 0.4)',
                                width: 1,
                                lineStyle: {
                                    type: 'solid'
                                }
                            }
                        }
                    },
            xAxis: [
                {
                    type: 'category'
                    data: ['2018', '2019', '2020', '2021', '2022'],
                    axisLine: {   //x轴线的颜色以及宽度
                        show: true,   //是否显示X轴
                        lineStyle: {
                            color: "#4F4F4F",
                        }
                    },
                    axisLabel: {
                        // interval: 0,  //间隔几条显示
                        // rotate: 20,  // 切斜度数
                        // fontSize: 10,   //字体大小
                    },
                    axisTick: {
                        //是否显示刻度线
                        show: false
                    },
                }
            ],
            yAxis: [
                {
                    type: 'value',
                 inverse: true, //倒叙
                    axisTick: {
                        //y轴刻度线
                        show: false
                    },
                    axisLine: {
                        show: false, // Y轴
                        lineStyle: {
                            color: "#4F4F4F",
                        }
                    },
                    splitLine: { // 表格里面Y轴线条
                        show: true,
                        lineStyle: {
                            type: 'dashed',    //虚线
                            color: '#04072F'    //虚线颜色
                        }
                    }
                }
            ],
            // 整体大小
            grid: {
                left: '3%',
                right: '4%',
                top: '10%',
                bottom: '5%',
                containLabel: true
            },
            series: [
                {
                    barWidth: 12,//柱子宽度
                    name: '女',
                    type: 'bar',
                    data: [
                        135.6, 162.2, 32.6, 20.0, 6.4
                    ],
                    itemStyle: {
                        //颜色样式部分
                        normal: {
                            barBorderRadius: [20, 20, 0, 0],  //圆角[上左,上右,下右,下左]
                            label: {
                                show: true, //开启数字显示        
                                position: 'top', //在上方显示数字        
                                textStyle: { //数值样式         
                                    color: '#474646'//字体颜色
                                    fontSize: 10       //字体大小
                                }
                            },
                            //   柱状图颜色渐变
                            color: new echarts.graphic.LinearGradient(0, 1, 0, 0, [
                                { offset: 0, color: "#8277E9" },
                                { offset: 1, color: "#CC77E9" },
                            ]),
                        }
                    }
  
                },
                {
                    barWidth: 12,//柱子宽度
                    name: '男',
                    type: 'bar',
                    data: [
                        28.7, 70.7, 175.6, 182.2, 48.7
                    ],
                    itemStyle: {
                        //颜色样式部分
                        normal: {
                            barBorderRadius: [20, 20, 0, 0],  //圆角[上左,上右,下右,下左]
                            label: {
                                show: true, //开启数字显示        
                                position: 'top', //在上方显示数字         
                                textStyle: { //数值样式         
                                    color: '#474646',   //字体颜色
                                    fontSize: 10        //字体大小
                                }
                            },
                            //   柱状图颜色渐变
                            color: new echarts.graphic.LinearGradient(0, 1, 0, 0, [
                                { offset: 0, color: "#017CE4" },
                                { offset: 1, color: "#249EFD" },
                            ]),
                        }
                    }
                }
            ]
        };
 
    //自定义滚动条    
               if (data  > 7) {
                    let endDataZoom = Math.ceil((7 * 100) / data.personNum.length);
                    option.dataZoom = [
                        {
                            type: 'inside',
                            startValue: 0,
                            endValue: 2,
                            minValueSpan: 2,
                            maxValueSpan: 2,
                            yAxisIndex: [0],
                            witdth: 8,
                            bottom: 10,
                            handleStyle: {
                                color: '#074e90',
                                borderColor: '#074e90'
                            },
                            showDataShadow: false,
                            handleIcon:
                                'path://M30.9,53.2C16.8,53.2,5.3,41.7,5.3,27.6S16.8,2,30.9,2C45,2,56.4,13.5,56.4,27.6S45,53.2,30.9,53.2z M30.9,3.5M36.9,35.8h-1.3z M27.8,35.8 h-1.3H27L27.8,35.8L27.8,35.8z',
                            handleSize: '80%',
                            fillerColor: '#074e90',
                            backgroundColor: 'transparent',
                            borderColor: 'transparent',
                            start: 0, //数据窗口范围的起始百分比,表示1%
                            end: endDataZoom, //数据窗口范围的结束百分比,表示35%坐标
                            zoomOnMouseWheel: false, // 关闭滚轮缩放
                            moveOnMouseWheel: true, // 开启滚轮平移
                            moveOnMouseMove: true // 鼠标移动能触发数据窗口平移
                        },
                        {
                            type: 'slider',
                            realtime: true,
                            startValue: 0,
                            endValue: 2,
                            width: 8,
                            bottom: 10,
                            yAxisIndex: [0], // 控制y轴滚动
                            showDetail: false, // 拖拽时是否展示滚动条两侧的文字
                            top: '1%',
                            right: '5',
                            handleStyle: {
                                color: '#074e90',
                                borderColor: '#074e90'
                            },
                            showDataShadow: false,
                            handleIcon:
                                'path://M30.9,53.2C16.8,53.2,5.3,41.7,5.3,27.6S16.8,2,30.9,2C45,2,56.4,13.5,56.4,27.6S45,53.2,30.9,53.2z M30.9,3.5M36.9,35.8h-1.3z M27.8,35.8 h-1.3H27L27.8,35.8L27.8,35.8z',
                            handleSize: '80%',
                            fillerColor: '#074e90',
                            backgroundColor: 'transparent',
                            borderColor: 'transparent'
                        }
                    ];
                } else {
                    option.dataZoom = [];
                }


        // 使用刚指定的配置项和数据显示图表。
        myChart.setOption(option);
         myChart.off('click');
                    myChart.on('click', param => {
                   console.log(param)
                   });
              
        window.addEventListener("resize", function () {
            myChart.resize();
        })
    }
  
</script>


这里有注意的详细看法

最终内容

1
* //柱状图横向时与XAxis,yAxis中type 互换位置


posted @   Gust_Lq  阅读(678)  评论(0编辑  收藏  举报
相关博文:
阅读排行:
· 无需6万激活码!GitHub神秘组织3小时极速复刻Manus,手把手教你使用OpenManus搭建本
· Manus爆火,是硬核还是营销?
· 终于写完轮子一部分:tcp代理 了,记录一下
· 别再用vector<bool>了!Google高级工程师:这可能是STL最大的设计失误
· 单元测试从入门到精通
点击右上角即可分享
微信分享提示