
Vue.js 使用 D3 构建可视化
本文为译文,这是原文链接,正文:
Vue.js 使用 D3 构建可视化更加简单,优雅和有趣
D3 是一个强大的数据可视化库,它结合了可视化组件和 DOM 操作两个功能。
Vue.js 是一个响应式的前端框架,它允许您将数据渲染到 DOM 内并可以抽象出很复杂的逻辑。这两个框架都试图做类似的事情,但是当它们结合起来可能很难保持逻辑的一致性。本文将尝试通过展示如何使用 Vue 操控 DOM,使用它的响应式特性来更新 D3 组件来尝试解决此冲突。
在我们开始之前,我们先创建一个 Vue 组件,它使用常规的 D3 DOM 操作来呈现简单的折线图:
<script>
import * as d3 from 'd3';
const data = [99, 71, 78, 25, 36, 92];
export default {
  name: 'non-vue-line-chart',
  template: '<div></div>',
  mounted() {
    const svg = d3.select(this.$el)
      .append('svg')
      .attr('width', 500)
      .attr('height', 270)
      .append('g')
      .attr('transform', 'translate(0, 10)');
    const x = d3.scaleLinear().range([0, 430]);
    const y = d3.scaleLinear().range([210, 0]);
    d3.axisLeft().scale(x);
    d3.axisTop().scale(y);
    x.domain(d3.extent(data, (d, i) => i));
    y.domain([0, d3.max(data, d => d)]);
    const createPath = d3.line()
      .x((d, i) => x(i))
      .y(d => y(d));
    svg.append('path').attr('d', createPath(data));
  },
};
</script>

<style lang="sass">
svg
  margin: 25px;
  path
    fill: none
    stroke: #76BF8A
    stroke-width: 3px
</style>
看起来是这样:
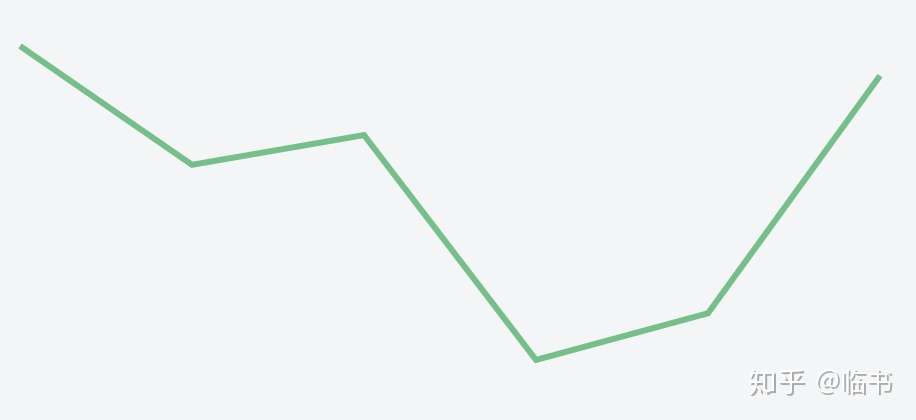 折线图
折线图
代码比较简单很容易理解,但是这仅仅是一个基础的例子。因为我们没有使用模板,所以我们需要更多的操作和计算来完成更复杂的可视化,这些都会掩盖组件的设计与逻辑。上面的例子还有一个隐患,就是我们不能用 CSS 的 scoped 属性来控制生效区域,因为 D3 会动态的向 DOM 添加元素。
我们重新创建一个更好的示例:
<template>
  <svg width="500" height="270">
    <g style="transform: translate(0, 10px)">
      <path :d="line" />
    </g>
  </svg>
</template>

<script>
import * as d3 from 'd3';
export default {
  name: 'vue-line-chart',
  data() {
    return {
      data: [99, 71, 78, 25, 36, 92],
      line: '',
    };
  },
  mounted() {
    this.calculatePath();
  },
  methods: {
    getScales() {
      const x = d3.scaleTime().range([0, 430]);
      const y = d3.scaleLinear().range([210, 0]);
      d3.axisLeft().scale(x);
      d3.axisBottom().scale(y);
      x.domain(d3.extent(this.data, (d, i) => i));
      y.domain([0, d3.max(this.data, d => d)]);
      return { x, y };
    },
    calculatePath() {
      const scale = this.getScales();
      const path = d3.line()
        .x((d, i) => scale.x(i))
        .y(d => scale.y(d));
      this.line = path(this.data);
    },
  },
};
</script>

<style lang="sass" scoped>
svg
  margin: 25px;
path
  fill: none
  stroke: #76BF8A
  stroke-width: 3px
</style>
非常 Cool,虽然它没有公开任何属性并且数据是硬编码的,但是它很好地将视图从逻辑中分离出来并使用 Vue 钩子,方法和数据对象。
我们使用 D3 组件来生成我们需要的,用来填充文档的数据,但是我们使用Vue来管理DOM和组件的状态。
这是生成堆积图的组件,增加了用户交互,可以响应父容器 resize 事件,并通过将图表动态化为新的状态来对数据集的更改做出响应:
<template>
  <div>
    <svg @mousemove="mouseover" :width="width" :height="height">
      <g :style="{transform: `translate(${margin.left}px, ${margin.top}px)`}">
        <path class="area" :d="paths.area" />
        <path class="line" :d="paths.line" />
        <path class="selector" :d="paths.selector" />
      </g>
    </svg>
  </div>
</template>

<script>
/* globals window, requestAnimationFrame */
import * as d3 from 'd3';
import TWEEN from 'tween.js';
const props = {
  data: {
    type: Array,
    default: () => [],
  },
  margin: {
    type: Object,
    default: () => ({
      left: 0,
      right: 0,
      top: 10,
      bottom: 10,
    }),
  },
  ceil: {
    type: Number,
    default: 100,
  },
};
export default {
  name: 'area-chart',
  props,
  data() {
    return {
      width: 0,
      height: 0,
      paths: {
        area: '',
        line: '',
        selector: '',
      },
      lastHoverPoint: {},
      scaled: {
        x: null,
        y: null,
      },
      animatedData: [],
      points: [],
    };
  },
  computed: {
    padded() {
      const width = this.width - this.margin.left - this.margin.right;
      const height = this.height - this.margin.top - this.margin.bottom;
      return { width, height };
    },
  },
  mounted() {
    window.addEventListener('resize', this.onResize);
    this.onResize();
  },
  beforeDestroy() {
    window.removeEventListener('resize', this.onResize);
  },
  watch: {
    data: function dataChanged(newData, oldData) {
      this.tweenData(newData, oldData);
    },
    width: function widthChanged() {
      this.initialize();
      this.update();
    },
  },
  methods: {
    onResize() {
      this.width = this.$el.offsetWidth;
      this.height = this.$el.offsetHeight;
    },
    createArea: d3.area().x(d => d.x).y0(d => d.max).y1(d => d.y),
    createLine: d3.line().x(d => d.x).y(d => d.y),
    createValueSelector: d3.area().x(d => d.x).y0(d => d.max).y1(0),
    initialize() {
      this.scaled.x = d3.scaleLinear().range([0, this.padded.width]);
      this.scaled.y = d3.scaleLinear().range([this.padded.height, 0]);
      d3.axisLeft().scale(this.scaled.x);
      d3.axisBottom().scale(this.scaled.y);
    },
    tweenData(newData, oldData) {
      const vm = this;
      function animate(time) {
        requestAnimationFrame(animate);
        TWEEN.update(time);
      }
      new TWEEN.Tween(oldData)
        .easing(TWEEN.Easing.Quadratic.Out)
        .to(newData, 500)
        .onUpdate(function onUpdate() {
          vm.animatedData = this;
          vm.update();
        })
        .start();
      animate();
    },
    update() {
      this.scaled.x.domain(d3.extent(this.data, (d, i) => i));
      this.scaled.y.domain([0, this.ceil]);
      this.points = [];
      for (const [i, d] of this.animatedData.entries()) {
        this.points.push({
          x: this.scaled.x(i),
          y: this.scaled.y(d),
          max: this.height,
        });
      }
      this.paths.area = this.createArea(this.points);
      this.paths.line = this.createLine(this.points);
    },
    mouseover({ offsetX }) {
      if (this.points.length > 0) {
        const x = offsetX - this.margin.left;
        const closestPoint = this.getClosestPoint(x);
        if (this.lastHoverPoint.index !== closestPoint.index) {
          const point = this.points[closestPoint.index];
          this.paths.selector = this.createValueSelector([point]);
          this.$emit('select', this.data[closestPoint.index]);
          this.lastHoverPoint = closestPoint;
        }
      }
    },
    getClosestPoint(x) {
      return this.points
        .map((point, index) => ({ x:
          point.x,
          diff: Math.abs(point.x - x),
          index,
        }))
        .reduce((memo, val) => (memo.diff < val.diff ? memo : val));
    },
  },
};
</script>
我们已经构建了一个可重用的组件,只需要将一个任意数字组成的数组传递给它。
该组件在 resize 事件上注册一个监听器,用于计算容器尺寸;宽度和数据的改变会触发更新;并且,mouseover 处理程序会将数据「选择器」(也就是鼠标)选中的图表值拿到,并使用 $emit 将事件发回父组件。
用户可以定义范围的伪随机数示例呈现:
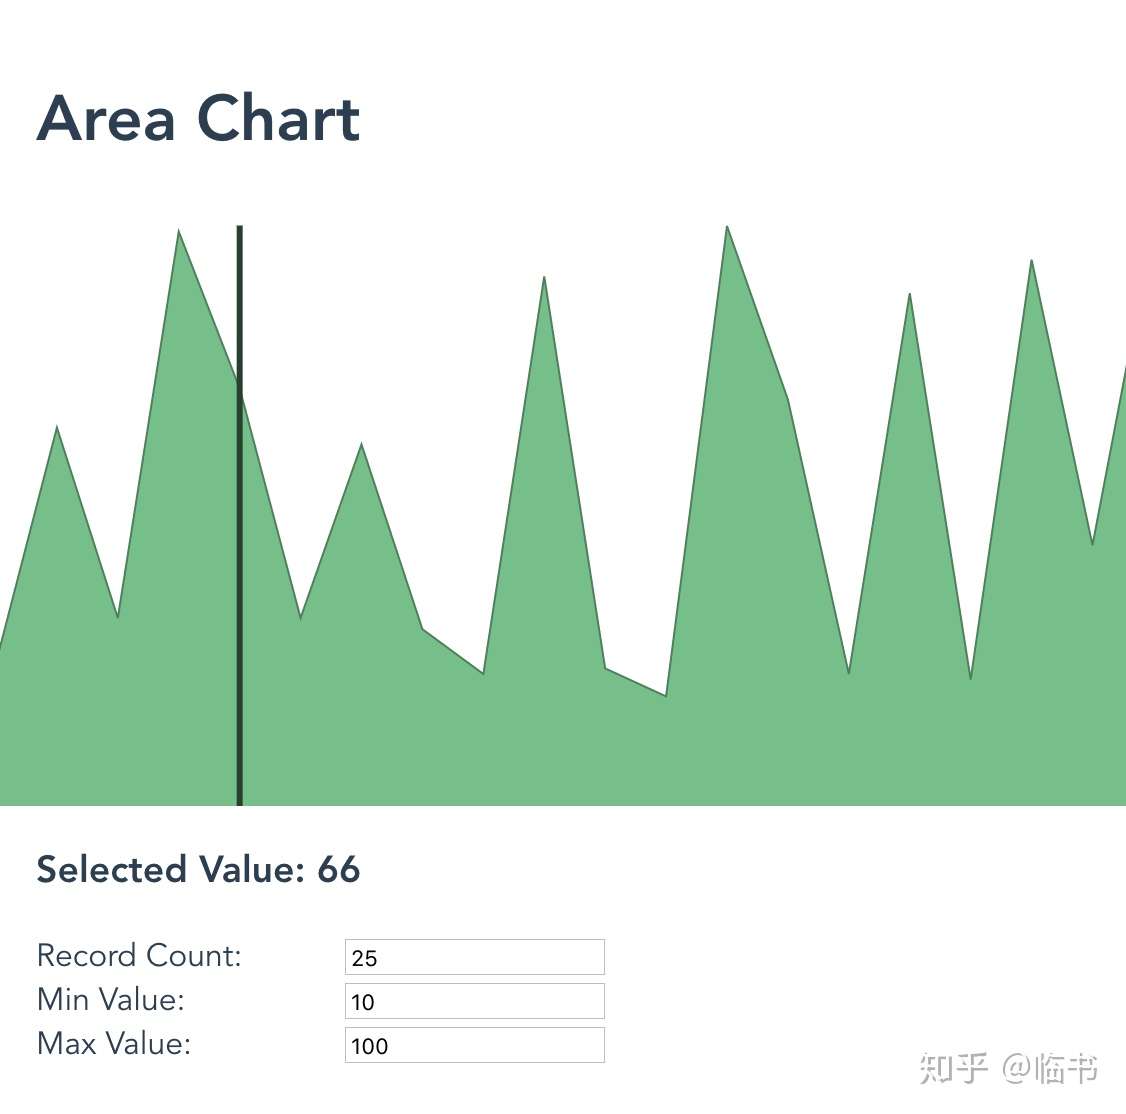 面积图
面积图
前端界有很多响应式 HTML 图表库可用,其中大多数可以很简单地封装在 Vue 组件中。
然而,D3 的可扩展性及其提供的功能的数量之多使其非常适合希望进行高级数据可视化的人员学习。再加上Vue.js,创建 D3 组件不仅容易,而且相当有趣!
正文完
本文作者:云峰122
本文链接:https://www.cnblogs.com/guozz/p/14619850.html
版权声明:本作品采用知识共享署名-非商业性使用-禁止演绎 2.5 中国大陆许可协议进行许可。


【推荐】国内首个AI IDE,深度理解中文开发场景,立即下载体验Trae
【推荐】编程新体验,更懂你的AI,立即体验豆包MarsCode编程助手
【推荐】抖音旗下AI助手豆包,你的智能百科全书,全免费不限次数
【推荐】轻量又高性能的 SSH 工具 IShell:AI 加持,快人一步