

【事件】01.10046 SQL_TRACE
查看 sql 执行计划的方法有许多种, 10046 事件就是其中的一种. 与其他查看 sql 执行计划不同, 当我们遇到比较复杂的 sql 语句, 我们可以通过 10046 跟踪 sql 得到执行计划中每一个步骤的逻辑读, 物理读以及花费的时间等. 这种细粒度的跟踪对于我们分析 sql 性能尤其有用.
一般来说,使用 10046 事件得到 sql 执行计划的步骤如下:
- 激活当前 session 10046 事件
- 在当前 session 中执行 sql 语句
- 关闭当前 session 10046 事件
为了方便查找,我们先给Trace文件生成一个标识:
SQL> alter session set tracefile_identifier='XieBro';
查询Trace文件生成在哪个目录(非SYS用户也可以):
SELECT d.VALUE || '/' || LOWER(RTRIM(i.INSTANCE, CHR(0))) || '_ora_' ||
  p.spid || '.trc' AS "trace_file_name"
FROM (SELECT p.spid
       FROM v$mystat m, v$session s, v$process p
       WHERE m.statistic# = 1
         AND s.SID = m.SID
         AND p.addr = s.paddr) p,
       (SELECT t.INSTANCE
         FROM v$thread t, v$parameter v
         WHERE v.NAME = 'thread'
           AND (v.VALUE = 0 OR t.thread# = TO_NUMBER(v.VALUE))) i,
       (SELECT VALUE FROM v$parameter WHERE NAME = 'user_dump_dest') d;


trace_file_name
----------------------------------------------------------------
/u01/app/oracle/product/19.3/dbhome_1/rdbms/log/t2_ora_12866.trc
激活10046事件:
alter session set events '10046 trace name context forever ,level 12';
执行SQL语句:
SQL> insert into test values(2,'test2');

1 row created.

SQL> commit;

Commit complete.
关闭10046事件:
alter session set events '10046 trace name context off';
之后就可以在目录下找到生成的Trace文件:
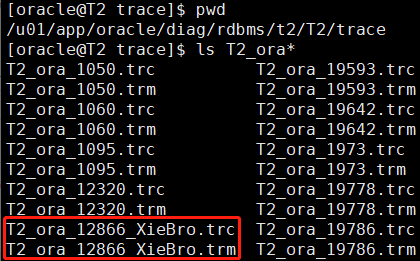
其中, 10046 按照收集信息的内容分为以下等级:
| Level 0 | 停用SQL跟踪,相当于SQL_TRACE=FALSE |
| Level 1 | 标准SQL跟踪,相当于SQL_TRACE=TRUE |
| Level 4 | 在level 1的基础上增加绑定变量的信息 |
| Level 8 | 在level 1的基础上增加等待事件的信息 |
| Level 12 | 在level 1的基础上增加绑定变量和等待事件的信息 |
打开生成的Trace文件截取一段分析:
=====================
PARSING IN CURSOR #140026382904048 len=34 dep=0 uid=106 oct=2 lid=106 tim=620654915455 hv=914467565 ad='709a1cd0' sqlid='63dvn4hv83ard'
insert into test values(2,'test2')
END OF STMT
PARSE #140026382904048:c=14515,e=56361,p=0,cr=24,cu=3,mis=1,r=0,dep=0,og=1,plh=0,tim=620654915455
WAIT #140026382904048: nam='SQL*Net message to dblink' ela= 0 driver id=1413697536 #bytes=1 p3=0 obj#=-1 tim=620654915568
WAIT #140026382904048: nam='SQL*Net message from dblink' ela= 482 driver id=1413697536 #bytes=1 p3=0 obj#=-1 tim=620654916065
EXEC #140026382904048:c=604,e=604,p=0,cr=0,cu=0,mis=0,r=1,dep=0,og=1,plh=0,tim=620654916112
WAIT #140026382904048: nam='SQL*Net message to dblink' ela= 1 driver id=1413697536 #bytes=1 p3=0 obj#=-1 tim=620654916136
WAIT #140026382904048: nam='SQL*Net vector data to dblink' ela= 65 driver id=1413697536 #bytes=26 p3=2 obj#=-1 tim=620654916213
WAIT #140026382904048: nam='SQL*Net message from dblink' ela= 311 driver id=1413697536 #bytes=1 p3=0 obj#=-1 tim=620654916557

*** 2021-07-15T13:49:20.695209+08:00 (CDB$ROOT(1))
WAIT #140026382904048: nam='standby query scn advance' ela= 996182 p1=3663676 p2=0 p3=12000 obj#=-1 tim=620655912759
WAIT #140026382904048: nam='SQL*Net message to client' ela= 3 driver id=1650815232 #bytes=1 p3=0 obj#=-1 tim=620655912920

*** 2021-07-15T13:49:28.600391+08:00 (CDB$ROOT(1))
WAIT #140026382904048: nam='SQL*Net message from client' ela= 7905018 driver id=1650815232 #bytes=1 p3=0 obj#=-1 tim=620663817958
CLOSE #140026382904048:c=30,e=29,dep=0,type=0,tim=620663818107
=====================
从上面的 trace 文件我们可以看出 sql 语句经过了 parse(解析) -> exec(执行) 几个过程(有时会有fetch从游标中获取数据的过程),其中第一句说明了当前跟踪执行的 sql 语句的概况,比如使用游标号, sql 语句的长度, 递归深度等等基本信息:
PARSING IN CURSOR #140026382904048 len=34 dep=0 uid=106 oct=2 lid=106 tim=620654915455 hv=914467565 ad='709a1cd0' sqlid='63dvn4hv83ard'
| cursor | cursor number |
| len | sql语句的长度 |
| dep | sql语句的递归深度 |
| uid | user id |
| oct | oracle command type |
| lid | privilege user id |
| tim | timestamp时间戳 |
| hv | hash id |
| ad | sql address,用在v$sqltext |
| sqlid | sql id |
接着, 下面的语句说明了 sql 语句具体的执行过程以及每一个步骤消耗 CPU 的时间等性能指标:
PARSE #140026382904048:c=14515,e=56361,p=0,cr=24,cu=3,mis=1,r=0,dep=0,og=1,plh=0,tim=620654915455
EXEC #140026382904048:c=604,e=604,p=0,cr=0,cu=0,mis=0,r=1,dep=0,og=1,plh=0,tim=620654916112
| c | CPU消耗的时间 |
| e | Elapsed time 持续时间 |
| p | number of physical reads 物理读的次数 |
| cr | number of buffers retrieved for CR reads 逻辑读的数据块 |
| cu | number of buffers retrieved in current mode 【current模式读取的数据块】 |
| mis | cursor missed in the cache 库缓存中丢失的游标,硬解析次数 |
| r | number of rows processed处理的行数 |
| dep | 递归深度 |
| og | optimizer mode 【1:all_rows,2:first_rows,3:rule,4:choose】 |
| plh | plan hash value |
| tim | timestamp 时间戳 |
执行过程中发生的等待事件:
WAIT #140026382904048: nam='SQL*Net message to dblink' ela= 0 driver id=1413697536 #bytes=1 p3=0 obj#=-1 tim=620654915568
| nam | an event that we waited for 等待事件的名字 |
| ela | 此操作消耗的时间 |
| p3 | block块号 |
| trm | timestamp时间戳 |
TKPROF 工具
可以使用 tkprof 命令对 trace 文件进行翻译,得到一个容易理解的 trace 汇总报表文件
[oracle@T2 trace]$ tkprof T2_ora_12866_XieBro.trc XieBro.trc
********************************************************************************

SQL ID: 63dvn4hv83ard Plan Hash: 0

insert into test
values
(3,'test3')


call     count       cpu    elapsed       disk      query    current        rows
------- ------  -------- ---------- ---------- ---------- ----------  ----------
Parse        1      0.01       0.05          0          1          3           0
Execute      1      0.00       0.00          0          0          0           1
Fetch        0      0.00       0.00          0          0          0           0
------- ------  -------- ---------- ---------- ---------- ----------  ----------
total        2      0.01       0.05          0          1          3           1

Misses in library cache during parse: 1
Optimizer mode: ALL_ROWS
Parsing user id: 106

Elapsed times include waiting on following events:
  Event waited on                             Times   Max. Wait  Total Waited
  ----------------------------------------   Waited  ----------  ------------
  SQL*Net message to dblink                       2        0.00          0.00
  SQL*Net message from dblink                     2        0.00          0.00
  SQL*Net vector data to dblink                   1        0.00          0.00
  standby query scn advance                       1        0.99          0.99
  SQL*Net message to client                       1        0.00          0.00
  SQL*Net message from client                     1        7.90          7.90
********************************************************************************
OVERALL TOTALS FOR ALL NON-RECURSIVE STATEMENTS

call     count       cpu    elapsed       disk      query    current        rows
------- ------  -------- ---------- ---------- ---------- ----------  ----------
Parse        2      0.01       0.05          0          1          3           0
Execute      3      0.00       0.00          0        485          0           1
Fetch        0      0.00       0.00          0          0          0           0
------- ------  -------- ---------- ---------- ---------- ----------  ----------
total        5      0.01       0.05          0        486          3           1

Misses in library cache during parse: 2
Misses in library cache during execute: 1

Elapsed times include waiting on following events:
  Event waited on                             Times   Max. Wait  Total Waited
  ----------------------------------------   Waited  ----------  ------------
  SQL*Net message to client                       2        0.00          0.00
  SQL*Net message from client                     2       14.68         22.59
  control file sequential read                    4        0.00          0.00
  single-task message                             1        0.02          0.02
  SQL*Net message from dblink                    12        0.00          0.01
  SQL*Net message to dblink                      11        0.00          0.00
  SQL*Net vector data to dblink                   2        0.00          0.00
  Disk file operations I/O                        1        0.00          0.00
  standby query scn advance                       1        0.99          0.99


OVERALL TOTALS FOR ALL RECURSIVE STATEMENTS

call     count       cpu    elapsed       disk      query    current        rows
------- ------  -------- ---------- ---------- ---------- ----------  ----------
Parse        2      0.00       0.00          0          0          0           0
Execute      6      0.00       0.00          0          0          0           0
Fetch        6      0.00       0.00          0         23          0           5
------- ------  -------- ---------- ---------- ---------- ----------  ----------
total       14      0.00       0.00          0         23          0           5

Misses in library cache during parse: 2
Misses in library cache during execute: 2

    3  user  SQL statements in session.
    6  internal SQL statements in session.
    9  SQL statements in session.
********************************************************************************
Trace file: T2_ora_12866_XieBro.trc
Trace file compatibility: 12.2.0.0
Sort options: default

       1  session in tracefile.
       3  user  SQL statements in trace file.
       6  internal SQL statements in trace file.
       9  SQL statements in trace file.
       9  unique SQL statements in trace file.
     200  lines in trace file.
      23  elapsed seconds in trace file.
其中,Misses in library cache during parse :2 意思是解析的时候库缓存丢失游标, 也就是说发生了两次硬解析
