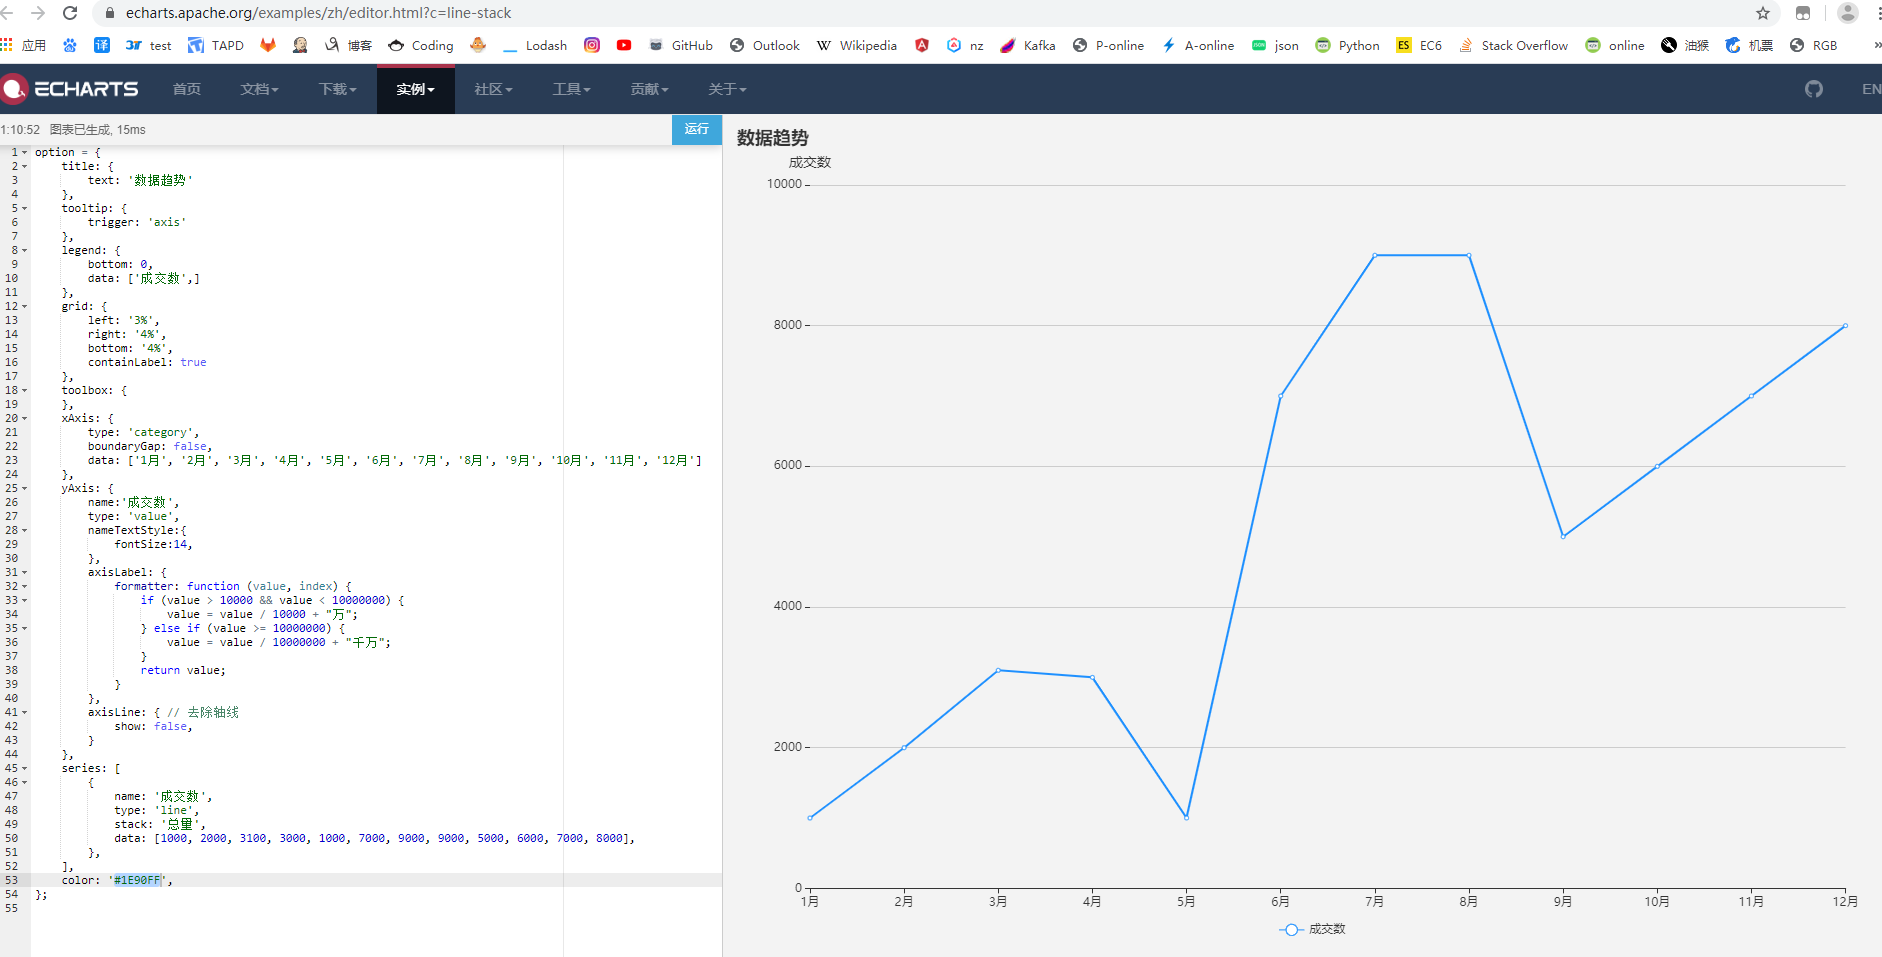
echarts 折线图
需求有个折线图,用 echarts 画一下:

上个测试连接:https://echarts.apache.org/examples/zh/editor.html?c=line-stack

记录下
option = {
    title: {
        text: '数据趋势'
    },
    tooltip: {
        trigger: 'axis'
    },
    legend: {
        bottom: 0,
        data: ['成交数',]
    },
    grid: {
        left: '3%',
        right: '4%',
        bottom: '4%',
        containLabel: true
    },
    toolbox: {
    },
    xAxis: {
        type: 'category',
        boundaryGap: false,
        data: ['1月', '2月', '3月', '4月', '5月', '6月', '7月', '8月', '9月', '10月', '11月', '12月'],
        axisLine: { // 去除轴线
            show: false,
        },
        axisTick: { // 去除刻度线
            show: false,
        },
    },
    yAxis: {
        name:'成交数',
        type: 'value',
        nameTextStyle:{
            fontSize:14,
        },
        axisLabel: {
            formatter: function (value, index) {
                if (value > 10000 && value < 10000000) {
                    value = value / 10000 + "万";
                } else if (value >= 10000000) {
                    value = value / 10000000 + "千万";
                }
                return value;
            }
        },
        axisLine: { // 去除轴线
            show: false,
        }
    },
    series: [
        {
            name: '成交数',
            type: 'line',
            stack: '总量',
            data: [1000, 2000, 3100, 3000, 1000, 7000, 9000, 9000, 5000, 6000, 7000, 8000],
        },
    ],
    color: '#1E90FF',
};


【推荐】国内首个AI IDE,深度理解中文开发场景,立即下载体验Trae
【推荐】编程新体验,更懂你的AI,立即体验豆包MarsCode编程助手
【推荐】抖音旗下AI助手豆包,你的智能百科全书,全免费不限次数
【推荐】轻量又高性能的 SSH 工具 IShell:AI 加持,快人一步
· AI与.NET技术实操系列:基于图像分类模型对图像进行分类
· go语言实现终端里的倒计时
· 如何编写易于单元测试的代码
· 10年+ .NET Coder 心语,封装的思维:从隐藏、稳定开始理解其本质意义
· .NET Core 中如何实现缓存的预热?
· 分享一个免费、快速、无限量使用的满血 DeepSeek R1 模型,支持深度思考和联网搜索!
· 基于 Docker 搭建 FRP 内网穿透开源项目(很简单哒)
· ollama系列01:轻松3步本地部署deepseek,普通电脑可用
· 25岁的心里话
· 按钮权限的设计及实现