书中的错误纠正与记录
最近在看Feedback Control of Dynamic Systems 8th edition (Gene F. Franklin, J. David Powell etc.) (z-lib.org).pdf书时,书中273页的代码有一处错误:
正确如下:

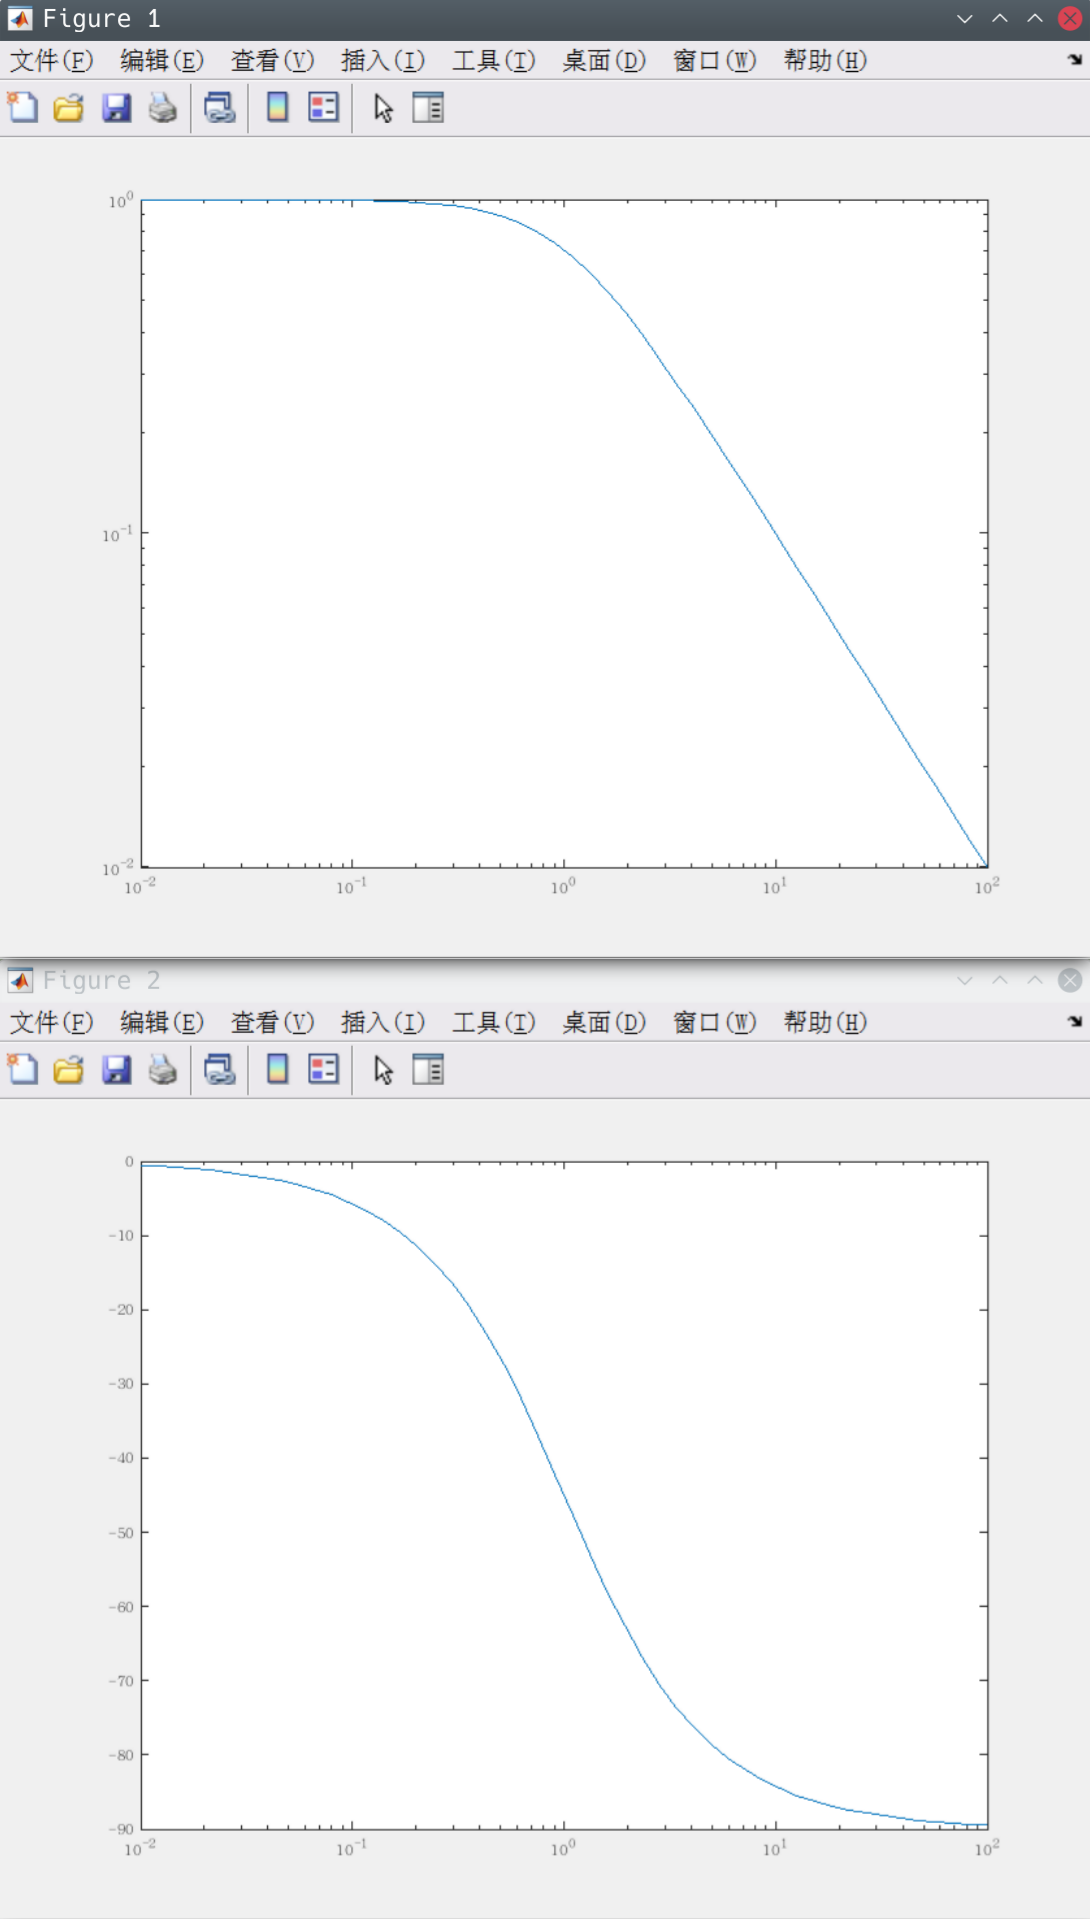
1 k=1;
2 s=tf('s');
3 w=logspace(-2,2);
4 sysH=1/(s+k);
5 [mag,phase]=bode(sysH,w);
6 figure
7 loglog(w,squeeze(mag));
8 figure
9 semilogx(w,squeeze(phase));
图像如下:
使用subplot命令后,并设置图片属性后:
代码:
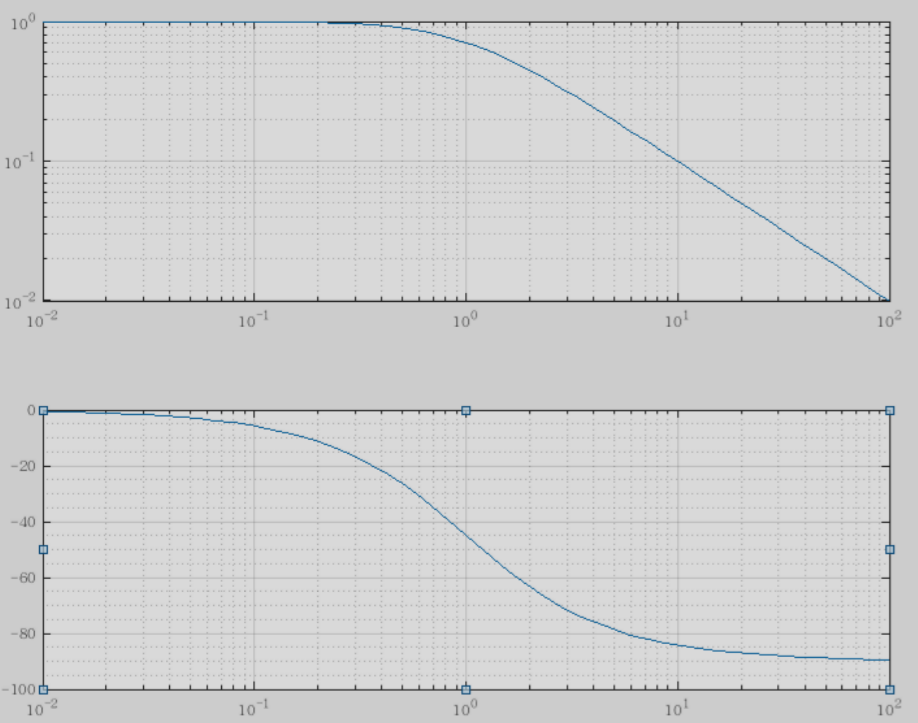
1 k=1;
2 s=tf('s');
3 w=logspace(-2,2);
4 sysH=1/(s+k);
5 [mag,phase]=bode(sysH,w);
6 subplot(211)
7 loglog(w,squeeze(mag));
8 subplot(212)
9 semilogx(w,squeeze(phase));
通过图片编辑完成后,在图片上右击选定显示代码,加上图片属性代码:
function createsubplot(Parent1, X1, Y1)
%CREATESUBPLOT(Parent1, X1, Y1)
%  PARENT1:  subplot parent
%  X1:  semilogx x 数据的向量
%  Y1:  semilogx y 数据的向量

%  由 MATLAB 于 12-Mar-2024 11:15:26 自动生成

% 创建 subplot
subplot1 = subplot(2,1,2,'Parent',Parent1);
hold(subplot1,'on');

% 创建 semilogx
semilogx(X1,Y1,'Parent',subplot1);

box(subplot1,'on');
hold(subplot1,'off');
% 设置其余坐标区属性
set(subplot1,'ContextMenu','XGrid','on','XMinorTick','on','XScale','log','YGrid','on',...
    'YMinorGrid','on');
形成的图片如下:
人就像是被蒙着眼推磨的驴子,生活就像一条鞭子;当鞭子抽到你背上时,你就只能一直往前走,虽然连你也不知道要走到什么时候为止,便一直这么坚持着。


【推荐】国内首个AI IDE,深度理解中文开发场景,立即下载体验Trae
【推荐】编程新体验,更懂你的AI,立即体验豆包MarsCode编程助手
【推荐】抖音旗下AI助手豆包,你的智能百科全书,全免费不限次数
【推荐】轻量又高性能的 SSH 工具 IShell:AI 加持,快人一步
· 阿里最新开源QwQ-32B,效果媲美deepseek-r1满血版,部署成本又又又降低了!
· 开源Multi-agent AI智能体框架aevatar.ai,欢迎大家贡献代码
· Manus重磅发布:全球首款通用AI代理技术深度解析与实战指南
· 被坑几百块钱后,我竟然真的恢复了删除的微信聊天记录!
· AI技术革命,工作效率10个最佳AI工具
2021-03-12 解决编辑安装falkon中碰到缺少ecm问题
2021-03-12 vim基础普及