
matplotlib的坐标问题(以contourf为例)
matplotlib的坐标问题(以contourf为例)
matplotlib中contourf([X, Y], Z)参数如下:
    X, Y : array-like, optional
        The coordinates of the values in *Z*.

        *X* and *Y* must both be 2-D with the same shape as *Z* (e.g.
        created via `numpy.meshgrid`), or they must both be 1-D such
        that ``len(X) == M`` is the number of columns in *Z* and
        ``len(Y) == N`` is the number of rows in *Z*.

        If not given, they are assumed to be integer indices, i.e.
        ``X = range(M)``, ``Y = range(N)``.

    Z : array-like(N, M)
        The height values over which the contour is drawn.
如果X, Y都是一维数组,则要求X的长度是Z的列的数,Y的长度是Z的行的数目。
有时数据以Z[Y, X]的形式存储,所以调用contourf绘图时,是直接使用contourf(X, Y, Z)来绘图。
另外,当执行切片操作时,因为思维惯性,会不由自主的进行错误操作,如Z[:1, :2],对X, Y切片则变成了
X[:1], Y[:2],当然这样是错误的,正确的应该是X[:2], Y[:1], 我就在这里犯了很多次错误,尤其当X, Y等长时。
对于一个二维数组,如果不给定X, Y, 则matplotlib默认第一维是y轴,所以切片时一定要小心:
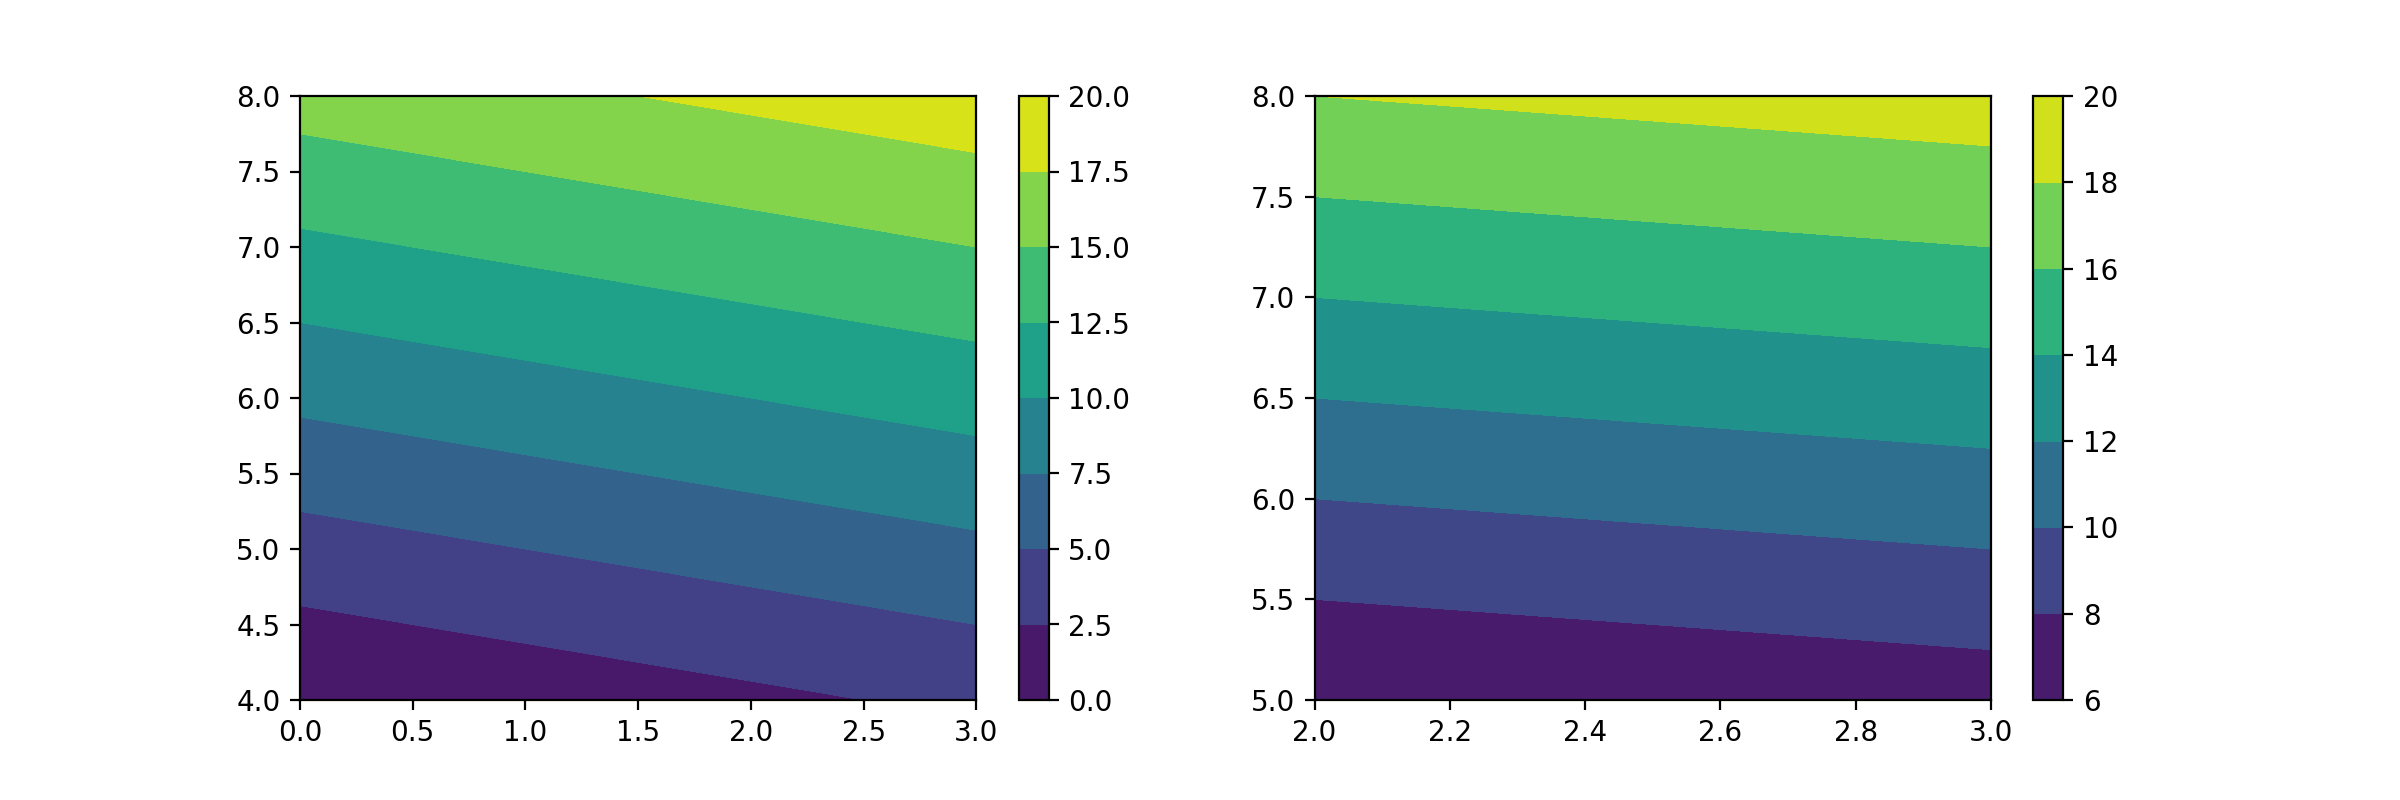
下面是一个例子:
X = np.arange(4)
Y = np.arange(4, 9)
Z = np.arange(20).reshape(5, 4)

fig, (ax1, ax2) = plt.subplots(1, 2, figsize=(12, 4))
cf = ax1.contourf(X, Y, Z)
fig.colorbar(cf, ax=ax1)

Zs = Z[1:, 2:]
Xs = X[2:]
Ys = Y[1:]
cf2 = ax2.contourf(Xs, Ys, Zs)
fig.colorbar(cf2, ax=ax2)
fig.savefig('test.png', dpi=200)
Note:
当画建筑群,有南北方向时,由于matplotlib默认的原点在左下角,所以直接画会导致南北方向的翻转,可以通过将原建筑物数据对行进行翻转buildings[::-1, :]得到合适的的结果。
