docker部署单机模式nacos
参考 https://nacos.io/docs/latest/quickstart/quick-start-docker/
准备docker
$ docker version
Client: Docker Engine - Community
 Version:           27.5.1
 API version:       1.47
 Go version:        go1.22.11
 Git commit:        9f9e405
 Built:             Wed Jan 22 13:41:31 2025
 OS/Arch:           linux/amd64
 Context:           default

Server: Docker Engine - Community
 Engine:
  Version:          27.5.1
  API version:      1.47 (minimum version 1.24)
  Go version:       go1.22.11
  Git commit:       4c9b3b0
  Built:            Wed Jan 22 13:41:31 2025
  OS/Arch:          linux/amd64
  Experimental:     false
 containerd:
  Version:          1.7.25
  GitCommit:        bcc810d6b9066471b0b6fa75f557a15a1cbf31bb
 runc:
  Version:          1.2.4
  GitCommit:        v1.2.4-0-g6c52b3f
 docker-init:
  Version:          0.19.0
  GitCommit:        de40ad0

$ docker compose version
Docker Compose version v2.32.4
构建mysql镜像
FROM mysql:8.0.30
ADD https://raw.githubusercontent.com/alibaba/nacos/develop/distribution/conf/mysql-schema.sql /docker-entrypoint-initdb.d/nacos-mysql.sql
RUN chown -R mysql:mysql /docker-entrypoint-initdb.d/nacos-mysql.sql
EXPOSE 3306
CMD ["mysqld", "--character-set-server=utf8mb4", "--collation-server=utf8mb4_unicode_ci"]
构建
docker build -t hexug.top:10000/nacos/mysql:8.0.30 .
这里是上传到私有仓库,然后push到私有仓库 自行解决
准备配置文件
# application.properties

# spring
server.servlet.contextPath=${SERVER_SERVLET_CONTEXTPATH:/nacos}
server.contextPath=/nacos
server.port=${NACOS_APPLICATION_PORT:8848}
server.tomcat.accesslog.max-days=30
server.tomcat.accesslog.pattern=%h %l %u %t "%r" %s %b %D %{User-Agent}i %{Request-Source}i
server.tomcat.accesslog.enabled=${TOMCAT_ACCESSLOG_ENABLED:false}
server.error.include-message=ALWAYS
# default current work dir
server.tomcat.basedir=file:.
#*************** Config Module Related Configurations ***************#
### Deprecated configuration property, it is recommended to use `spring.sql.init.platform` replaced.
#spring.datasource.platform=${SPRING_DATASOURCE_PLATFORM:}
spring.sql.init.platform=${SPRING_DATASOURCE_PLATFORM:}
nacos.cmdb.dumpTaskInterval=3600
nacos.cmdb.eventTaskInterval=10
nacos.cmdb.labelTaskInterval=300
nacos.cmdb.loadDataAtStart=false
db.num=${MYSQL_DATABASE_NUM:1}
db.url.0=jdbc:mysql://${MYSQL_SERVICE_HOST}:${MYSQL_SERVICE_PORT:3306}/${MYSQL_SERVICE_DB_NAME}?${MYSQL_SERVICE_DB_PARAM:characterEncoding=utf8&connectTimeout=1000&socketTimeout=3000&autoReconnect=true&useSSL=false}
db.user.0=${MYSQL_SERVICE_USER}
db.password.0=${MYSQL_SERVICE_PASSWORD}
## DB connection pool settings
db.pool.config.connectionTimeout=${DB_POOL_CONNECTION_TIMEOUT:30000}
db.pool.config.validationTimeout=10000
db.pool.config.maximumPoolSize=20
db.pool.config.minimumIdle=2
### The auth system to use, currently only 'nacos' and 'ldap' is supported:
nacos.core.auth.system.type=${NACOS_AUTH_SYSTEM_TYPE:nacos}
### worked when nacos.core.auth.system.type=nacos
### The token expiration in seconds:
nacos.core.auth.plugin.nacos.token.expire.seconds=${NACOS_AUTH_TOKEN_EXPIRE_SECONDS:18000}
# 开启缓存
nacos.core.auth.plugin.nacos.token.cache.enable=true
### The default token:
nacos.core.auth.plugin.nacos.token.secret.key=${NACOS_AUTH_TOKEN:}
### Turn on/off caching of auth information. By turning on this switch, the update of auth information would have a 15 seconds delay.
nacos.core.auth.caching.enabled=${NACOS_AUTH_CACHE_ENABLE:false}
nacos.core.auth.enable.userAgentAuthWhite=${NACOS_AUTH_USER_AGENT_AUTH_WHITE_ENABLE:false}
nacos.core.auth.server.identity.key=${NACOS_AUTH_IDENTITY_KEY:}
nacos.core.auth.server.identity.value=${NACOS_AUTH_IDENTITY_VALUE:}
## spring security config
### turn off security
nacos.security.ignore.urls=${NACOS_SECURITY_IGNORE_URLS:/,/error,/**/*.css,/**/*.js,/**/*.html,/**/*.map,/**/*.svg,/**/*.png,/**/*.ico,/console-fe/public/**,/v1/auth/**,/v1/console/health/**,/actuator/**,/v1/console/server/**}
# metrics for elastic search
# 开启prometheus指标收集
management.endpoints.web.exposure.include=prometheus,health
management.metrics.export.elastic.enabled=false
management.metrics.export.influx.enabled=false
nacos.naming.distro.taskDispatchThreadCount=10
nacos.naming.distro.taskDispatchPeriod=200
nacos.naming.distro.batchSyncKeyCount=1000
nacos.naming.distro.initDataRatio=0.9
nacos.naming.distro.syncRetryDelay=5000
nacos.naming.data.warmup=true
nacos.console.ui.enabled=true
nacos.core.param.check.enabled=true
准备prometheus的配置文件
# prometheus-standalone.yaml

# my global config
global:
  scrape_interval:     15s # Set the scrape interval to every 15 seconds. Default is every 1 minute.
  evaluation_interval: 15s # Evaluate rules every 15 seconds. The default is every 1 minute.
  # scrape_timeout is set to the global default (10s).

# Alertmanager configuration
alerting:
  alertmanagers:
    - static_configs:
        - targets:
          # - alertmanager:9093

# Load rules once and periodically evaluate them according to the global 'evaluation_interval'.
rule_files:
# - "first_rules.yml"
# - "second_rules.yml"

# A scrape configuration containing exactly one endpoint to scrape:
# Here it's Prometheus itself.
scrape_configs:
  # The job name is added as a label `job=<job_name>` to any timeseries scraped from this config.
  - job_name: 'prometheus'

    # metrics_path defaults to '/metrics'
    # scheme defaults to 'http'.

    static_configs:
      - targets: ['localhost:9090']

  - job_name: 'nacos'
    metrics_path: '/nacos/actuator/prometheus'
    static_configs:
      - targets: ['nacos:8848']
准备资源清单文件
# docker-compose.yaml
networks:
  nacos_net:
    driver: bridge
services:
  nacos:
    image: nacos/nacos-server:v2.5.1
    container_name: nacos
    environment:
      - PREFER_HOST_MODE=hostname
      - MODE=standalone
      - SPRING_DATASOURCE_PLATFORM=mysql
      - MYSQL_SERVICE_HOST=mysql
      - MYSQL_SERVICE_DB_NAME=nacos
      - MYSQL_SERVICE_PORT=3306
      - MYSQL_SERVICE_USER=nacos
      - MYSQL_SERVICE_PASSWORD=nacos
      - MYSQL_SERVICE_DB_PARAM=characterEncoding=utf8&connectTimeout=1000&socketTimeout=3000&autoReconnect=true&useUnicode=true&useSSL=false&serverTimezone=Asia/Shanghai&allowPublicKeyRetrieval=true
      # 开启认证部分
      - NACOS_AUTH_IDENTITY_KEY=2222
      - NACOS_AUTH_IDENTITY_VALUE=2xxx
      - NACOS_AUTH_TOKEN=SecretKey012345678901234567890123456789012345678901234567890123456789
      - NACOS_AUTH_ENABLE=true
      - NACOS_AUTH_TOKEN_EXPIRE_SECONDS=18000 #单位秒
      - NACOS_AUTH_CACHE_ENABLE=true
    volumes:
      - ./standalone-logs/:/home/nacos/logs
      - ./application.properties:/home/nacos/conf/application.properties
    ports:
      - "8848:8848"
      - "9848:9848"
    depends_on:
      mysql:
        condition: service_healthy
    restart: always
    networks:
      - nacos_net
  mysql:
    container_name: mysql
    image: hexug.top:10000/nacos/mysql:8.0.30
    environment:
      - MYSQL_ROOT_PASSWORD=root
      - MYSQL_DATABASE=nacos
      - MYSQL_USER=nacos
      - MYSQL_PASSWORD=nacos
      - LANG=C.UTF-8
    volumes:
      - ./mysql:/var/lib/mysql
    healthcheck:
      test: [ "CMD", "mysqladmin" ,"ping", "-h", "localhost" ]
      interval: 5s
      timeout: 10s
      retries: 10
    networks:
      - nacos_net
  prometheus:
    container_name: prometheus
    image: prom/prometheus:v3.2.1
    volumes:
      - ./prometheus-standalone.yaml:/etc/prometheus/prometheus.yml
    ports:
      - "9090:9090"
    depends_on:
      - nacos
    restart: always
    networks:
      - nacos_net
  grafana:
    container_name: grafana
    image: grafana/grafana:11.6.0
    user: "0"
    volumes:
      - ./grafana:/var/lib/grafana
    ports:
      - 3000:3000
    restart: always
    networks:
      - nacos_net
部署
docker compose up -d
prometheus部分
监控参考 https://nacos.io/docs/latest/guide/admin/monitor-guide/
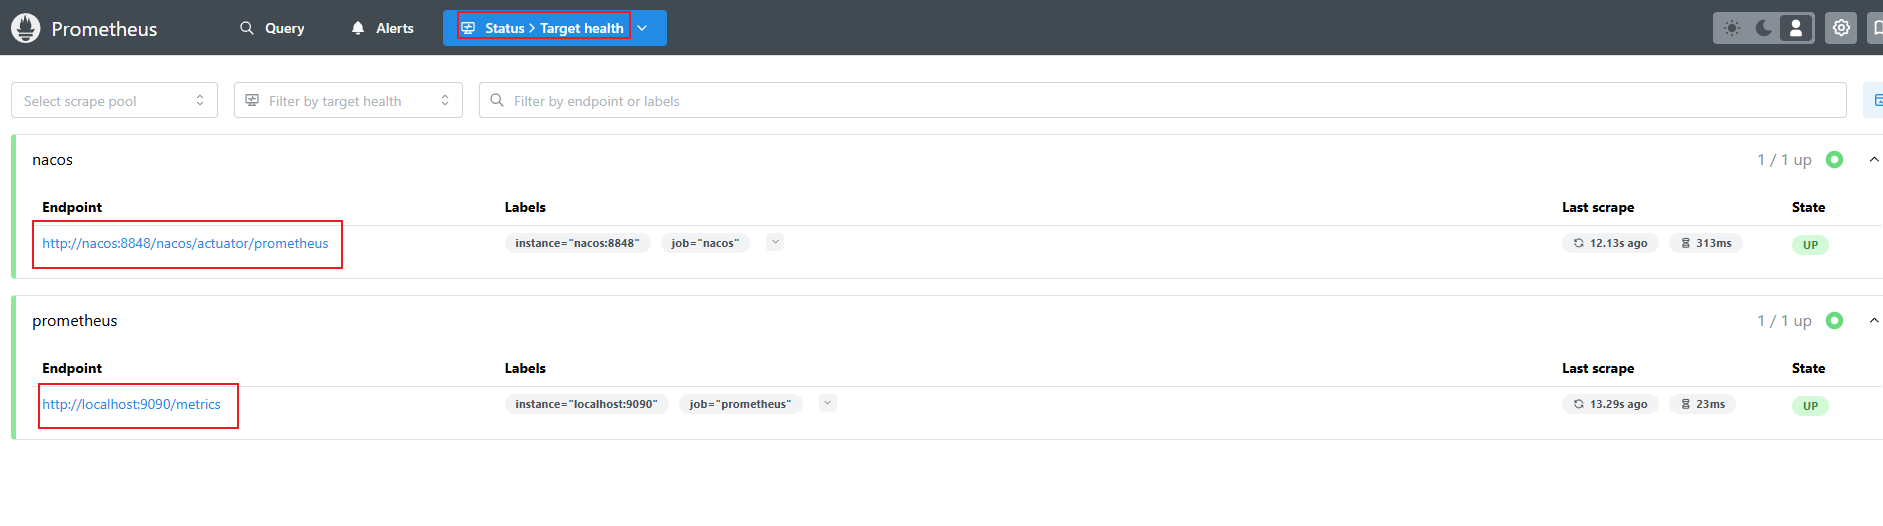
访问 http://10.1.0.153:9090/ 就可以访问到prometheus的ui界面
指标含义 https://nacos.io/docs/latest/guide/admin/monitor-guide/#nacos-metrics含义
jvm metrics
| 指标 | 含义 |
|---|---|
| system_cpu_usage | CPU使用率 |
| system_load_average_1m | load |
| jvm_memory_used_bytes | 内存使用字节,包含各种内存区 |
| jvm_memory_max_bytes | 内存最大字节,包含各种内存区 |
| jvm_gc_pause_seconds_count | gc次数,包含各种gc |
| jvm_gc_pause_seconds_sum | gc耗时,包含各种gc |
| jvm_threads_daemon | 线程数 |
Nacos 监控指标
| 指标 | 含义 |
|---|---|
| http_server_requests_seconds_count | http请求次数,包括多种(url,方法,code) |
| http_server_requests_seconds_sum | http请求总耗时,包括多种(url,方法,code) |
| nacos_timer_seconds_sum | Nacos config水平通知耗时 |
| nacos_timer_seconds_count | Nacos config水平通知次数 |
| grpc_server_requests_seconds_max | Nacos grpc请求处理情况记录 |
| grpc_server_executor | Nacos grpc服务器线程池的最大线程数 |
| grpc_server_executor | Nacos grpc服务器线程池的核心线程数 |
| grpc_server_executor | Nacos grpc服务器线程池的任务数量 |
| grpc_server_executor | Nacos grpc服务器线程池当前线程数量 |
| grpc_server_executor | Nacos grpc服务器线程池当前活跃的线程数量 |
| grpc_server_executor | Nacos grpc服务器线程池完成的任务数量 |
| grpc_server_executor | Nacos grpc服务器线程池在任务队列中的任务数量 |
| nacos_monitor | Nacos config长连接数 |
| nacos_monitor | Nacos config配置个数 |
| nacos_monitor | Nacos config配置落盘任务堆积数 |
| nacos_monitor | Nacos config配置水平通知任务堆积数 |
| nacos_monitor | Nacos config读配置统计数 |
| nacos_monitor | Nacos config写配置统计数 |
| nacos_monitor | Nacos naming ip个数 |
| nacos_monitor | Nacos naming域名个数(1.x 版本) |
| nacos_monitor | Nacos naming域名个数(2.x 版本) |
| nacos_monitor | Nacos naming推送失败数 |
| nacos_monitor | Nacos naming平均推送耗时(ms) |
| nacos_monitor | Nacos naming角色状态 |
| nacos_monitor | Nacos naming最大推送耗时(ms) |
| nacos_monitor | Nacos naming mysql健康检查次数 |
| nacos_monitor | Nacos naming http健康检查次数 |
| nacos_monitor | Nacos naming tcp健康检查次数 |
| nacos_monitor | Nacos基于模块划分的连接数量 |
nacos 异常指标
| 指标 | 含义 |
|---|---|
| nacos_exception_total | 数据库异常 |
| nacos_exception_total | Nacos config水平通知失败 |
| nacos_exception_total | Nacos config server之间健康检查异常 |
| nacos_exception_total | Nacos naming写磁盘异常 |
| nacos_exception_total | Nacos naming leader发送心跳异常 |
| nacos_exception_total | 请求参数不合法 |
| nacos_exception_total | Nacos请求响应内部错误异常(读写失败,没权限,参数错误) |
client metrics
| 指标 | 含义 |
|---|---|
| nacos_monitor | 订阅的服务数 |
| nacos_monitor | 发布的服务数 |
| nacos_monitor | 监听的配置数 |
| nacos_client_request_seconds_count | 请求的次数,包括多种(url,方法,code) |
| nacos_client_request_seconds_sum | 请求的总耗时,包括多种(url,方法,code) |
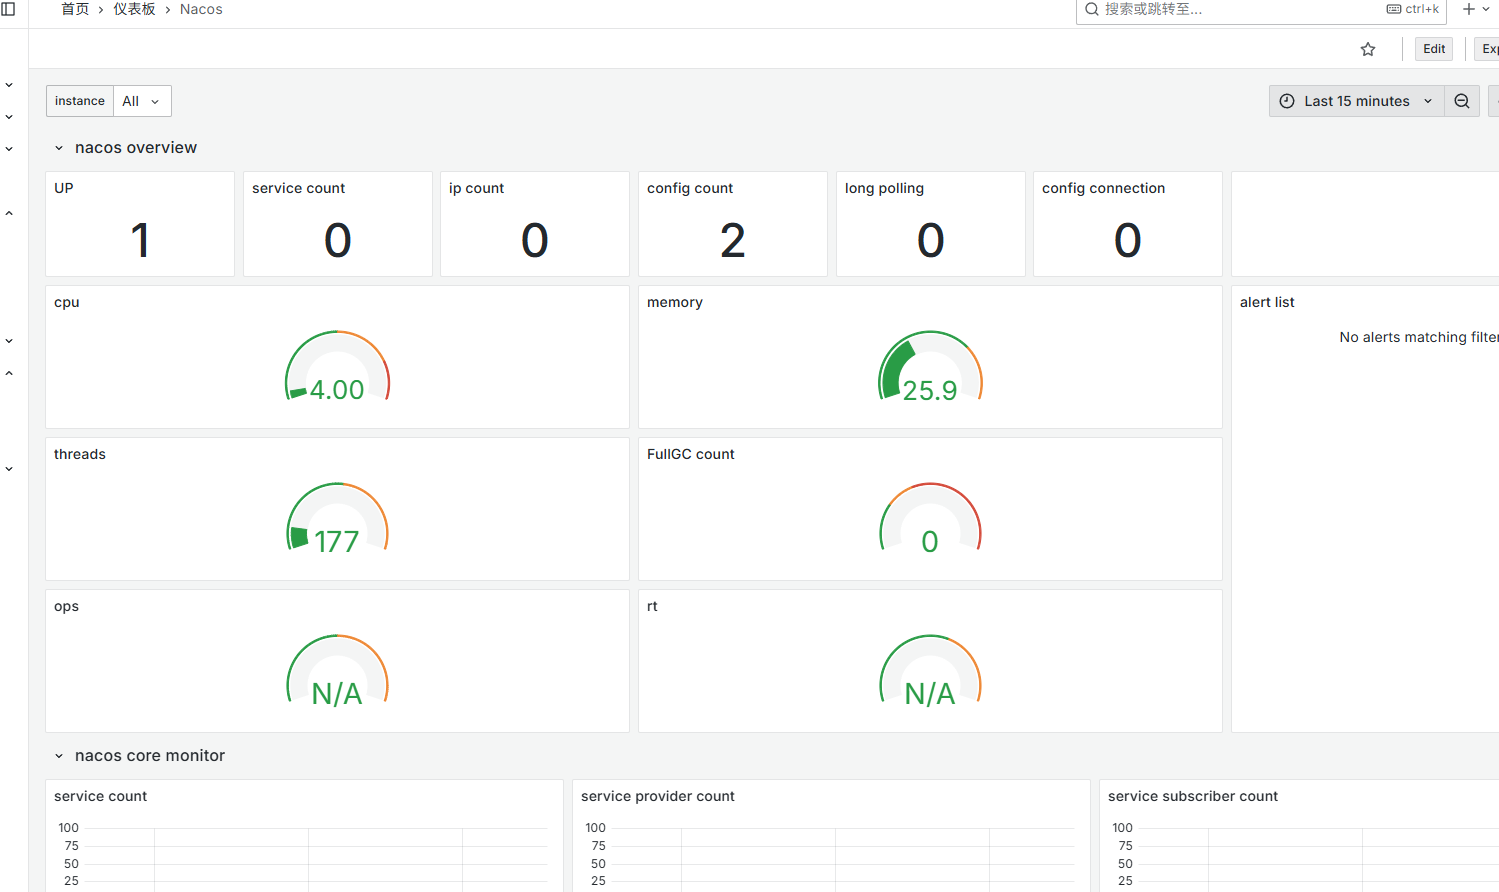
grafana部分
http://10.1.0.153:3000/
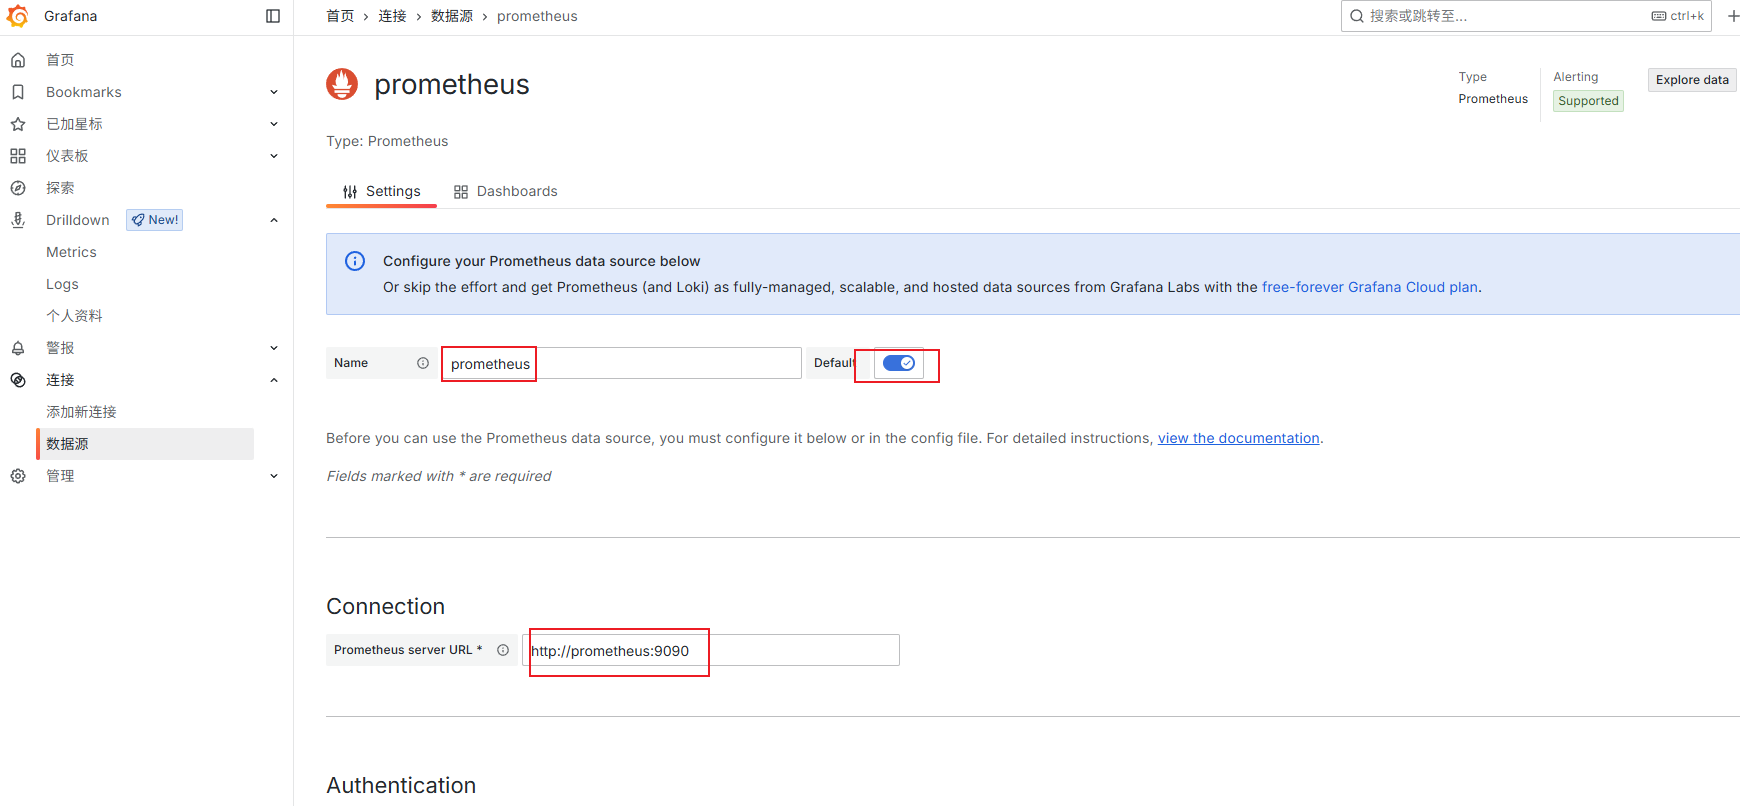
数据源一定要添加 http://prometheus:9090
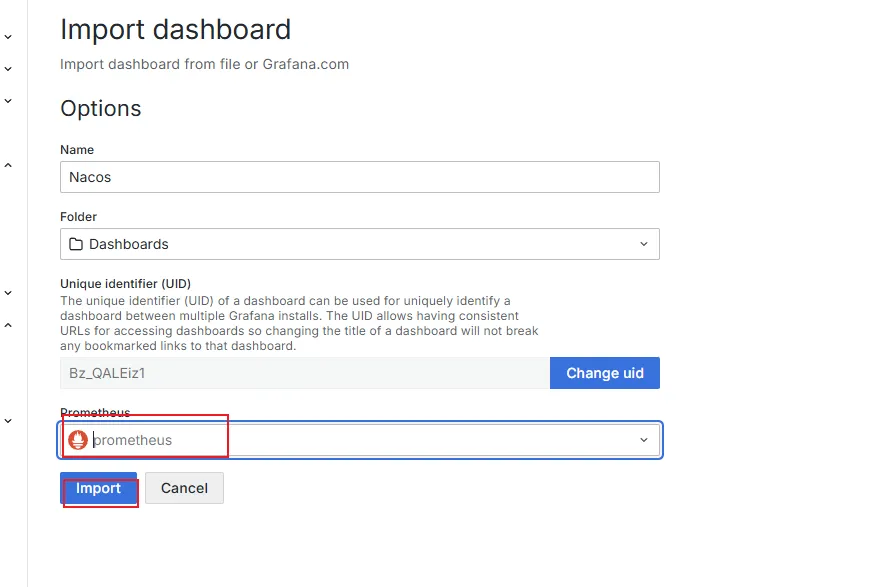
添加模板
参考 https://github.com/nacos-group/nacos-template/blob/master/nacos-grafana-upper-2.4.json?spm=5238cd80.3daecc1a.0.0.367741b3Qm9uy7&file=nacos-grafana-upper-2.4.json

点击展开/折叠 仪表盘模板 代码
{
"__inputs": [
{
"name": "DS_PROMETHEUS",
"label": "Prometheus",
"description": "",
"type": "datasource",
"pluginId": "prometheus",
"pluginName": "Prometheus"
}
],
"annotations": {
"list": [
{
"builtIn": 1,
"datasource": {
"type": "datasource",
"uid": "grafana"
},
"enable": true,
"hide": true,
"iconColor": "rgba(0, 211, 255, 1)",
"name": "Annotations & Alerts",
"type": "dashboard"
}
]
},
"editable": true,
"fiscalYearStartMonth": 0,
"graphTooltip": 0,
"id": 1,
"links": [],
"panels": [
{
"collapsed": false,
"datasource": {
"type": "datasource",
"uid": "grafana"
},
"gridPos": {
"h": 1,
"w": 24,
"x": 0,
"y": 0
},
"id": 80,
"panels": [],
"targets": [
{
"datasource": {
"type": "datasource",
"uid": "grafana"
},
"refId": "A"
}
],
"title": "nacos overview",
"type": "row"
},
{
"datasource": "${DS_PROMETHEUS}",
"fieldConfig": {
"defaults": {
"color": {
"mode": "thresholds"
},
"mappings": [
{
"options": {
"match": "null",
"result": {
"text": "N/A"
}
},
"type": "special"
}
],
"thresholds": {
"mode": "absolute",
"steps": [
{
"color": "green",
"value": null
},
{
"color": "red",
"value": 80
}
]
},
"unit": "none"
},
"overrides": []
},
"gridPos": {
"h": 3,
"w": 3,
"x": 0,
"y": 1
},
"id": 89,
"maxDataPoints": 100,
"options": {
"colorMode": "none",
"graphMode": "none",
"justifyMode": "auto",
"orientation": "horizontal",
"reduceOptions": {
"calcs": [
"lastNotNull"
],
"fields": "",
"values": false
},
"showPercentChange": false,
"textMode": "auto",
"wideLayout": true
},
"pluginVersion": "10.4.2",
"targets": [
{
"datasource": "${DS_PROMETHEUS}",
"editorMode": "code",
"expr": "count(nacos_monitor{name=\"configCount\",instance=~'$instance'})",
"format": "time_series",
"intervalFactor": 1,
"range": true,
"refId": "A"
}
],
"title": "UP",
"type": "stat"
},
{
"datasource": "${DS_PROMETHEUS}",
"fieldConfig": {
"defaults": {
"color": {
"mode": "thresholds"
},
"mappings": [
{
"options": {
"match": "null",
"result": {
"text": "N/A"
}
},
"type": "special"
}
],
"thresholds": {
"mode": "absolute",
"steps": [
{
"color": "green",
"value": null
},
{
"color": "red",
"value": 80
}
]
},
"unit": "none"
},
"overrides": []
},
"gridPos": {
"h": 3,
"w": 3,
"x": 3,
"y": 1
},
"id": 90,
"maxDataPoints": 100,
"options": {
"colorMode": "none",
"graphMode": "none",
"justifyMode": "auto",
"orientation": "horizontal",
"reduceOptions": {
"calcs": [
"lastNotNull"
],
"fields": "",
"values": false
},
"showPercentChange": false,
"textMode": "auto",
"wideLayout": true
},
"pluginVersion": "10.4.2",
"targets": [
{
"datasource": "${DS_PROMETHEUS}",
"editorMode": "code",
"expr": "max(nacos_monitor{name='serviceCount',instance=~'$instance'})",
"format": "time_series",
"intervalFactor": 1,
"range": true,
"refId": "A"
}
],
"title": "service count",
"type": "stat"
},
{
"datasource": "${DS_PROMETHEUS}",
"fieldConfig": {
"defaults": {
"color": {
"mode": "thresholds"
},
"mappings": [
{
"options": {
"match": "null",
"result": {
"text": "N/A"
}
},
"type": "special"
}
],
"thresholds": {
"mode": "absolute",
"steps": [
{
"color": "green",
"value": null
},
{
"color": "red",
"value": 80
}
]
},
"unit": "none"
},
"overrides": []
},
"gridPos": {
"h": 3,
"w": 3,
"x": 6,
"y": 1
},
"id": 93,
"maxDataPoints": 100,
"options": {
"colorMode": "none",
"graphMode": "none",
"justifyMode": "auto",
"orientation": "horizontal",
"reduceOptions": {
"calcs": [
"lastNotNull"
],
"fields": "",
"values": false
},
"showPercentChange": false,
"textMode": "auto",
"wideLayout": true
},
"pluginVersion": "10.4.2",
"targets": [
{
"datasource": "${DS_PROMETHEUS}",
"editorMode": "code",
"expr": "max(nacos_monitor{name='ipCount',instance=~'$instance'})",
"format": "time_series",
"intervalFactor": 1,
"range": true,
"refId": "A"
}
],
"title": "ip count",
"type": "stat"
},
{
"datasource": "${DS_PROMETHEUS}",
"fieldConfig": {
"defaults": {
"color": {
"mode": "thresholds"
},
"mappings": [
{
"options": {
"match": "null",
"result": {
"text": "N/A"
}
},
"type": "special"
}
],
"thresholds": {
"mode": "absolute",
"steps": [
{
"color": "green",
"value": null
},
{
"color": "red",
"value": 80
}
]
},
"unit": "none"
},
"overrides": []
},
"gridPos": {
"h": 3,
"w": 3,
"x": 9,
"y": 1
},
"id": 92,
"maxDataPoints": 100,
"options": {
"colorMode": "none",
"graphMode": "none",
"justifyMode": "auto",
"orientation": "horizontal",
"reduceOptions": {
"calcs": [
"lastNotNull"
],
"fields": "",
"values": false
},
"showPercentChange": false,
"textMode": "auto",
"wideLayout": true
},
"pluginVersion": "10.4.2",
"targets": [
{
"datasource": "${DS_PROMETHEUS}",
"expr": "max(nacos_monitor{name='configCount', instance=~'$instance'})",
"format": "time_series",
"intervalFactor": 1,
"refId": "A"
}
],
"title": "config count",
"type": "stat"
},
{
"datasource": "${DS_PROMETHEUS}",
"fieldConfig": {
"defaults": {
"color": {
"mode": "thresholds"
},
"mappings": [
{
"options": {
"match": "null",
"result": {
"text": "N/A"
}
},
"type": "special"
}
],
"thresholds": {
"mode": "absolute",
"steps": [
{
"color": "green",
"value": null
},
{
"color": "red",
"value": 80
}
]
},
"unit": "none"
},
"overrides": []
},
"gridPos": {
"h": 3,
"w": 3,
"x": 12,
"y": 1
},
"id": 91,
"maxDataPoints": 100,
"options": {
"colorMode": "none",
"graphMode": "none",
"justifyMode": "auto",
"orientation": "horizontal",
"reduceOptions": {
"calcs": [
"lastNotNull"
],
"fields": "",
"values": false
},
"showPercentChange": false,
"textMode": "auto",
"wideLayout": true
},
"pluginVersion": "10.4.2",
"targets": [
{
"datasource": "${DS_PROMETHEUS}",
"editorMode": "code",
"expr": "sum(nacos_monitor{name='longPolling',instance=~'$instance'})",
"format": "time_series",
"intervalFactor": 1,
"range": true,
"refId": "A"
}
],
"title": "long polling",
"type": "stat"
},
{
"datasource": "${DS_PROMETHEUS}",
"fieldConfig": {
"defaults": {
"color": {
"mode": "thresholds"
},
"mappings": [
{
"options": {
"match": "null",
"result": {
"text": "N/A"
}
},
"type": "special"
}
],
"thresholds": {
"mode": "absolute",
"steps": [
{
"color": "green",
"value": null
},
{
"color": "red",
"value": 80
}
]
},
"unit": "none"
},
"overrides": []
},
"gridPos": {
"h": 3,
"w": 3,
"x": 15,
"y": 1
},
"id": 88,
"maxDataPoints": 100,
"options": {
"colorMode": "none",
"graphMode": "none",
"justifyMode": "auto",
"orientation": "horizontal",
"reduceOptions": {
"calcs": [
"lastNotNull"
],
"fields": "",
"values": false
},
"showPercentChange": false,
"textMode": "auto",
"wideLayout": true
},
"pluginVersion": "10.4.2",
"targets": [
{
"datasource": "${DS_PROMETHEUS}",
"editorMode": "code",
"expr": "sum(nacos_monitor{name='longConnection', instance=~'$instance'}) by (name)",
"format": "time_series",
"intervalFactor": 1,
"range": true,
"refId": "A"
}
],
"title": "config connection",
"type": "stat"
},
{
"datasource": {
"type": "datasource",
"uid": "grafana"
},
"gridPos": {
"h": 3,
"w": 6,
"x": 18,
"y": 1
},
"id": 82,
"options": {
"code": {
"language": "plaintext",
"showLineNumbers": false,
"showMiniMap": false
},
"content": "
\n\n\n![]() \n\n
\n\n ",
"mode": "html"
},
"pluginVersion": "10.4.2",
"targets": [
{
"datasource": {
"type": "datasource",
"uid": "grafana"
},
"refId": "A"
}
],
"type": "text"
},
{
"datasource": "${DS_PROMETHEUS}",
"fieldConfig": {
"defaults": {
"color": {
"mode": "thresholds"
},
"mappings": [
{
"options": {
"match": "null",
"result": {
"text": "N/A"
}
},
"type": "special"
}
],
"max": 100,
"min": 0,
"thresholds": {
"mode": "absolute",
"steps": [
{
"color": "#299c46",
"value": null
},
{
"color": "rgba(237, 129, 40, 0.89)",
"value": 50
},
{
"color": "#d44a3a",
"value": 80
}
]
},
"unit": "none"
},
"overrides": []
},
"gridPos": {
"h": 4,
"w": 9,
"x": 0,
"y": 4
},
"id": 33,
"interval": "",
"maxDataPoints": 100,
"options": {
"minVizHeight": 75,
"minVizWidth": 75,
"orientation": "horizontal",
"reduceOptions": {
"calcs": [
"lastNotNull"
],
"fields": "",
"values": false
},
"showThresholdLabels": false,
"showThresholdMarkers": true,
"sizing": "auto"
},
"pluginVersion": "10.4.2",
"repeatDirection": "h",
"targets": [
{
"datasource": "${DS_PROMETHEUS}",
"expr": "max(system_cpu_usage{instance=~'$instance'}) * 100",
"format": "time_series",
"interval": "",
"intervalFactor": 1,
"legendFormat": "",
"refId": "A"
}
],
"title": "cpu",
"type": "gauge"
},
{
"datasource": "${DS_PROMETHEUS}",
"fieldConfig": {
"defaults": {
"color": {
"mode": "thresholds"
},
"mappings": [
{
"options": {
"match": "null",
"result": {
"text": "N/A"
}
},
"type": "special"
}
],
"max": 70,
"min": 0,
"thresholds": {
"mode": "absolute",
"steps": [
{
"color": "#299c46",
"value": null
},
{
"color": "rgba(237, 129, 40, 0.89)",
"value": 50
},
{
"color": "#d44a3a",
"value": 70
}
]
},
"unit": "none"
},
"overrides": []
},
"gridPos": {
"h": 4,
"w": 9,
"x": 9,
"y": 4
},
"id": 32,
"maxDataPoints": 100,
"options": {
"minVizHeight": 75,
"minVizWidth": 75,
"orientation": "horizontal",
"reduceOptions": {
"calcs": [
"lastNotNull"
],
"fields": "",
"values": false
},
"showThresholdLabels": false,
"showThresholdMarkers": true,
"sizing": "auto"
},
"pluginVersion": "10.4.2",
"targets": [
{
"datasource": "${DS_PROMETHEUS}",
"expr": "sum(jvm_memory_used_bytes{area=\"heap\", instance=~'$instance'})/sum(jvm_memory_max_bytes{area=\"heap\", instance=~'$instance'}) * 100",
"format": "time_series",
"intervalFactor": 1,
"refId": "A"
}
],
"title": "memory",
"type": "gauge"
},
{
"dashboardFilter": "",
"datasource": {
"type": "datasource",
"uid": "grafana"
},
"gridPos": {
"h": 12,
"w": 6,
"x": 18,
"y": 4
},
"id": 48,
"limit": 10,
"nameFilter": "",
"onlyAlertsOnDashboard": false,
"options": {
"alertInstanceLabelFilter": "",
"alertName": "",
"dashboardAlerts": false,
"groupBy": [],
"groupMode": "default",
"maxItems": 20,
"sortOrder": 1,
"stateFilter": {
"error": true,
"firing": true,
"noData": false,
"normal": false,
"pending": true
},
"viewMode": "list"
},
"show": "current",
"sortOrder": 1,
"stateFilter": [],
"targets": [
{
"datasource": {
"type": "datasource",
"uid": "grafana"
},
"refId": "A"
}
],
"title": "alert list",
"type": "alertlist"
},
{
"datasource": "${DS_PROMETHEUS}",
"fieldConfig": {
"defaults": {
"color": {
"mode": "thresholds"
},
"mappings": [
{
"options": {
"match": "null",
"result": {
"text": "N/A"
}
},
"type": "special"
}
],
"max": 1500,
"min": 0,
"thresholds": {
"mode": "absolute",
"steps": [
{
"color": "#299c46",
"value": null
},
{
"color": "rgba(237, 129, 40, 0.89)",
"value": 800
},
{
"color": "#d44a3a",
"value": 1500
}
]
},
"unit": "none"
},
"overrides": []
},
"gridPos": {
"h": 4,
"w": 9,
"x": 0,
"y": 8
},
"id": 29,
"maxDataPoints": 100,
"options": {
"minVizHeight": 75,
"minVizWidth": 75,
"orientation": "horizontal",
"reduceOptions": {
"calcs": [
"lastNotNull"
],
"fields": "",
"values": false
},
"showThresholdLabels": false,
"showThresholdMarkers": true,
"sizing": "auto"
},
"pluginVersion": "10.4.2",
"targets": [
{
"datasource": "${DS_PROMETHEUS}",
"expr": "max(jvm_threads_daemon_threads{instance=~'$instance'})",
"format": "time_series",
"intervalFactor": 1,
"refId": "A"
}
],
"title": "threads",
"type": "gauge"
},
{
"datasource": "${DS_PROMETHEUS}",
"fieldConfig": {
"defaults": {
"color": {
"mode": "thresholds"
},
"mappings": [
{
"options": {
"match": "null",
"result": {
"index": 0,
"text": "0"
}
},
"type": "special"
}
],
"max": 20,
"min": 0,
"noValue": "0",
"thresholds": {
"mode": "absolute",
"steps": [
{
"color": "#299c46",
"value": null
},
{
"color": "rgba(237, 129, 40, 0.89)",
"value": 5
},
{
"color": "#d44a3a",
"value": 8
}
]
},
"unit": "none"
},
"overrides": []
},
"gridPos": {
"h": 4,
"w": 9,
"x": 9,
"y": 8
},
"id": 30,
"maxDataPoints": 100,
"options": {
"minVizHeight": 75,
"minVizWidth": 75,
"orientation": "horizontal",
"reduceOptions": {
"calcs": [
"lastNotNull"
],
"fields": "",
"values": false
},
"showThresholdLabels": false,
"showThresholdMarkers": true,
"sizing": "auto"
},
"pluginVersion": "10.4.2",
"targets": [
{
"datasource": "${DS_PROMETHEUS}",
"editorMode": "code",
"expr": "sum(increase(jvm_gc_pause_seconds_count{action=\"end of major GC\",instance=~'$instance'}[1m]))",
"format": "time_series",
"intervalFactor": 1,
"range": true,
"refId": "A"
}
],
"title": "FullGC count",
"type": "gauge"
},
{
"datasource": "${DS_PROMETHEUS}",
"fieldConfig": {
"defaults": {
"color": {
"mode": "thresholds"
},
"mappings": [
{
"options": {
"match": "null",
"result": {
"text": "N/A"
}
},
"type": "special"
}
],
"max": 2000,
"min": 0,
"thresholds": {
"mode": "absolute",
"steps": [
{
"color": "#299c46",
"value": null
},
{
"color": "rgba(237, 129, 40, 0.89)",
"value": 1000
},
{
"color": "#d44a3a",
"value": 2000
}
]
},
"unit": "none"
},
"overrides": []
},
"gridPos": {
"h": 4,
"w": 9,
"x": 0,
"y": 12
},
"id": 25,
"maxDataPoints": 100,
"options": {
"minVizHeight": 75,
"minVizWidth": 75,
"orientation": "horizontal",
"reduceOptions": {
"calcs": [
"lastNotNull"
],
"fields": "",
"values": false
},
"showThresholdLabels": false,
"showThresholdMarkers": true,
"sizing": "auto"
},
"pluginVersion": "10.4.2",
"targets": [
{
"datasource": "${DS_PROMETHEUS}",
"editorMode": "code",
"expr": "sum(rate(http_server_requests_seconds_count{instance=~'$instance'}[1m])) + sum(rate(grpc_server_requests_seconds_count{instance=~'$instance'}[1m]))",
"format": "time_series",
"intervalFactor": 1,
"legendFormat": "",
"range": true,
"refId": "A"
}
],
"title": "ops",
"type": "gauge"
},
{
"datasource": "${DS_PROMETHEUS}",
"fieldConfig": {
"defaults": {
"color": {
"mode": "thresholds"
},
"mappings": [
{
"options": {
"match": "null",
"result": {
"text": "N/A"
}
},
"type": "special"
}
],
"max": 5000,
"min": 0,
"thresholds": {
"mode": "absolute",
"steps": [
{
"color": "#299c46",
"value": null
},
{
"color": "rgba(237, 129, 40, 0.89)",
"value": 3000
},
{
"color": "#d44a3a",
"value": 5000
}
]
},
"unit": "none"
},
"overrides": []
},
"gridPos": {
"h": 4,
"w": 9,
"x": 9,
"y": 12
},
"id": 26,
"maxDataPoints": 100,
"options": {
"minVizHeight": 75,
"minVizWidth": 75,
"orientation": "horizontal",
"reduceOptions": {
"calcs": [
"lastNotNull"
],
"fields": "",
"values": false
},
"showThresholdLabels": false,
"showThresholdMarkers": true,
"sizing": "auto"
},
"pluginVersion": "10.4.2",
"targets": [
{
"datasource": "${DS_PROMETHEUS}",
"editorMode": "code",
"expr": "(sum(rate(http_server_requests_seconds_sum{instance=~'$instance'}[1m]))/sum(rate(http_server_requests_seconds_count{instance=~'$instance'}[1m])) * 1000 + sum(rate(grpc_server_requests_seconds_sum{instance=~'$instance'}[1m]))/sum(rate(grpc_server_requests_seconds_count{instance=~'$instance'}[1m])) * 1000) / 2",
"format": "time_series",
"intervalFactor": 1,
"legendFormat": "",
"range": true,
"refId": "A"
}
],
"title": "rt",
"type": "gauge"
},
{
"collapsed": false,
"datasource": {
"type": "datasource",
"uid": "grafana"
},
"gridPos": {
"h": 1,
"w": 24,
"x": 0,
"y": 16
},
"id": 78,
"panels": [],
"targets": [
{
"datasource": {
"type": "datasource",
"uid": "grafana"
},
"refId": "A"
}
],
"title": "nacos core monitor",
"type": "row"
},
{
"datasource": "${DS_PROMETHEUS}",
"fieldConfig": {
"defaults": {
"color": {
"mode": "palette-classic"
},
"custom": {
"axisBorderShow": false,
"axisCenteredZero": false,
"axisColorMode": "text",
"axisLabel": "",
"axisPlacement": "auto",
"barAlignment": 0,
"drawStyle": "line",
"fillOpacity": 10,
"gradientMode": "none",
"hideFrom": {
"legend": false,
"tooltip": false,
"viz": false
},
"insertNulls": false,
"lineInterpolation": "linear",
"lineWidth": 1,
"pointSize": 5,
"scaleDistribution": {
"type": "linear"
},
"showPoints": "never",
"spanNulls": false,
"stacking": {
"group": "A",
"mode": "none"
},
"thresholdsStyle": {
"mode": "off"
}
},
"mappings": [],
"thresholds": {
"mode": "absolute",
"steps": [
{
"color": "green",
"value": null
},
{
"color": "red",
"value": 80
}
]
},
"unit": "short"
},
"overrides": []
},
"gridPos": {
"h": 5,
"w": 8,
"x": 0,
"y": 17
},
"id": 95,
"options": {
"legend": {
"calcs": [],
"displayMode": "list",
"placement": "bottom",
"showLegend": true
},
"tooltip": {
"mode": "multi",
"sort": "none"
}
},
"pluginVersion": "10.4.2",
"targets": [
{
"datasource": "${DS_PROMETHEUS}",
"editorMode": "code",
"expr": "max(nacos_monitor{name='serviceCount',instance=~'$instance'})",
"format": "time_series",
"intervalFactor": 1,
"legendFormat": "service count",
"range": true,
"refId": "A"
}
],
"title": "service count",
"type": "timeseries"
},
{
"datasource": "${DS_PROMETHEUS}",
"fieldConfig": {
"defaults": {
"color": {
"mode": "palette-classic"
},
"custom": {
"axisBorderShow": false,
"axisCenteredZero": false,
"axisColorMode": "text",
"axisLabel": "",
"axisPlacement": "auto",
"barAlignment": 0,
"drawStyle": "line",
"fillOpacity": 10,
"gradientMode": "none",
"hideFrom": {
"legend": false,
"tooltip": false,
"viz": false
},
"insertNulls": false,
"lineInterpolation": "linear",
"lineWidth": 1,
"pointSize": 5,
"scaleDistribution": {
"type": "linear"
},
"showPoints": "never",
"spanNulls": false,
"stacking": {
"group": "A",
"mode": "none"
},
"thresholdsStyle": {
"mode": "off"
}
},
"mappings": [],
"thresholds": {
"mode": "absolute",
"steps": [
{
"color": "green",
"value": null
},
{
"color": "red",
"value": 80
}
]
},
"unit": "short"
},
"overrides": []
},
"gridPos": {
"h": 5,
"w": 8,
"x": 8,
"y": 17
},
"id": 96,
"options": {
"legend": {
"calcs": [],
"displayMode": "list",
"placement": "bottom",
"showLegend": true
},
"tooltip": {
"mode": "multi",
"sort": "none"
}
},
"pluginVersion": "10.4.2",
"targets": [
{
"datasource": "${DS_PROMETHEUS}",
"editorMode": "code",
"expr": "max(nacos_monitor{name='ipCount',instance=~'$instance'})",
"format": "time_series",
"intervalFactor": 1,
"legendFormat": "provider count",
"range": true,
"refId": "A"
}
],
"title": "service provider count",
"type": "timeseries"
},
{
"datasource": "${DS_PROMETHEUS}",
"fieldConfig": {
"defaults": {
"color": {
"mode": "palette-classic"
},
"custom": {
"axisBorderShow": false,
"axisCenteredZero": false,
"axisColorMode": "text",
"axisLabel": "",
"axisPlacement": "auto",
"barAlignment": 0,
"drawStyle": "line",
"fillOpacity": 10,
"gradientMode": "none",
"hideFrom": {
"legend": false,
"tooltip": false,
"viz": false
},
"insertNulls": false,
"lineInterpolation": "linear",
"lineWidth": 1,
"pointSize": 5,
"scaleDistribution": {
"type": "linear"
},
"showPoints": "never",
"spanNulls": false,
"stacking": {
"group": "A",
"mode": "none"
},
"thresholdsStyle": {
"mode": "off"
}
},
"mappings": [],
"thresholds": {
"mode": "absolute",
"steps": [
{
"color": "green",
"value": null
},
{
"color": "red",
"value": 80
}
]
},
"unit": "short"
},
"overrides": []
},
"gridPos": {
"h": 5,
"w": 8,
"x": 16,
"y": 17
},
"id": 97,
"options": {
"legend": {
"calcs": [],
"displayMode": "list",
"placement": "bottom",
"showLegend": true
},
"tooltip": {
"mode": "multi",
"sort": "none"
}
},
"pluginVersion": "10.4.2",
"targets": [
{
"datasource": "${DS_PROMETHEUS}",
"editorMode": "code",
"expr": "sum(nacos_monitor{name='subscriberCount',instance=~'$instance'})",
"format": "time_series",
"intervalFactor": 1,
"legendFormat": "subscriber count",
"range": true,
"refId": "A"
}
],
"title": "service subscriber count",
"type": "timeseries"
},
{
"datasource": "${DS_PROMETHEUS}",
"fieldConfig": {
"defaults": {
"color": {
"mode": "palette-classic"
},
"custom": {
"axisBorderShow": false,
"axisCenteredZero": false,
"axisColorMode": "text",
"axisLabel": "",
"axisPlacement": "auto",
"barAlignment": 0,
"drawStyle": "line",
"fillOpacity": 10,
"gradientMode": "none",
"hideFrom": {
"legend": false,
"tooltip": false,
"viz": false
},
"insertNulls": false,
"lineInterpolation": "linear",
"lineWidth": 1,
"pointSize": 5,
"scaleDistribution": {
"type": "linear"
},
"showPoints": "never",
"spanNulls": false,
"stacking": {
"group": "A",
"mode": "none"
},
"thresholdsStyle": {
"mode": "off"
}
},
"mappings": [],
"thresholds": {
"mode": "absolute",
"steps": [
{
"color": "green",
"value": null
},
{
"color": "red",
"value": 80
}
]
},
"unit": "short"
},
"overrides": []
},
"gridPos": {
"h": 5,
"w": 8,
"x": 0,
"y": 22
},
"id": 98,
"options": {
"legend": {
"calcs": [],
"displayMode": "list",
"placement": "bottom",
"showLegend": true
},
"tooltip": {
"mode": "multi",
"sort": "none"
}
},
"pluginVersion": "10.4.2",
"targets": [
{
"datasource": "${DS_PROMETHEUS}",
"editorMode": "code",
"expr": "max(nacos_monitor{name='configCount',instance=~'$instance'})",
"format": "time_series",
"intervalFactor": 1,
"legendFormat": "config count",
"range": true,
"refId": "A"
}
],
"title": "config count",
"type": "timeseries"
},
{
"datasource": "${DS_PROMETHEUS}",
"fieldConfig": {
"defaults": {
"color": {
"mode": "palette-classic"
},
"custom": {
"axisBorderShow": false,
"axisCenteredZero": false,
"axisColorMode": "text",
"axisLabel": "",
"axisPlacement": "auto",
"barAlignment": 0,
"drawStyle": "line",
"fillOpacity": 10,
"gradientMode": "none",
"hideFrom": {
"legend": false,
"tooltip": false,
"viz": false
},
"insertNulls": false,
"lineInterpolation": "linear",
"lineWidth": 1,
"pointSize": 5,
"scaleDistribution": {
"type": "linear"
},
"showPoints": "never",
"spanNulls": false,
"stacking": {
"group": "A",
"mode": "none"
},
"thresholdsStyle": {
"mode": "off"
}
},
"mappings": [],
"thresholds": {
"mode": "absolute",
"steps": [
{
"color": "green",
"value": null
},
{
"color": "red",
"value": 80
}
]
},
"unit": "short"
},
"overrides": []
},
"gridPos": {
"h": 5,
"w": 8,
"x": 8,
"y": 22
},
"id": 99,
"options": {
"legend": {
"calcs": [],
"displayMode": "list",
"placement": "bottom",
"showLegend": true
},
"tooltip": {
"mode": "multi",
"sort": "none"
}
},
"pluginVersion": "10.4.2",
"targets": [
{
"datasource": "${DS_PROMETHEUS}",
"editorMode": "code",
"expr": "max(nacos_monitor{name='longPolling',instance=~'$instance'})",
"format": "time_series",
"intervalFactor": 1,
"legendFormat": "config long polling count",
"range": true,
"refId": "A"
}
],
"title": "config long polling count",
"type": "timeseries"
},
{
"datasource": "${DS_PROMETHEUS}",
"fieldConfig": {
"defaults": {
"color": {
"mode": "palette-classic"
},
"custom": {
"axisBorderShow": false,
"axisCenteredZero": false,
"axisColorMode": "text",
"axisLabel": "",
"axisPlacement": "auto",
"barAlignment": 0,
"drawStyle": "line",
"fillOpacity": 10,
"gradientMode": "none",
"hideFrom": {
"legend": false,
"tooltip": false,
"viz": false
},
"insertNulls": false,
"lineInterpolation": "linear",
"lineWidth": 1,
"pointSize": 5,
"scaleDistribution": {
"type": "linear"
},
"showPoints": "never",
"spanNulls": false,
"stacking": {
"group": "A",
"mode": "none"
},
"thresholdsStyle": {
"mode": "off"
}
},
"mappings": [],
"thresholds": {
"mode": "absolute",
"steps": [
{
"color": "green",
"value": null
},
{
"color": "red",
"value": 80
}
]
},
"unit": "short"
},
"overrides": []
},
"gridPos": {
"h": 5,
"w": 8,
"x": 16,
"y": 22
},
"id": 100,
"options": {
"legend": {
"calcs": [],
"displayMode": "list",
"placement": "bottom",
"showLegend": true
},
"tooltip": {
"mode": "multi",
"sort": "none"
}
},
"pluginVersion": "10.4.2",
"targets": [
{
"datasource": "${DS_PROMETHEUS}",
"editorMode": "code",
"expr": "sum(nacos_config_subscriber{instance=~'$instance'}) by (instance)",
"format": "time_series",
"intervalFactor": 1,
"legendFormat": "config listener count",
"range": true,
"refId": "A"
}
],
"title": "config listener count",
"type": "timeseries"
},
{
"datasource": "${DS_PROMETHEUS}",
"fieldConfig": {
"defaults": {
"color": {
"mode": "palette-classic"
},
"custom": {
"axisBorderShow": false,
"axisCenteredZero": false,
"axisColorMode": "text",
"axisLabel": "",
"axisPlacement": "auto",
"barAlignment": 0,
"drawStyle": "line",
"fillOpacity": 10,
"gradientMode": "none",
"hideFrom": {
"legend": false,
"tooltip": false,
"viz": false
},
"insertNulls": false,
"lineInterpolation": "linear",
"lineWidth": 1,
"pointSize": 5,
"scaleDistribution": {
"type": "linear"
},
"showPoints": "never",
"spanNulls": false,
"stacking": {
"group": "A",
"mode": "none"
},
"thresholdsStyle": {
"mode": "off"
}
},
"mappings": [],
"thresholds": {
"mode": "absolute",
"steps": [
{
"color": "green",
"value": null
},
{
"color": "red",
"value": 80
}
]
},
"unit": "ms"
},
"overrides": []
},
"gridPos": {
"h": 5,
"w": 8,
"x": 0,
"y": 27
},
"id": 20,
"options": {
"legend": {
"calcs": [],
"displayMode": "list",
"placement": "bottom",
"showLegend": true
},
"tooltip": {
"mode": "multi",
"sort": "none"
}
},
"pluginVersion": "10.4.2",
"targets": [
{
"datasource": "${DS_PROMETHEUS}",
"editorMode": "code",
"expr": "sum(rate(http_server_requests_seconds_sum{uri=~'.*/cs/configs|.*/ns/instance.*', instance=~'$instance'}[1m])/rate(http_server_requests_seconds_count{uri=~'.*/cs/configs|.*/ns/instance.*', instance=~'$instance'}[1m])) by (method,uri) * 1000 > 0",
"format": "time_series",
"intervalFactor": 1,
"range": true,
"refId": "A"
},
{
"datasource": "${DS_PROMETHEUS}",
"expr": "sum(rate(http_server_requests_seconds_sum{instance=~'$instance'}[1m]))/sum(rate(http_server_requests_seconds_count{instance=~'$instance'}[1m])) * 1000",
"format": "time_series",
"hide": false,
"intervalFactor": 1,
"legendFormat": "all",
"refId": "B"
}
],
"title": "rt (HTTP)",
"type": "timeseries"
},
{
"datasource": "${DS_PROMETHEUS}",
"fieldConfig": {
"defaults": {
"color": {
"mode": "palette-classic"
},
"custom": {
"axisBorderShow": false,
"axisCenteredZero": false,
"axisColorMode": "text",
"axisLabel": "",
"axisPlacement": "auto",
"barAlignment": 0,
"drawStyle": "line",
"fillOpacity": 10,
"gradientMode": "none",
"hideFrom": {
"legend": false,
"tooltip": false,
"viz": false
},
"insertNulls": false,
"lineInterpolation": "linear",
"lineWidth": 1,
"pointSize": 5,
"scaleDistribution": {
"type": "linear"
},
"showPoints": "never",
"spanNulls": false,
"stacking": {
"group": "A",
"mode": "none"
},
"thresholdsStyle": {
"mode": "off"
}
},
"mappings": [],
"thresholds": {
"mode": "absolute",
"steps": [
{
"color": "green",
"value": null
},
{
"color": "red",
"value": 80
}
]
},
"unit": "ops"
},
"overrides": []
},
"gridPos": {
"h": 5,
"w": 8,
"x": 8,
"y": 27
},
"id": 101,
"options": {
"legend": {
"calcs": [],
"displayMode": "list",
"placement": "bottom",
"showLegend": true
},
"tooltip": {
"mode": "multi",
"sort": "none"
}
},
"pluginVersion": "10.4.2",
"targets": [
{
"datasource": "${DS_PROMETHEUS}",
"editorMode": "code",
"expr": "sum(rate(http_server_requests_seconds_sum{uri=~'.*/cs/configs|.*/ns/instance.*', instance=~'$instance'}[1m])) > 0",
"format": "time_series",
"intervalFactor": 1,
"range": true,
"refId": "A"
},
{
"datasource": "${DS_PROMETHEUS}",
"editorMode": "code",
"expr": "sum(rate(http_server_requests_seconds_sum{instance=~'$instance'}[1m]))",
"format": "time_series",
"hide": false,
"intervalFactor": 1,
"legendFormat": "all",
"range": true,
"refId": "B"
}
],
"title": "ops (HTTP)",
"type": "timeseries"
},
{
"datasource": "${DS_PROMETHEUS}",
"fieldConfig": {
"defaults": {
"color": {
"mode": "palette-classic"
},
"custom": {
"axisBorderShow": false,
"axisCenteredZero": false,
"axisColorMode": "text",
"axisLabel": "",
"axisPlacement": "auto",
"barAlignment": 0,
"drawStyle": "line",
"fillOpacity": 10,
"gradientMode": "none",
"hideFrom": {
"legend": false,
"tooltip": false,
"viz": false
},
"insertNulls": false,
"lineInterpolation": "linear",
"lineWidth": 1,
"pointSize": 5,
"scaleDistribution": {
"type": "linear"
},
"showPoints": "never",
"spanNulls": false,
"stacking": {
"group": "A",
"mode": "none"
},
"thresholdsStyle": {
"mode": "off"
}
},
"mappings": [],
"thresholds": {
"mode": "absolute",
"steps": [
{
"color": "green",
"value": null
},
{
"color": "red",
"value": 80
}
]
},
"unit": "short"
},
"overrides": []
},
"gridPos": {
"h": 5,
"w": 8,
"x": 16,
"y": 27
},
"id": 103,
"options": {
"legend": {
"calcs": [],
"displayMode": "list",
"placement": "bottom",
"showLegend": true
},
"tooltip": {
"mode": "multi",
"sort": "none"
}
},
"pluginVersion": "10.4.2",
"targets": [
{
"datasource": "${DS_PROMETHEUS}",
"editorMode": "code",
"expr": "sum(nacos_monitor{module=\"naming\",name=\"pushPendingTaskCount\",instance=~'$instance'})",
"format": "time_series",
"intervalFactor": 1,
"legendFormat": "pending task count",
"range": true,
"refId": "A"
}
],
"title": "naming push task pending count",
"type": "timeseries"
},
{
"datasource": "${DS_PROMETHEUS}",
"fieldConfig": {
"defaults": {
"color": {
"mode": "palette-classic"
},
"custom": {
"axisBorderShow": false,
"axisCenteredZero": false,
"axisColorMode": "text",
"axisLabel": "",
"axisPlacement": "auto",
"barAlignment": 0,
"drawStyle": "line",
"fillOpacity": 10,
"gradientMode": "none",
"hideFrom": {
"legend": false,
"tooltip": false,
"viz": false
},
"insertNulls": false,
"lineInterpolation": "linear",
"lineWidth": 1,
"pointSize": 5,
"scaleDistribution": {
"type": "linear"
},
"showPoints": "never",
"spanNulls": false,
"stacking": {
"group": "A",
"mode": "none"
},
"thresholdsStyle": {
"mode": "off"
}
},
"mappings": [],
"thresholds": {
"mode": "absolute",
"steps": [
{
"color": "green",
"value": null
},
{
"color": "red",
"value": 80
}
]
},
"unit": "ms"
},
"overrides": []
},
"gridPos": {
"h": 5,
"w": 8,
"x": 0,
"y": 32
},
"id": 94,
"options": {
"legend": {
"calcs": [],
"displayMode": "list",
"placement": "bottom",
"showLegend": true
},
"tooltip": {
"mode": "multi",
"sort": "none"
}
},
"pluginVersion": "10.4.2",
"targets": [
{
"datasource": "${DS_PROMETHEUS}",
"editorMode": "code",
"expr": "sum(rate(grpc_server_requests_seconds_sum{instance=~'$instance'}[1m])/rate(grpc_server_requests_seconds_count{ instance=~'$instance'}[1m])) by (requestClass) * 1000 > 0",
"format": "time_series",
"intervalFactor": 1,
"range": true,
"refId": "A"
},
{
"datasource": "${DS_PROMETHEUS}",
"editorMode": "code",
"expr": "sum(rate(grpc_server_requests_seconds_sum{instance=~'$instance'}[1m]))/sum(rate(grpc_server_requests_seconds_count{instance=~'$instance'}[1m])) * 1000",
"format": "time_series",
"hide": false,
"intervalFactor": 1,
"legendFormat": "all",
"range": true,
"refId": "B"
}
],
"title": "rt (GRPC)",
"type": "timeseries"
},
{
"datasource": "${DS_PROMETHEUS}",
"fieldConfig": {
"defaults": {
"color": {
"mode": "palette-classic"
},
"custom": {
"axisBorderShow": false,
"axisCenteredZero": false,
"axisColorMode": "text",
"axisLabel": "",
"axisPlacement": "auto",
"barAlignment": 0,
"drawStyle": "line",
"fillOpacity": 10,
"gradientMode": "none",
"hideFrom": {
"legend": false,
"tooltip": false,
"viz": false
},
"insertNulls": false,
"lineInterpolation": "linear",
"lineWidth": 1,
"pointSize": 5,
"scaleDistribution": {
"type": "linear"
},
"showPoints": "never",
"spanNulls": false,
"stacking": {
"group": "A",
"mode": "none"
},
"thresholdsStyle": {
"mode": "off"
}
},
"mappings": [],
"thresholds": {
"mode": "absolute",
"steps": [
{
"color": "green",
"value": null
},
{
"color": "red",
"value": 80
}
]
},
"unit": "ops"
},
"overrides": []
},
"gridPos": {
"h": 5,
"w": 8,
"x": 8,
"y": 32
},
"id": 102,
"options": {
"legend": {
"calcs": [],
"displayMode": "list",
"placement": "bottom",
"showLegend": true
},
"tooltip": {
"mode": "multi",
"sort": "none"
}
},
"pluginVersion": "10.4.2",
"targets": [
{
"datasource": "${DS_PROMETHEUS}",
"editorMode": "code",
"expr": "sum(rate(grpc_server_requests_seconds_sum{instance=~'$instance'}[1m])) by (requestClass) > 0",
"format": "time_series",
"intervalFactor": 1,
"range": true,
"refId": "A"
},
{
"datasource": "${DS_PROMETHEUS}",
"editorMode": "code",
"expr": "sum(rate(grpc_server_requests_seconds_sum{instance=~'$instance'}[1m]))",
"format": "time_series",
"hide": false,
"intervalFactor": 1,
"legendFormat": "all",
"range": true,
"refId": "B"
}
],
"title": "ops (GRPC)",
"type": "timeseries"
},
{
"datasource": "${DS_PROMETHEUS}",
"fieldConfig": {
"defaults": {
"color": {
"mode": "palette-classic"
},
"custom": {
"axisBorderShow": false,
"axisCenteredZero": false,
"axisColorMode": "text",
"axisLabel": "",
"axisPlacement": "auto",
"barAlignment": 0,
"drawStyle": "line",
"fillOpacity": 10,
"gradientMode": "none",
"hideFrom": {
"legend": false,
"tooltip": false,
"viz": false
},
"insertNulls": false,
"lineInterpolation": "linear",
"lineWidth": 1,
"pointSize": 5,
"scaleDistribution": {
"type": "linear"
},
"showPoints": "never",
"spanNulls": false,
"stacking": {
"group": "A",
"mode": "none"
},
"thresholdsStyle": {
"mode": "off"
}
},
"mappings": [],
"thresholds": {
"mode": "absolute",
"steps": [
{
"color": "green",
"value": null
},
{
"color": "red",
"value": 80
}
]
},
"unit": "short"
},
"overrides": []
},
"gridPos": {
"h": 5,
"w": 8,
"x": 16,
"y": 32
},
"id": 104,
"options": {
"legend": {
"calcs": [],
"displayMode": "list",
"placement": "bottom",
"showLegend": true
},
"tooltip": {
"mode": "multi",
"sort": "none"
}
},
"pluginVersion": "10.4.2",
"targets": [
{
"datasource": "${DS_PROMETHEUS}",
"editorMode": "code",
"expr": "sum(nacos_monitor{module=\"config\",name=\"notifyClientTask\",instance=~'$instance'})",
"format": "time_series",
"intervalFactor": 1,
"legendFormat": "pending task count",
"range": true,
"refId": "A"
}
],
"title": "config push task pending count",
"type": "timeseries"
},
{
"collapsed": false,
"datasource": {
"type": "datasource",
"uid": "grafana"
},
"gridPos": {
"h": 1,
"w": 24,
"x": 0,
"y": 37
},
"id": 74,
"panels": [],
"targets": [
{
"datasource": {
"type": "datasource",
"uid": "grafana"
},
"refId": "A"
}
],
"title": "nacos basic monitor",
"type": "row"
},
{
"datasource": "${DS_PROMETHEUS}",
"fieldConfig": {
"defaults": {
"color": {
"mode": "palette-classic"
},
"custom": {
"axisBorderShow": false,
"axisCenteredZero": false,
"axisColorMode": "text",
"axisLabel": "",
"axisPlacement": "auto",
"barAlignment": 0,
"drawStyle": "line",
"fillOpacity": 10,
"gradientMode": "none",
"hideFrom": {
"legend": false,
"tooltip": false,
"viz": false
},
"insertNulls": false,
"lineInterpolation": "linear",
"lineWidth": 1,
"pointSize": 5,
"scaleDistribution": {
"type": "linear"
},
"showPoints": "never",
"spanNulls": false,
"stacking": {
"group": "A",
"mode": "none"
},
"thresholdsStyle": {
"mode": "line+area"
}
},
"mappings": [],
"thresholds": {
"mode": "absolute",
"steps": [
{
"color": "transparent",
"value": null
},
{
"color": "red",
"value": 50
}
]
},
"unit": "percent"
},
"overrides": []
},
"gridPos": {
"h": 5,
"w": 8,
"x": 0,
"y": 38
},
"id": 45,
"options": {
"legend": {
"calcs": [],
"displayMode": "list",
"placement": "bottom",
"showLegend": true
},
"tooltip": {
"mode": "multi",
"sort": "none"
}
},
"pluginVersion": "10.4.2",
"targets": [
{
"datasource": "${DS_PROMETHEUS}",
"editorMode": "code",
"expr": "max(system_cpu_usage{instance=~'$instance'}) * 100",
"format": "time_series",
"intervalFactor": 1,
"legendFormat": "cpu usage",
"range": true,
"refId": "A"
}
],
"title": "cpu usage",
"type": "timeseries"
},
{
"datasource": "${DS_PROMETHEUS}",
"fieldConfig": {
"defaults": {
"color": {
"mode": "palette-classic"
},
"custom": {
"axisBorderShow": false,
"axisCenteredZero": false,
"axisColorMode": "text",
"axisLabel": "",
"axisPlacement": "auto",
"barAlignment": 0,
"drawStyle": "line",
"fillOpacity": 10,
"gradientMode": "none",
"hideFrom": {
"legend": false,
"tooltip": false,
"viz": false
},
"insertNulls": false,
"lineInterpolation": "linear",
"lineWidth": 1,
"pointSize": 5,
"scaleDistribution": {
"type": "linear"
},
"showPoints": "never",
"spanNulls": false,
"stacking": {
"group": "A",
"mode": "none"
},
"thresholdsStyle": {
"mode": "line+area"
}
},
"mappings": [],
"thresholds": {
"mode": "absolute",
"steps": [
{
"color": "transparent",
"value": null
},
{
"color": "red",
"value": 80
}
]
},
"unit": "percent"
},
"overrides": []
},
"gridPos": {
"h": 5,
"w": 8,
"x": 8,
"y": 38
},
"id": 46,
"options": {
"legend": {
"calcs": [],
"displayMode": "list",
"placement": "bottom",
"showLegend": true
},
"tooltip": {
"mode": "multi",
"sort": "none"
}
},
"pluginVersion": "10.4.2",
"targets": [
{
"datasource": "${DS_PROMETHEUS}",
"editorMode": "code",
"expr": "sum(jvm_memory_used_bytes{area=\"heap\"})/sum(jvm_memory_max_bytes{area=\"heap\"}) * 100",
"format": "time_series",
"intervalFactor": 1,
"legendFormat": "heap memory usage",
"range": true,
"refId": "A"
}
],
"title": "heap memory usage",
"type": "timeseries"
},
{
"datasource": "${DS_PROMETHEUS}",
"fieldConfig": {
"defaults": {
"color": {
"mode": "palette-classic"
},
"custom": {
"axisBorderShow": false,
"axisCenteredZero": false,
"axisColorMode": "text",
"axisLabel": "",
"axisPlacement": "auto",
"barAlignment": 0,
"drawStyle": "line",
"fillOpacity": 10,
"gradientMode": "none",
"hideFrom": {
"legend": false,
"tooltip": false,
"viz": false
},
"insertNulls": false,
"lineInterpolation": "linear",
"lineWidth": 1,
"pointSize": 5,
"scaleDistribution": {
"type": "linear"
},
"showPoints": "never",
"spanNulls": false,
"stacking": {
"group": "A",
"mode": "none"
},
"thresholdsStyle": {
"mode": "line+area"
}
},
"mappings": [],
"thresholds": {
"mode": "absolute",
"steps": [
{
"color": "transparent",
"value": null
}
]
},
"unit": "short"
},
"overrides": []
},
"gridPos": {
"h": 5,
"w": 8,
"x": 16,
"y": 38
},
"id": 38,
"options": {
"legend": {
"calcs": [],
"displayMode": "list",
"placement": "bottom",
"showLegend": true
},
"tooltip": {
"mode": "multi",
"sort": "none"
}
},
"pluginVersion": "10.4.2",
"targets": [
{
"datasource": "${DS_PROMETHEUS}",
"editorMode": "code",
"expr": "max(increase(jvm_gc_pause_seconds_count{instance=~'$instance'}[1m])) by (action)",
"format": "time_series",
"intervalFactor": 1,
"legendFormat": "{{action}}",
"range": true,
"refId": "A"
}
],
"title": "GC count",
"type": "timeseries"
},
{
"datasource": "${DS_PROMETHEUS}",
"fieldConfig": {
"defaults": {
"color": {
"mode": "palette-classic"
},
"custom": {
"axisBorderShow": false,
"axisCenteredZero": false,
"axisColorMode": "text",
"axisLabel": "",
"axisPlacement": "auto",
"barAlignment": 0,
"drawStyle": "line",
"fillOpacity": 0,
"gradientMode": "none",
"hideFrom": {
"legend": false,
"tooltip": false,
"viz": false
},
"insertNulls": false,
"lineInterpolation": "linear",
"lineWidth": 1,
"pointSize": 5,
"scaleDistribution": {
"type": "linear"
},
"showPoints": "never",
"spanNulls": false,
"stacking": {
"group": "A",
"mode": "none"
},
"thresholdsStyle": {
"mode": "line+area"
}
},
"mappings": [],
"thresholds": {
"mode": "absolute",
"steps": [
{
"color": "transparent",
"value": null
}
]
},
"unit": "short"
},
"overrides": []
},
"gridPos": {
"h": 5,
"w": 8,
"x": 0,
"y": 43
},
"id": 107,
"options": {
"legend": {
"calcs": [],
"displayMode": "list",
"placement": "bottom",
"showLegend": true
},
"tooltip": {
"mode": "multi",
"sort": "none"
}
},
"pluginVersion": "10.4.2",
"targets": [
{
"datasource": "${DS_PROMETHEUS}",
"editorMode": "code",
"expr": "sum(nacos_monitor{module=\"core\",name=\"longConnection\",instance=~'$instance'}) by (instance)",
"format": "time_series",
"hide": false,
"intervalFactor": 1,
"legendFormat": "grpc connection count",
"range": true,
"refId": "C"
}
],
"title": "GRPC connection count",
"type": "timeseries"
},
{
"datasource": "${DS_PROMETHEUS}",
"fieldConfig": {
"defaults": {
"color": {
"mode": "palette-classic"
},
"custom": {
"axisBorderShow": false,
"axisCenteredZero": false,
"axisColorMode": "text",
"axisLabel": "",
"axisPlacement": "auto",
"barAlignment": 0,
"drawStyle": "line",
"fillOpacity": 0,
"gradientMode": "none",
"hideFrom": {
"legend": false,
"tooltip": false,
"viz": false
},
"insertNulls": false,
"lineInterpolation": "linear",
"lineWidth": 1,
"pointSize": 5,
"scaleDistribution": {
"type": "linear"
},
"showPoints": "never",
"spanNulls": false,
"stacking": {
"group": "A",
"mode": "none"
},
"thresholdsStyle": {
"mode": "line+area"
}
},
"mappings": [],
"thresholds": {
"mode": "absolute",
"steps": [
{
"color": "transparent",
"value": null
}
]
},
"unit": "short"
},
"overrides": []
},
"gridPos": {
"h": 5,
"w": 8,
"x": 8,
"y": 43
},
"id": 105,
"options": {
"legend": {
"calcs": [],
"displayMode": "list",
"placement": "bottom",
"showLegend": true
},
"tooltip": {
"mode": "multi",
"sort": "none"
}
},
"pluginVersion": "10.4.2",
"targets": [
{
"datasource": "${DS_PROMETHEUS}",
"editorMode": "code",
"expr": "avg(grpc_server_executor{module=\"core\",type=\"grpcSdkServer\",instance=~'$instance',name=\"poolSize\"}) by (name)",
"format": "time_series",
"intervalFactor": 1,
"legendFormat": "__auto",
"range": true,
"refId": "A"
},
{
"datasource": "${DS_PROMETHEUS}",
"editorMode": "code",
"exemplar": false,
"expr": "avg(grpc_server_executor{module=\"core\",type=\"grpcSdkServer\",instance=~'$instance',name=\"maximumPoolSize\"}) by (name)",
"format": "time_series",
"hide": false,
"instant": false,
"intervalFactor": 1,
"legendFormat": "__auto",
"range": true,
"refId": "B"
},
{
"datasource": "${DS_PROMETHEUS}",
"editorMode": "code",
"expr": "avg(grpc_server_executor{module=\"core\",type=\"grpcSdkServer\",instance=~'$instance',name=\"activeCount\"}) by (name)",
"format": "time_series",
"hide": false,
"intervalFactor": 1,
"legendFormat": "__auto",
"range": true,
"refId": "C"
}
],
"title": "GRPC Thread Pool",
"type": "timeseries"
},
{
"datasource": "${DS_PROMETHEUS}",
"fieldConfig": {
"defaults": {
"color": {
"mode": "palette-classic"
},
"custom": {
"axisBorderShow": false,
"axisCenteredZero": false,
"axisColorMode": "text",
"axisLabel": "",
"axisPlacement": "auto",
"barAlignment": 0,
"drawStyle": "line",
"fillOpacity": 0,
"gradientMode": "none",
"hideFrom": {
"legend": false,
"tooltip": false,
"viz": false
},
"insertNulls": false,
"lineInterpolation": "linear",
"lineWidth": 1,
"pointSize": 5,
"scaleDistribution": {
"type": "linear"
},
"showPoints": "never",
"spanNulls": false,
"stacking": {
"group": "A",
"mode": "none"
},
"thresholdsStyle": {
"mode": "line+area"
}
},
"mappings": [],
"thresholds": {
"mode": "absolute",
"steps": [
{
"color": "transparent",
"value": null
}
]
},
"unit": "short"
},
"overrides": []
},
"gridPos": {
"h": 5,
"w": 8,
"x": 16,
"y": 43
},
"id": 106,
"options": {
"legend": {
"calcs": [],
"displayMode": "list",
"placement": "bottom",
"showLegend": true
},
"tooltip": {
"mode": "multi",
"sort": "none"
}
},
"pluginVersion": "10.4.2",
"targets": [
{
"datasource": "${DS_PROMETHEUS}",
"editorMode": "code",
"expr": "avg(grpc_server_executor{module=\"core\",type=\"grpcSdkServer\",instance=~'$instance',name=\"inQueueTaskCount\"}) by (name)",
"format": "time_series",
"intervalFactor": 1,
"legendFormat": "request queue size",
"range": true,
"refId": "A"
}
],
"title": "GRPC request queue",
"type": "timeseries"
}
],
"refresh": false,
"schemaVersion": 39,
"tags": [],
"templating": {
"list": [
{
"allValue": ".*:8848",
"current": {
"selected": false,
"text": "All",
"value": "$__all"
},
"datasource": "${DS_PROMETHEUS}",
"definition": "label_values(instance)",
"hide": 0,
"includeAll": true,
"label": "instance",
"multi": false,
"name": "instance",
"options": [],
"query": "label_values(instance)",
"refresh": 2,
"regex": "/.*:8848/",
"skipUrlSync": false,
"sort": 0,
"tagValuesQuery": "",
"tagsQuery": "",
"type": "query",
"useTags": false
}
]
},
"time": {
"from": "now-15m",
"to": "now"
},
"timepicker": {
"refresh_intervals": [
"5s",
"10s",
"30s",
"1m",
"5m",
"15m",
"30m",
"1h",
"2h",
"1d"
],
"time_options": [
"5m",
"15m",
"1h",
"6h",
"12h",
"24h",
"2d",
"7d",
"30d"
]
},
"timezone": "",
"title": "Nacos",
"uid": "Bz_QALEiz1",
"version": 25,
"weekStart": ""
}
或者直接输入 Bz_QALEiz1
这就部署完成了
本文来自博客园,作者:厚礼蝎,转载请注明原文链接:https://www.cnblogs.com/guangdelw/p/18838015

 浙公网安备 33010602011771号