Go语言中的性能测试
单元测试
测试单元的结果是否符合预期
//go_test.go
import (
	"fmt"
	"testing"
)

func Add() int {
	fmt.Println("AAAAAAAAAAAAAA")
	return 5
}
func Sub() int {
	fmt.Println("SSSSSSSSSSSSSSSS")
	return 5
}

func TestFun1(t *testing.T) {
	fmt.Println("TTTTTTTTTTTTTT111111111")
	r := Add()
    //如果返回的结果不符合预期,就显示测试不通过
	if r != 6 {
		t.Fail()
	}
}
func TestFun2(t *testing.T) {
	fmt.Println("TTTTTTTTTTTTTT222222222222")
	r := Sub()
	if r != 5 {
		t.Fail()
	}
}
go test -v go_test.go -run=Fun1 -timeout=20m -count=1
- -v 打印详情测试信息
- -run 运行指定的单元测试,用正则表达式匹配
- -timeout 默认10分钟超时
- -count 测试函数运行几次
基准测试
反复测试多次,测试性能
func BenchmarkStrCat(b *testing.B) {
    hello := "hello"
    golang := "golang"
    for i := 0; i < b.N; i++ {
        fmt.Printf("%s %s\n", 	hello, golang)
    }
}
go test -bench=StrCat -run=^$ -benchmem -benchtime=2s -cpuprofile=data/cpu
- -bench 正则指定运行哪些基准测试
- -run 正则指定运行哪些单元测试
- -benchmem 输出内存分配情况
- -benchtime 每个函数运行多长时间
- -cpuprofile 指定cpu使用信息的相关输出文件
测试代码规范
- 单元测试和基准测试必须放在以
_test.go为后缀的文件里。 - 单元测试函数以
Test开头,基准测试函数以Benchmark开头。 - 单元测试以
*testing.T为参数,函数无返回值。 - 基准测试以
*testing.B为参数,函数无返回值。
pprof
首先我们得先安装这两个工具:
go get -u github.com/google/pprof
go get github.com/DeanThompson/ginpprof
pprof是可视化性能分析工具,提供以下功能:
- CPU Profiling:按一定频率采集CPU使用情况。
- Memory Profiling:监控内存使用情况,检查内存泄漏。
- Goroutine Profiling:对正在运行的Goroutine进行堆栈跟踪和分析,检查协程泄漏。
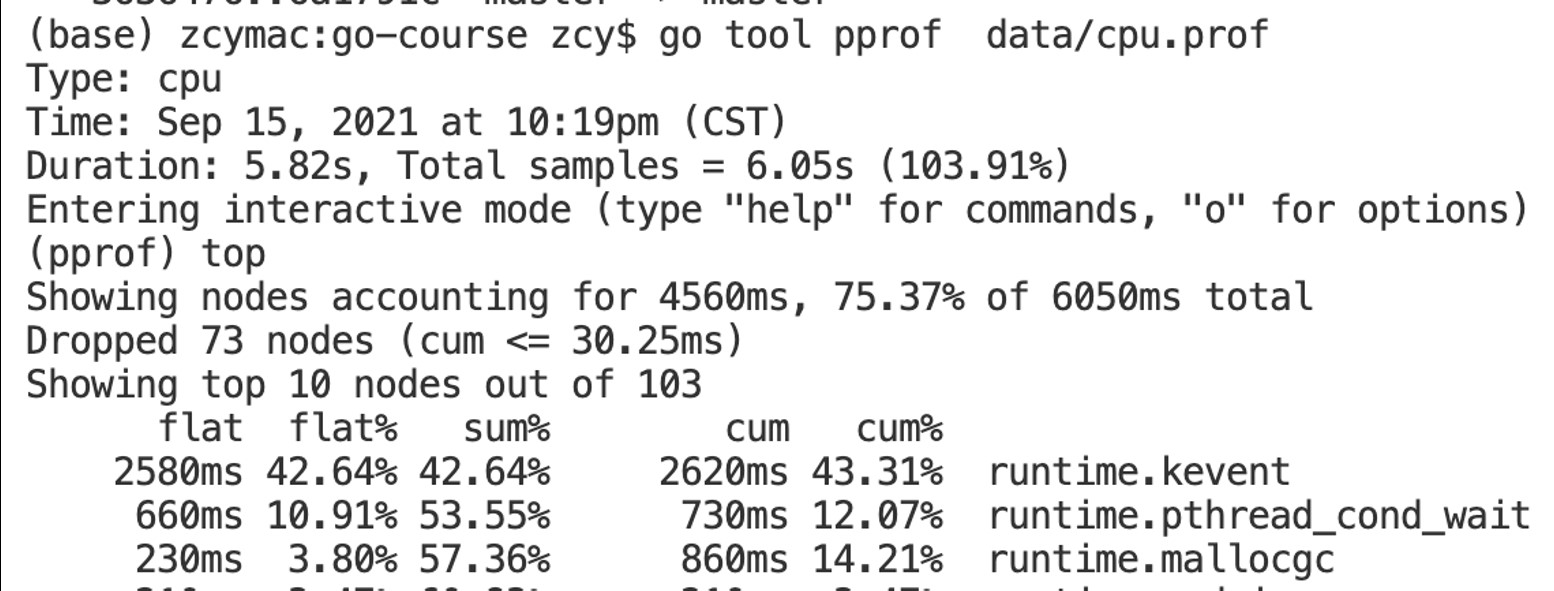
监控CPU使用命令go tool pprof data/cpu。
进入交互界面后常用的命令有:
- topn:列出最耗计算资源的前n个函数
- list func:列出某函数里每一行代码消耗多少计算资源
- peek func:列出某函数里最耗计算资源的前几个子函数
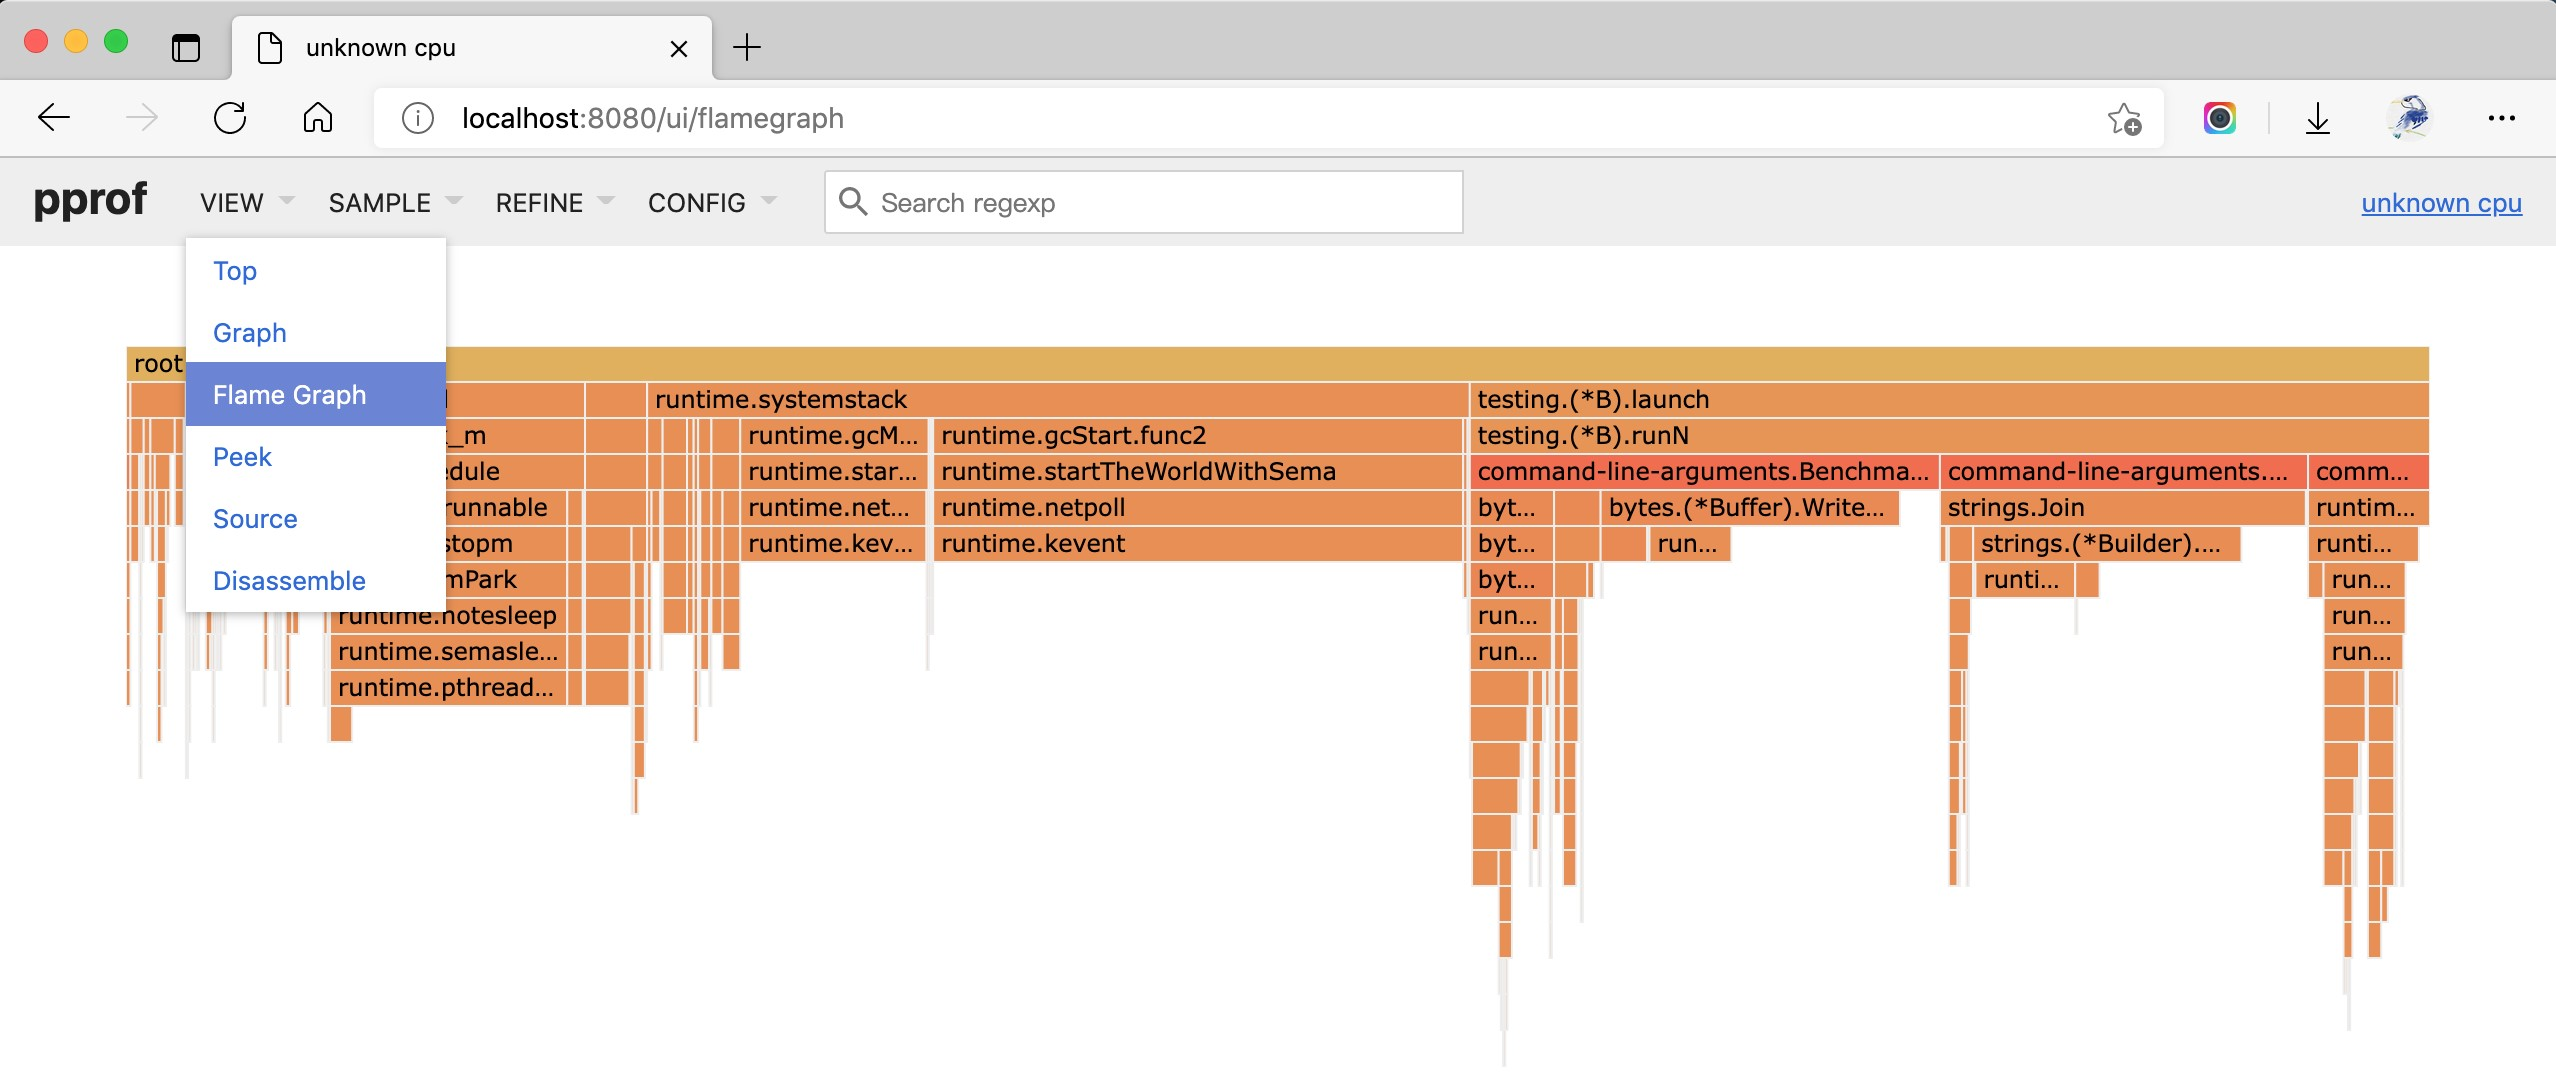
pprof结果可以在浏览器上进行可视化。
go tool pprof -http=:8080 data/cpu
注意:
-
在执行这个命令的时候有时候会报错,
Could not execute dot; may need to install graphviz.说缺少graphviz,那我们就要去下载并安装,graphviz下载地址
-
安装之后还得把安装目录下的bin添加到path中
本文来自博客园,作者:厚礼蝎,转载请注明原文链接:https://www.cnblogs.com/guangdelw/p/17761285.html
