曹工改bug:cpu狂飙,old gc频繁,线程神秘死亡连环案件调查报告
曹工改bug:cpu狂飙,old gc频繁,线程神秘死亡连环案件调查报告
前言
前两天,访问开发环境上一个java服务,发现一直转圈圈,因为我开着fiddler,可以看到的现象是,接口一直没返回;本来想着直接jenkins重新构建一下开发环境(即重启服务),突然觉得,还是看看到底啥情况吧。
排查过程
登录到开发环境上(8核16g,centos 7),来了一圈常规操作,结果执行top发现,cpu占用竟然高达400%,然后按照标准流程,那肯定就是查看该进程内占用cpu高的线程是哪个:
top -H -p pid
因为当时没截图,只保存了文本:
线程id                                       cpu占用率
19093 root      20   0 6599852 1.107g  14612 S 19.3  7.1  30:17.26 java
19087 root      20   0 6599852 1.107g  14612 S 15.3  7.1  22:28.15 java
19089 root      20   0 6599852 1.107g  14612 S 15.3  7.1  22:28.99 java
19091 root      20   0 6599852 1.107g  14612 S 15.3  7.1  22:27.07 java
19092 root      20   0 6599852 1.107g  14612 S 15.3  7.1  22:27.47 java
19085 root      20   0 6599852 1.107g  14612 S 14.3  7.1  22:28.11 java
19086 root      20   0 6599852 1.107g  14612 S 14.3  7.1  22:27.32 java
19088 root      20   0 6599852 1.107g  14612 S 14.3  7.1  22:27.11 java
19090 root      20   0 6599852 1.107g  14612 S 13.6  7.1  22:30.03 java
最左侧是线程id,后面有一列为cpu占用率,可以发现,一个线程就占用了20%的cpu。
然后手动将这几个线程id,调用如下语句,转成了十六进制
printf "%x\n" 线程id
得到如下结果:
hex   线程id
4a95  19093
4a94 19092
4a90 19088
4a8d 19085
4a8f 19087
4a91 19089
4a92 19090
4a8e 19086
4a93 19091
然后执行jstack,查看这几个线程id,发现都是些gc线程。

既然问题出在gc这里,那自然要祭出jstat神器了。
先看看新生代,倒数第二列,YGC一直很稳定,看来新生代没啥问题。
再看看老年代:
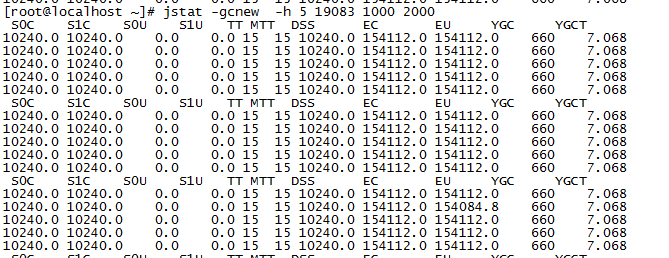
jstat -gcold -h 5 19083 1000 2000

可以发现,FGC挺凶残,再看看OC(old capacity),表示老年代为340m左右(开发环境,没调参数,都是默认的),再看看OU(old used),都用了340m了,然后每次回收,OU都还是维持在那个程度,说明回收没啥效果,这些OU里的对象,基本都回收不掉。
回收不掉,那只能看看都是些什么对象了,如果这些对象确实需要,那就说明我们的old区太小;如果不需要这些对象,说明是内存泄漏。
ok,jmap走一波。
jmap -dump:live,format=b,file=19083.hprof 19083
拿到对应的文件后,下载到本地,用MAT(Eclipse Memory Analyzer )进行分析。
打开文件的时候,就会让你选择,是否检测内存泄漏,我们这里大概率是内存泄漏,那就让MAT帮我们分析一波。
MAT分析内存泄漏
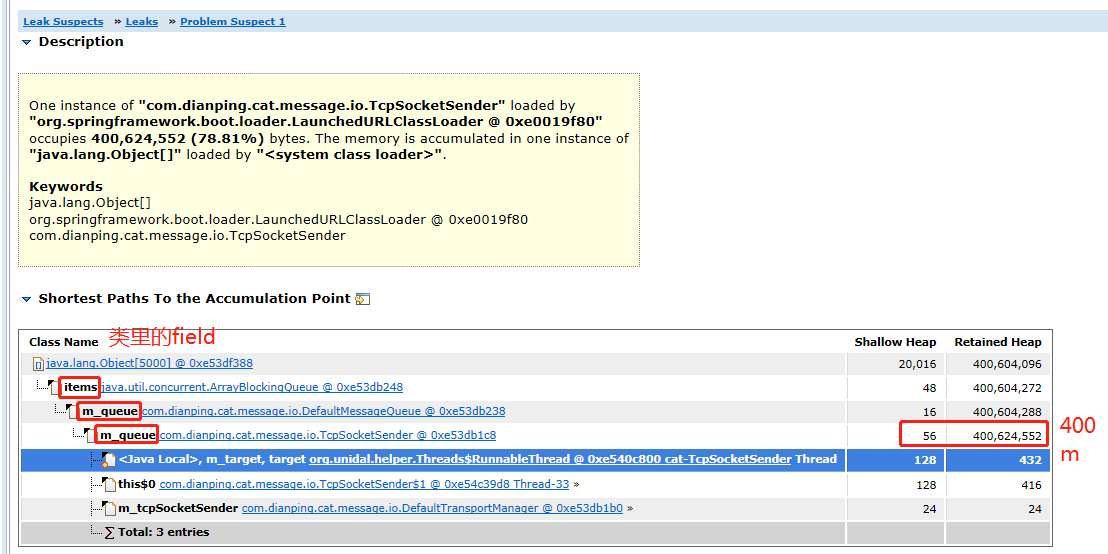
仔细看上图,可以发现,
-
线程一般是作为一个gc root,这里的线程名称是,cat-TcpSocketSender,线程的class类型是:
org.unidal.helper.Threads$RunnableThread这个类是因为我们这边引入了美团的cat作为监控组件,这个监控组件,有一个服务端war包,部署在tomcat中,监听2280端口;有一个客户端jar包,我们的应用里,就引入了这个jar。所以,这个类,就是美团客户端jar中的类。
我们看看这个类的源码:
org.unidal.helper.Threads.RunnableThread
static class RunnableThread extends Thread {
   private Runnable m_target;
发现其继承了jdk的Thread。
这个类中的m_target,指向了
com.dianping.cat.message.io.TcpSocketSender这个类。 -
com.dianping.cat.message.io.TcpSocketSender这个类中,有一个字段,叫m_queue,其Retained Heap达到了400m,也就是说,m_queue里引用的对象,全部加起来,已经是400m了。该字段定义如下:
private MessageQueue m_queue = new DefaultMessageQueue(SIZE);其类型为DefaultMessageQueue,我们可以看看这个类的代码:
public class DefaultMessageQueue implements MessageQueue {

	private BlockingQueue<MessageTree> m_queue;

	public DefaultMessageQueue(int size) {
		m_queue = new ArrayBlockingQueue<MessageTree>(size);
	}
很简单,就是维护了一个队列,名称也叫m_queue,补充一下,这里的size,传进来的是5000.
然后构造了一个ArrayBlockingQueue,里面存放的每个item的class类型,就是MessageTree。
到此为止,大概知道,是美团的cat客户端jar包中,一个队列里存了大量数据,大概有400m,几乎把old 区占用完了,而且一直gc不掉。
现在就看一下,这里面存放的是什么东西?

如果图小,可在单独tab查看,这里可以看到,arrayBlockingQueue的数组中,存放了5000个对象,5000就是这个队列的size的大小。
那具体每个item里存什么了呢?
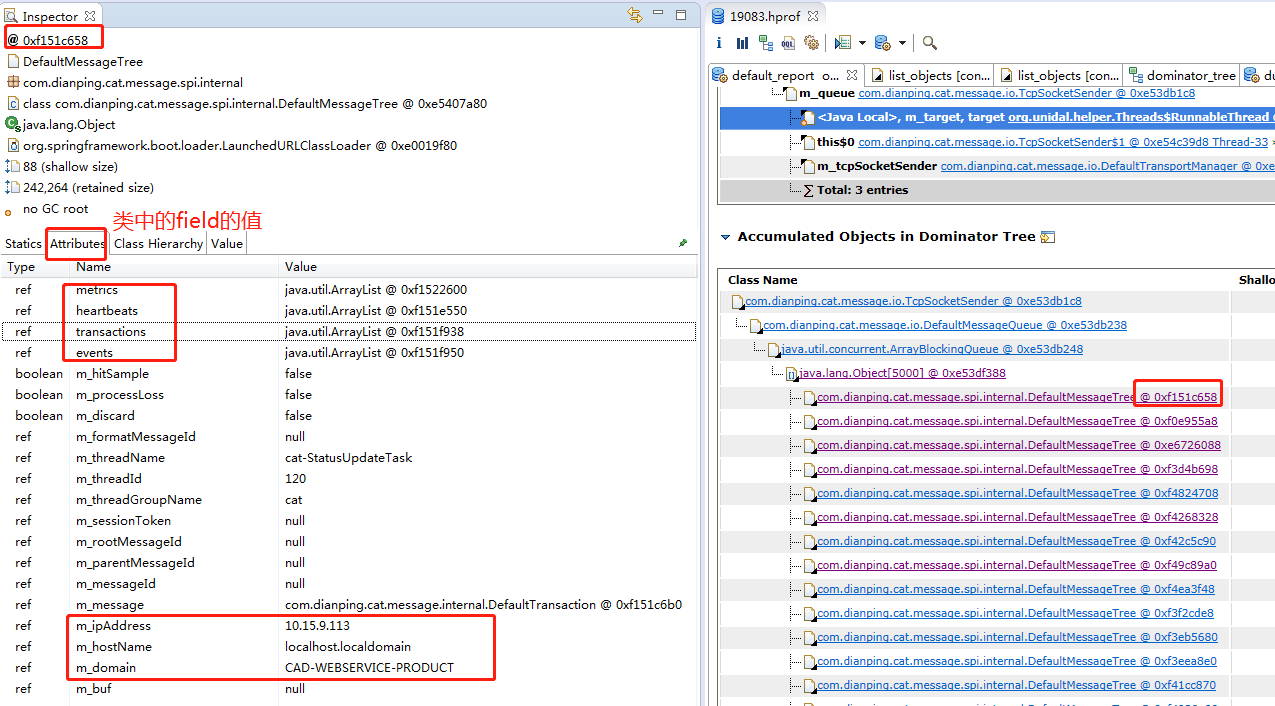
这个类中,有metric,heartbeats,transaction,event这些,这都是要上报到cat服务端的监控数据;而下面的m_ipaddress这些,正好是我们服务端的ip地址。
大概可以猜出来,这个item,存放了要上报到cat服务端的数据。
那么,问题变成了,为什么没有上报呢?因为我们这边前一阵服务端断了一次电,大概猜到是因为cat服务端没有启动,在服务器上一看,确实没启动。
所以,问题大概就是:因为服务端没启动,所以这边一直发送不出去,导致积压在这个队列里。
我们进一步查看了对应的cat客户端源码,发现这个线程的逻辑,大概如下:
com.dianping.cat.message.io.TcpSocketSender#run

	@Override
	public void run() {
		m_active = true;

		while (m_active) {
			processAtomicMessage();
			// 1
			processNormalMessage();
		}
	}
继续看1处:
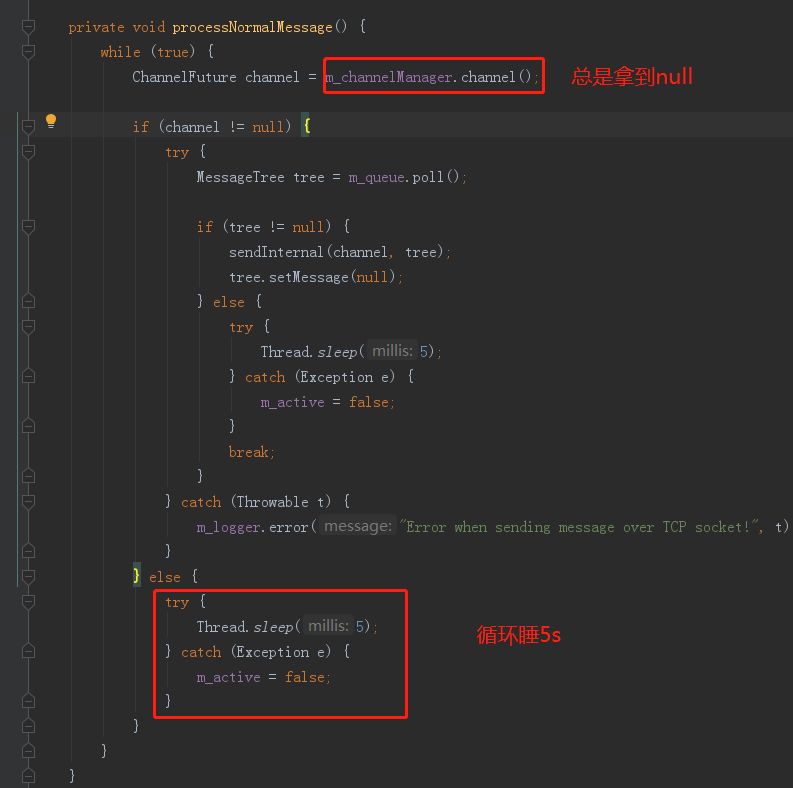
	private void processNormalMessage() {
		while (true) {
            // 1
			ChannelFuture channel = m_channelManager.channel();

            // 2
			if (channel != null) {
				try {
                  	// 3
					MessageTree tree = m_queue.poll();

					if (tree != null) {
                        // 4
						sendInternal(channel, tree);
						tree.setMessage(null);
					} else {
						try {
							Thread.sleep(5);
						} catch (Exception e) {
							m_active = false;
						}
						break;
					}
				} catch (Throwable t) {
					m_logger.error("Error when sending message over TCP socket!", t);
				}
			} else {
                // 5
				try {
					Thread.sleep(5);
				} catch (Exception e) {
					m_active = false;
				}
			}
		}
	}
- 1处,从m_channelManager,获取一个channel,因为cat客户端使用了netty,所以这里是要获取一个netty的channle,用来发送数据
- 2处,如果拿到的channel不为null,则进入3处;否则进入5处
- 3处,从我们前面提到的罪魁祸首的队列中,取1个item,这里的item就是MessageTree
- 4处,使用channel发送对应的tree
- 5处,如果拿到的channel是null,则睡眠5s
根据上面的逻辑,为什么没有从队列里取item去发送呢,推测是因为在上面1处时,拿到的channel是null。
但是口说无凭,怎么证实呢,我们得先看看1处方法的实现:
ChannelFuture channel = m_channelManager.channel();
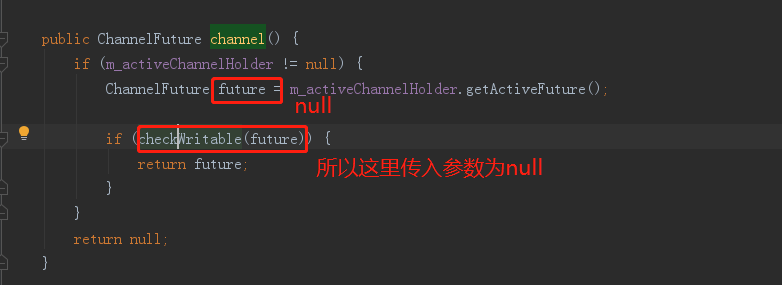
	com.dianping.cat.message.io.ChannelManager#channel
	public ChannelFuture channel() {
		// 1
		if (m_activeChannelHolder != null) {
			ChannelFuture future = m_activeChannelHolder.getActiveFuture();

			if (checkWritable(future)) {
				return future;
			}
		}
		// 2
		return null;
	}
如果1处,这里的m_activeChannelHolder是null,那么自然会返回null,那我们看看是不是null吧,还是使用mat,通过TcpSocketSender对象,找到m_channelManager。

然后再去查看m_channelManager的属性:
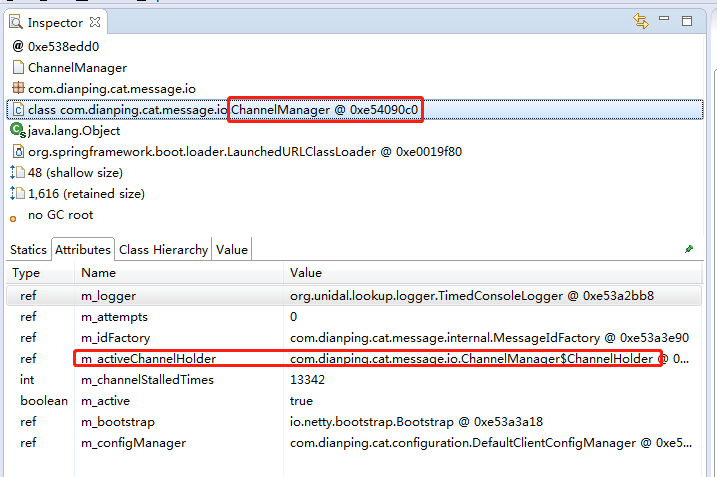
但是我们发现,这个属性并不是null。
ok,继续看之前那个方法
	public ChannelFuture channel() {
        // 1
		if (m_activeChannelHolder != null) {
          	// 2
			ChannelFuture future = m_activeChannelHolder.getActiveFuture();

			if (checkWritable(future)) {
				return future;
			}
		}
		return null;
	}
现在证实,1处的m_activeChannelHolder不为null,那么,就会走到2处
com.dianping.cat.message.io.ChannelManager.ChannelHolder#getActiveFuture
public ChannelFuture getActiveFuture() {
   return m_activeFuture;
}
那我们继续看看m_activeChannelHolder这个对象里的m_activeFuture字段吧:

好,这里发现,m_activeFuture是null。
继续深入checkWritable方法:
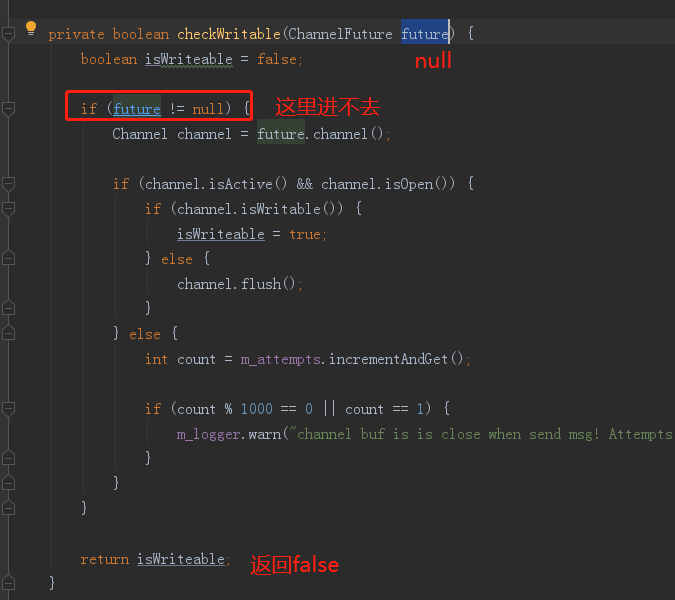
大家仔细看上面几张图,checkWritable会返回false,因此channel方法会返回null。
为什么积压发不出去的问题,已经清楚了,是因为channel总是空的。
而在jstack文件中,也能看到,每次jstack的结果,都是这个线程在sleep。
"cat-TcpSocketSender" #116 daemon prio=5 os_prio=0 tid=0x00007f2d6066b000 nid=0x4ce5 sleeping[0x00007f2df9b32000]
   java.lang.Thread.State: TIMED_WAITING (sleeping)
        at java.lang.Thread.sleep(Native Method)
        at com.dianping.cat.message.io.TcpSocketSender.processNormalMessage(TcpSocketSender.java:226)
        at com.dianping.cat.message.io.TcpSocketSender.run(TcpSocketSender.java:240)
        at java.lang.Thread.run(Thread.java:748)
        at org.unidal.helper.Threads$RunnableThread.run(Threads.java:294)
继续深入
到此为止,我们知道了表面上的原因了,是因为TcpSocketSender拿不到channel;那为啥拿不到channel呢,这个还需要分析。
接上文,
	public static class ChannelHolder {
        // 1
		private ChannelFuture m_activeFuture;

		private int m_activeIndex = -1;

		private String m_activeServerConfig;

		private List<InetSocketAddress> m_serverAddresses;

		private String m_ip;

		private boolean m_connectChanged;
我们现在知道,1处的m_activeFuture是null,这是目前知道的最深入的原因,至于为啥为null?不知道。
我们在代码里,find usage,查看什么地方会设置这个值。
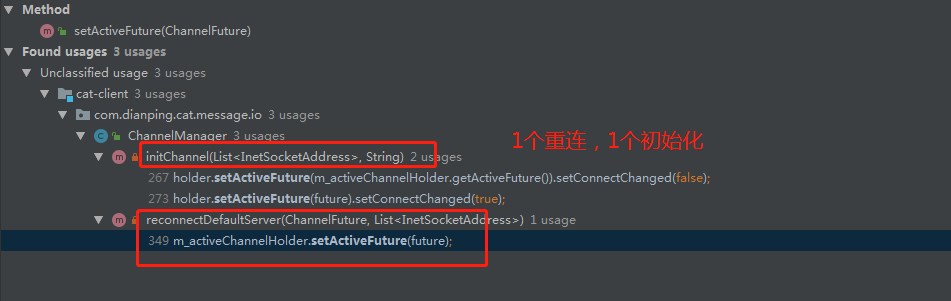
两处,1处进行重连,1处进行初始化。
本地复现:初始化
我们在本地进行了尝试,先试了初始化的场景,我们先关闭了cat服务端,然后在本地复现。
public ChannelManager(Logger logger, List<InetSocketAddress> serverAddresses, ClientConfigManager configManager,MessageIdFactory idFactory) {
		...

		if (StringUtils.isNotEmpty(routerConfig)) {
			...
		} else {
            // 1
			ChannelHolder holder = initChannel(serverAddresses, null);
			// 2
			if (holder != null) {
				m_activeChannelHolder = holder;
			} else {
                // 3
				m_activeChannelHolder = new ChannelHolder();
				m_activeChannelHolder.setServerAddresses(serverAddresses);
				m_logger.error("error when init cat module due to error config xml in client.xml");
			}
		}
	}
- 1处,初始化channel,因为服务端是关了的,不成功,这里返回null,因此holder为null
- 2处,holder不为null,我们这里走不到
- 3处,我们进入这里,这里直接new了一个ChannelHolder,然后new了之后,也没设置什么属性,因此,这里m_activeChannelHolder里面的m_activeFuture字段,就是null。
ok,我们现在知道了,如果启动的时候,cat服务端不可用,会导致m_activeFuture为null。
但是,一般都不会做的这么挫,都会定时去重连的。那我们看看,难道是重连的代码有问题吗?
重连场景分析
com.dianping.cat.message.io.ChannelManager#reconnectDefaultServer

private void reconnectDefaultServer(ChannelFuture activeFuture, List<InetSocketAddress> serverAddresses) {
   try {
      int reconnectServers = m_activeChannelHolder.getActiveIndex();

      if (reconnectServers == -1) {
         reconnectServers = serverAddresses.size();
      }
      for (int i = 0; i < reconnectServers; i++) {
         // 1
         ChannelFuture future = createChannel(serverAddresses.get(i));
		 // 1.1
         if (future != null) {
            ChannelFuture lastFuture = activeFuture;
			// 2
            m_activeChannelHolder.setActiveFuture(future);
            m_activeChannelHolder.setActiveIndex(i);
            closeChannel(lastFuture);
            break;
         }
      }
   } catch (Throwable e) {
      m_logger.error(e.getMessage(), e);
   }
}
1处,进行了重连;
2处,将channel设置到future,因为1.1处进行了判断,future不为null,才走到2,说明如果走到2处,future肯定不为null。
那我们有理由怀疑,这个方法难道没有执行到?
我们在这里打了断点,本地调试的时候,发现确实进来了这个方法。

但是,比较奇怪的是,这个重连逻辑,是有一个单独的线程,名字叫cat-TcpSocketSender-ChannelManager
但是,更奇怪的是,我之前在jstack中,好像没看到这么个线程啊?难道眼花了吗?
不,眼没花
[root@localhost ~]# grep cat-TcpSocketSender-ChannelManager 19083.txt
[root@localhost ~]# grep cat- 19083.txt
"cat-TcpSocketSender" #116 daemon prio=5 os_prio=0 tid=0x00007f2d6066b000 nid=0x4ce5 sleeping[0x00007f2df9b32000]
可以看到,我们的jstack文件里,真的没有这个线程。
好了,我怀疑,它死了。
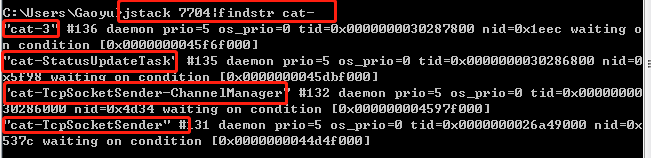
可以看到,本地正常情况下,竟然有4个cat线程,而服务器上,只有1个。
线程神秘死亡之谜
有点意思,线程都死了,这下就不好排查了,因为只要有一个未捕获异常,就会导致线程挂掉。
那么多代码,怎么知道哪里出了异常呢?
日志。
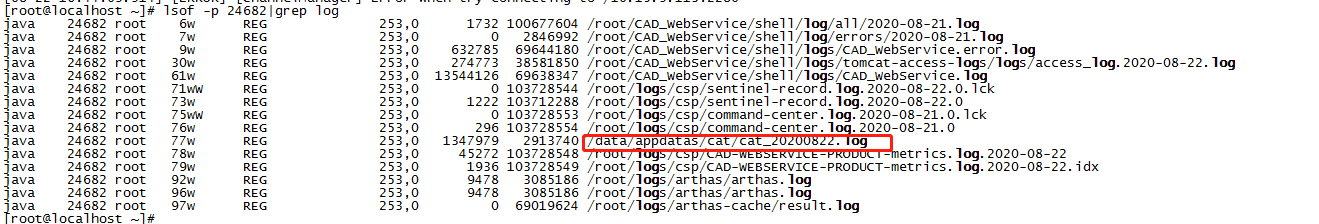
我们查了下日志,找到了日志文件。
当时排查时间,大概是上午11点多,我们因此反向查看日志。看到了如下部分
[08-20 10:27:36.749] [INFO] [ChannelManager] start connect server/10.15.9.113:2280
[08-20 10:27:36.752] [INFO] [ChannelManager] Connected to CAT server at /10.15.9.113:2280
[08-20 10:27:46.764] [INFO] [ChannelManager] router config changed :10.15.9.113:2280;
[08-20 10:27:46.764] [INFO] [ChannelManager] start connect server/10.15.9.113:2280
[08-20 10:27:46.768] [INFO] [ChannelManager] Connected to CAT server at /10.15.9.113:2280
[08-20 10:27:46.768] [INFO] [ChannelManager] success when init CAT server, new active holderactive future :/10.15.9.113:2280 index:0 ip:10.15.9.113 server config:10.15.9.113:2280;
[08-20 10:27:46.768] [INFO] [ChannelManager] close channel /10.15.9.113:2280
[08-20 10:27:46.769] [INFO] [ChannelManager] switch active channel to active future :/10.15.9.113:2280 index:0 ip:10.15.9.113 server config:10.15.9.113:2280;
其实我们对cat的日志也不熟悉,不知道中间那个[ChannelManager]是什么意思,以为是线程名称,当时就很疑惑,这些日志说明了,10点27分的时候,这个线程还活着啊,为啥就死了呢?
但我们不确定那个[]中间就是线程名,而且感觉也不是很像线程名称。
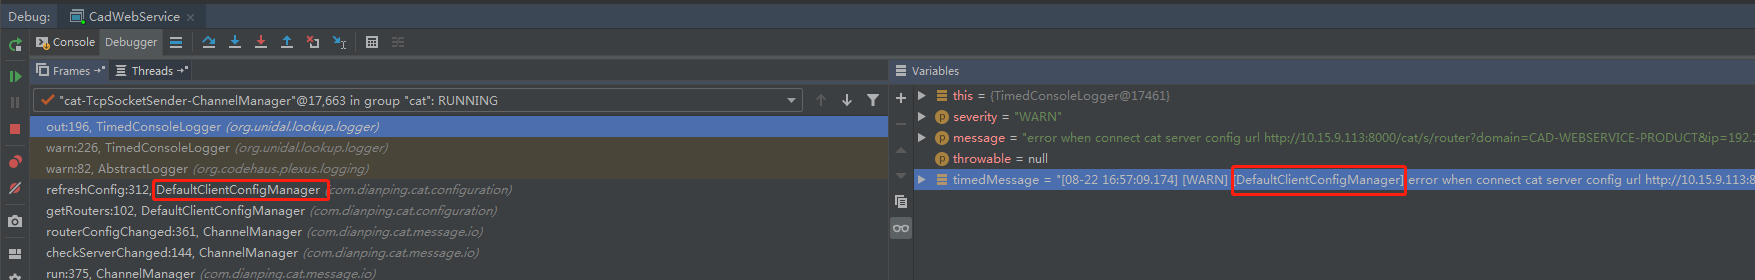
后面又本地debug试了下,看看打日志到底怎么打的
org.unidal.lookup.logger.TimedConsoleLogger#getTimedMessage
	private String getTimedMessage(String level, String message) {
      if (m_showClass) {
         // 1
         return m_format.format(new Object[] { new Date(), level, message, getCallerClassName() });
      } else {
         return m_format.format(new Object[] { new Date(), level, message });
      }
   }
发现进入了1处的getCallerClassName,这个返回的值,就被作为了前面提到的[ChannelManager]部分:
   private String getCallerClassName() {
      StackTraceElement[] elements = new Exception().getStackTrace();

      if (elements.length > 5) {
         String className = elements[5].getClassName();
         int pos = className.lastIndexOf('.');

         if (pos > 0) {
            return className.substring(pos + 1);
         } else {
            return className;
         }
      }

      return "N/A";
   }
总之呢,这里就是获取logger对应的class名称。
那这么说来,有下面那几行日志,但是具体是哪个线程打印的,其实也不是很确定了。
[08-20 10:27:36.749] [INFO] [ChannelManager] start connect server/10.15.9.113:2280
[08-20 10:27:36.752] [INFO] [ChannelManager] Connected to CAT server at /10.15.9.113:2280
[08-20 10:27:46.764] [INFO] [ChannelManager] router config changed :10.15.9.113:2280;
所以啊,日志还是应该多打印下线程名称,美团这个日志真的有点挫。
后面在日志文件里,各种翻找,发现了关键性日志了:
[08-20 06:34:34.862] [ERROR] [ChannelManager] GC overhead limit exceeded
java.lang.OutOfMemoryError: GC overhead limit exceeded
...
[08-20 06:40:28.962] [ERROR] [CatClientModule$CatThreadListener] Uncaught exception thrown out of thread(cat-TcpSocketSender-ChannelManager)
java.lang.OutOfMemoryError: GC overhead limit exceeded
[08-20 06:40:35.337] [ERROR] [CatClientModule$CatThreadListener] Uncaught exception thrown out of thread(cat-3)
java.lang.OutOfMemoryError: GC overhead limit exceeded
原来啊,这几个线程死了,是因为oom。
线程死了,为啥还记录了日志了?那是因为美团在new线程的时候,设置了uncaughtExceptionHandler.
java.lang.Thread
public class Thread implements Runnable {
private volatile UncaughtExceptionHandler uncaughtExceptionHandler;
com.dianping.cat.util.Threads.RunnableThread
static class RunnableThread extends Thread {
   private static ThreadLocal<String> m_callerThreadLocal = new ThreadLocal<String>();

   private Runnable m_target;

   private String m_caller;

   public RunnableThread(ThreadGroup threadGroup, Runnable target, String name, UncaughtExceptionHandler handler) {
      super(threadGroup, target, name);

      m_target = target;
      m_caller = getCaller();

      setDaemon(true);
      // 1
      setUncaughtExceptionHandler(handler);

      if (getPriority() != Thread.NORM_PRIORITY) {
         setPriority(Thread.NORM_PRIORITY);
      }
   }
上面1处可以看到,在new线程的时候,会手动设置UncaughtExceptionHandler。
而最终设置进去的,就是下面这个实现类:
	static class Manager implements UncaughtExceptionHandler {
      ....

      @Override
		public void uncaughtException(Thread thread, Throwable e) {
			for (ThreadListener listener : m_listeners) {
                // 1
				boolean handled = listener.onUncaughtException(thread, e);

				if (handled) {
					break;
				}
			}
		}
    }
当线程发生了未捕获异常时,就会进到1这里,通知listener。
其中一个listener,就是记录线程死亡日志。
public static final class CatThreadListener extends AbstractThreadListener {
		private final ModuleContext m_ctx;

		private CatThreadListener(ModuleContext ctx) {
			m_ctx = ctx;
		}
		...

		@Override
		public boolean onUncaughtException(Thread thread, Throwable e) {
			m_ctx.error(String.format("Uncaught exception thrown out of thread(%s)", thread.getName()), e);
			return true;
		}
	}
总结
至此,本探的案子就算是破了,也算是一个连环案了,是不是还有点意思呢?cpu飙高的背后是gc,gc的背后是内存泄漏,内存泄漏的背后,是cat服务端没起。
而启动cat服务端后,状态并没有好转,这背后竟然又是因为线程神秘死亡,神秘死亡的原因,结果是oom。
it is a circle。
谢谢大家。

 浙公网安备 33010602011771号