Linux下,如何监控某个进程到底向哪个地址发起了网络调用
Linux下,如何监控某个进程到底向哪个地址发起了网络调用
有时候,有些应用,比如idea,你发起某个操作时,其底层会去请求网络,获取一些数据。
但是不知道,请求了什么地址。举个例子,在idea中,maven管理的java工程,你在reimport的时候,肯定会去下载依赖,但是,有时候感觉配置的私服没生效,好像,请求还是去maven中央仓库下载。
怎么确定是不是真的去了maven中央仓库下载呢?有证据吗?
此时有什么好办法呢?如果不用点什么工具,还真没什么好办法。
再比如,我这里有一个linux上运行的java程序,我调用某个接口的时候,其会请求某个服务,但是现在,日志里没记录调用日志。那怎么知道是代码没走到,还是调用了呢,如果调用了,真实请求的地址是哪里呢?
netstat:比较简陋的方式
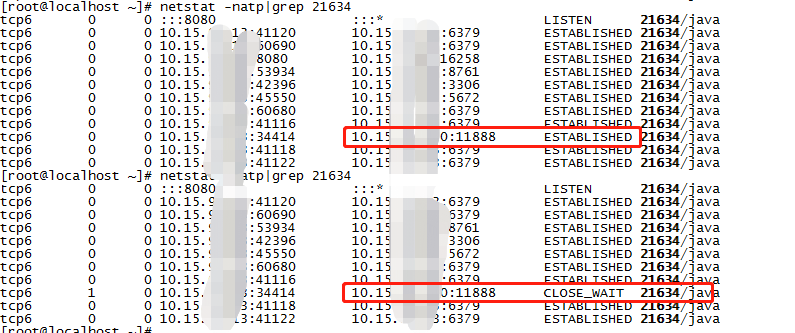
一般,一个程序刚调用完远程服务时,其socket的状态为time_wait,此时,和请求之前比,看看发生了什么变化。
netstat -antp |grep pid
比如,请求前,我java应用的网络连接如下:
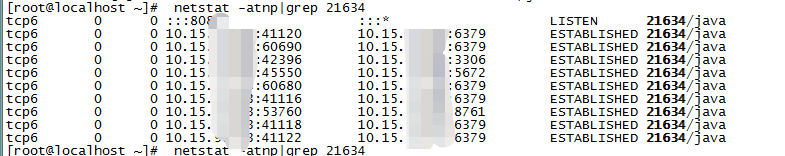
请求后,网络连接如下:
pid和进程id的关系
一般进程id,假设为10095,因为这是个java进程,是多线程的,我们使用查看其内部的线程:
top -H -p 10095
PID   USER      PR  NI    VIRT    RES    SHR S %CPU %MEM     TIME+ COMMAND
19823 root      20   0 9999.0m   1.5g  14632 S  1.7  9.5  67:25.37 java
10215 root      20   0 9999.0m   1.5g  14632 S  0.3  9.5   1:21.68 java
10095 root      20   0 9999.0m   1.5g  14632 S  0.0  9.5   0:00.00 java
发现其中,真就有一个线程id是10095。
这里的规律是,假设进程id为A,那么线程中,也有一个id相同的线程。
strace使用说明
概述
该命令,主要监控一个进程在运行过程中,发起了哪些系统调用;如果收到其他进程发送的signal,也可以监控。
功能非常强大,因为不论是网络发送,监听,请求,都是调用操作系统的函数,比如listen、connect等;因此,可以监控网络调用,可以将方法调用时的入参、出参、花费时间等,都打印出来,或者打印到文件。
同时,可以监控文件,比如:
open("/dev/null", O_RDONLY) = 3
这个就表示,调用open函数,参数为/dev/null,O_RDONLY,返回值为3.
查看进程的文件相关的系统调用
strace -t -p 10095 -q -f -s 10000 -e trace=file
-t: 打印调用时间
-p : 指定pid
-q : 压制attach、detach的消息,不然的话,attach到进程时,会打印一句提示;结束的时候,也会打印一堆提示。
-f: 不只是跟踪当前进程id对应的线程id,还要跟踪该pid内的全部线程,对于java这类多线程程序,尤其有用
-s strsize
Specify the maximum string size to print (the default is 32). Note that filenames are not considered strings and are always printed in full.
该参数的作用不便描述,可以看后面的例子。
-e trace=file
监控文件相关的系统调用
监控线程相关操作
-e trace=process
Trace all system calls which involve process management. This is useful for watching the fork, wait, and exec steps of a process.
监控网络请求
strace -p 10095 -q -f -e trace=network
效果如下:
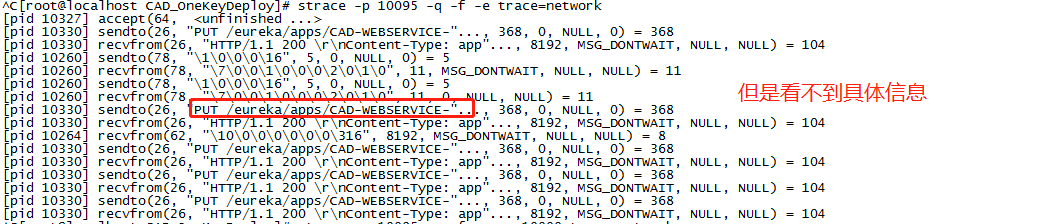
如果要看到具体信息:
strace -p 10095 -q -f -s 10000 -e trace=network

现在就可以看到了。
获得比平时,更清晰的信息:
[root@localhost shell]# strace -e network telnet 10.15.4.46 8080
Trying 10.15.4.46...
socket(AF_INET, SOCK_STREAM, IPPROTO_TCP) = 3
setsockopt(3, SOL_IP, IP_TOS, [16], 4)  = 0
connect(3, {sa_family=AF_INET, sin_port=htons(8080), sin_addr=inet_addr("10.15.4.46")}, 16) = -1 ECONNREFUSED (Connection refused)
telnet: connect to address 10.15.4.46: Connection refused
+++ exited with 1 +++
查看文件描述符相关调用
-T:输出每个调用花费的时间
strace -p 10095 -q -f -s 10000 -e trace=desc -T
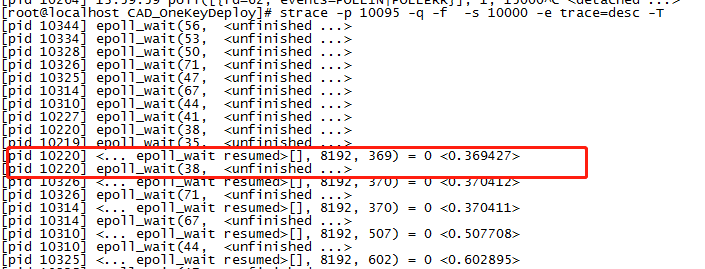
可以看到,是epoll这类文件描述符相关调用。
将结果写到文件
-o filename
Write the trace output to the file filename rather than to stderr. Use filename.pid if -ff is used. If the argument begins with '|' or with '!' then the rest of the argument is treated as a command and all output is piped to it. This is convenient for piping the debugging output to a program without affecting the redirections of executed programs.
strace -p 10095 -q -f -s 10000 -e trace=desc -v -o abc.txt
每个线程,生成一个文件
-ff
If the -o filename option is in effect, each processes trace is written to filename.pid where pid is the numeric process id of each process. This is incompatible with -c, since no per-process counts are kept.
strace -p 10095 -q -f -s 10000 -e trace=desc -ff -v -o abc.txt
效果如下:
-rw-r--r--.  1 root root    0 Jun 16 14:06 abc.txt.23309
-rw-r--r--.  1 root root    0 Jun 16 14:06 abc.txt.23379
-rw-r--r--.  1 root root    0 Jun 16 14:06 abc.txt.23380
-rw-r--r--.  1 root root    0 Jun 16 14:06 abc.txt.23381
-rw-r--r--.  1 root root    0 Jun 16 14:06 abc.txt.23745
-rw-r--r--.  1 root root    0 Jun 16 14:06 abc.txt.9479
-rw-r--r--.  1 root root    0 Jun 16 14:06 abc.txt.9480
统计一段时间内的系统调用
[root@localhost CAD_OneKeyDeploy]# strace -p 10095 -q -f  -s 10000 -e trace=desc -c
^C% time     seconds  usecs/call     calls    errors syscall
------ ----------- ----------- --------- --------- ----------------
 99.99    0.662317       22077        30           epoll_wait
  0.01    0.000063          15         4           poll
  0.00    0.000023          11         2           ioctl
------ ----------- ----------- --------- --------- ----------------
100.00    0.662403                    36           total
[root@localhost CAD_OneKeyDeploy]# strace -p 10095 -q -f  -s 10000 -e trace=network -c
^C% time     seconds  usecs/call     calls    errors syscall
------ ----------- ----------- --------- --------- ----------------
 73.33    0.000044          22         2           sendto
 26.67    0.000016           8         2           recvfrom
------ ----------- ----------- --------- --------- ----------------
100.00    0.000060                     4           total
用strace启动命令
strace java -Dspring.profiles.active=peer1 -jar /home/ceiec/jars/xxx.jar
只打印我们关注的调用:open
strace -e trace=open java -Dspring.profiles.active=peer1 -jar /home/ceiec/jars/xxx.jar

 浙公网安备 33010602011771号